0251
Mapping water exchange in the human brain using diffusion MRI with free waveform encoding1Medical Radiation Physics, Lund, Lund University, Lund, Sweden, 2Clinical Sciences Lund, Lund University, Lund, Sweden, 3Department of Radiology, Brigham and Women's hospital, Harvard Medical School, Boston, MA, United States, 4Department of Diagnostic Radiology, Clinical Sciences Lund, Lund University, Lund, Sweden, 5Russell H. Morgan Department of Radiology and Radiological Science, Johns Hopkins University School of Medicine, Baltimore, MD, United States, 6F. M. Kirby Research Center for Functional Brain Imaging, Kennedy Krieger Institute, Baltimore, MD, United States, 7Department of Diagnostic Radiology, Lund University, Lund, Sweden, 8Lund University Bioimaging Center, Lund University, Lund, Sweden, 9Department for Medical Imaging and Physiology, Skåne University Hospital, Lund, Sweden, 10Department of Radiology, University of Michigan, Ann Arbor, MI, United States
Synopsis
Temporal velocity correlations of diffusing particles carry information about the structure of the diffusion environment. Studying high-order velocity autocorrelation functions can aid in understanding how signal is influenced by restricted diffusion and exchange, and in turn how to design experiments that are sensitive/independent to these phenomena. In this work, we employ numerical simulations on a variety of substrates to demonstrate this notion. We find that the fourth order velocity autocorrelation bears a distinctive signature of exchanging systems. In addition, we highlight that the effect of exchange on the second order velocity autocorrelation is negligible when exchange is barrier-limited.
Introduction
Probing restricted diffusion and water exchange with diffusion MRI is important since it provides sensitivity to cell sizes and membrane permeability1. Previous work has demonstrated the utility of such measurements for characterising tumours2,3,4. However, restricted diffusion and exchange have opposite effects on the signal, making them a challenge to probe by varying the diffusion time in a single diffusion encoding experiment5,6,7. A unified theory and experimental approach capturing both effects has previously been proposed that leverage the increased sensitivity and specificity afforded by free waveform encoding6. Here we apply this approach to map restriction and exchange in a glioma patient as well as healthy volunteers. Results show plausible exchange estimates and a strong exchange contrast in the cerebellum.Theory
The effects of restricted diffusion and exchange on the diffusion weighted signal can be captured by the following signal representation6$$ \ln(S/S_0) \approx -b \cdot [E_D + V_{\omega}E_R] + \frac{1}{2}b^2 \cdot [V_D + V_{\omega}C_{DR} + V_{\omega}^2V_R] \cdot (1 - k\Gamma) \hspace{42pt} (1)$$
wherein three parameters ($$$b, V_{\omega}$$$ and $$$\Gamma$$$) describe the experiment and six parameters ($$$E_D, E_R, V_D, C_{DR}, V_R$$$ and $$$k$$$) describe the microstructure. $$$b$$$ is the diffusion encoding strength, $$$V_{\omega}$$$ controls the restriction weighting of a gradient waveform, $$$g(t)$$$, and is given by
$$V_{\omega} = \frac{\gamma^2}{b}\int_0^Tg^2(t)dt \hspace{42pt} (2).$$
$$$\Gamma$$$ controls the exchange weighting and is defined through
$$ \Gamma = \int_0^T\tilde{q_4}(t)dt \hspace{42pt} (3).$$
where $$$ \tilde{q_4}(t) = \frac{1}{b^2}\int_0^Tq^2(t')q^2(t'+t)dt'$$$ is the fourth-order correlation function of the dephasing q-vector. The parameters $$$\Gamma$$$ and $$$V_{\omega}$$$ allow the selection of gradient waveforms that selectively encode exchange or restriction. Regarding the microstructure parameters, $$$E_D$$$ and $$$E_R$$$ are the mean free diffusivity and restriction coefficient and $$$V_D$$$ and $$$V_R$$$ are the intra-voxel variances of $$$D$$$ and $$$R$$$ while $$$C_{DR}$$$ is the covariance between the two.
Methods
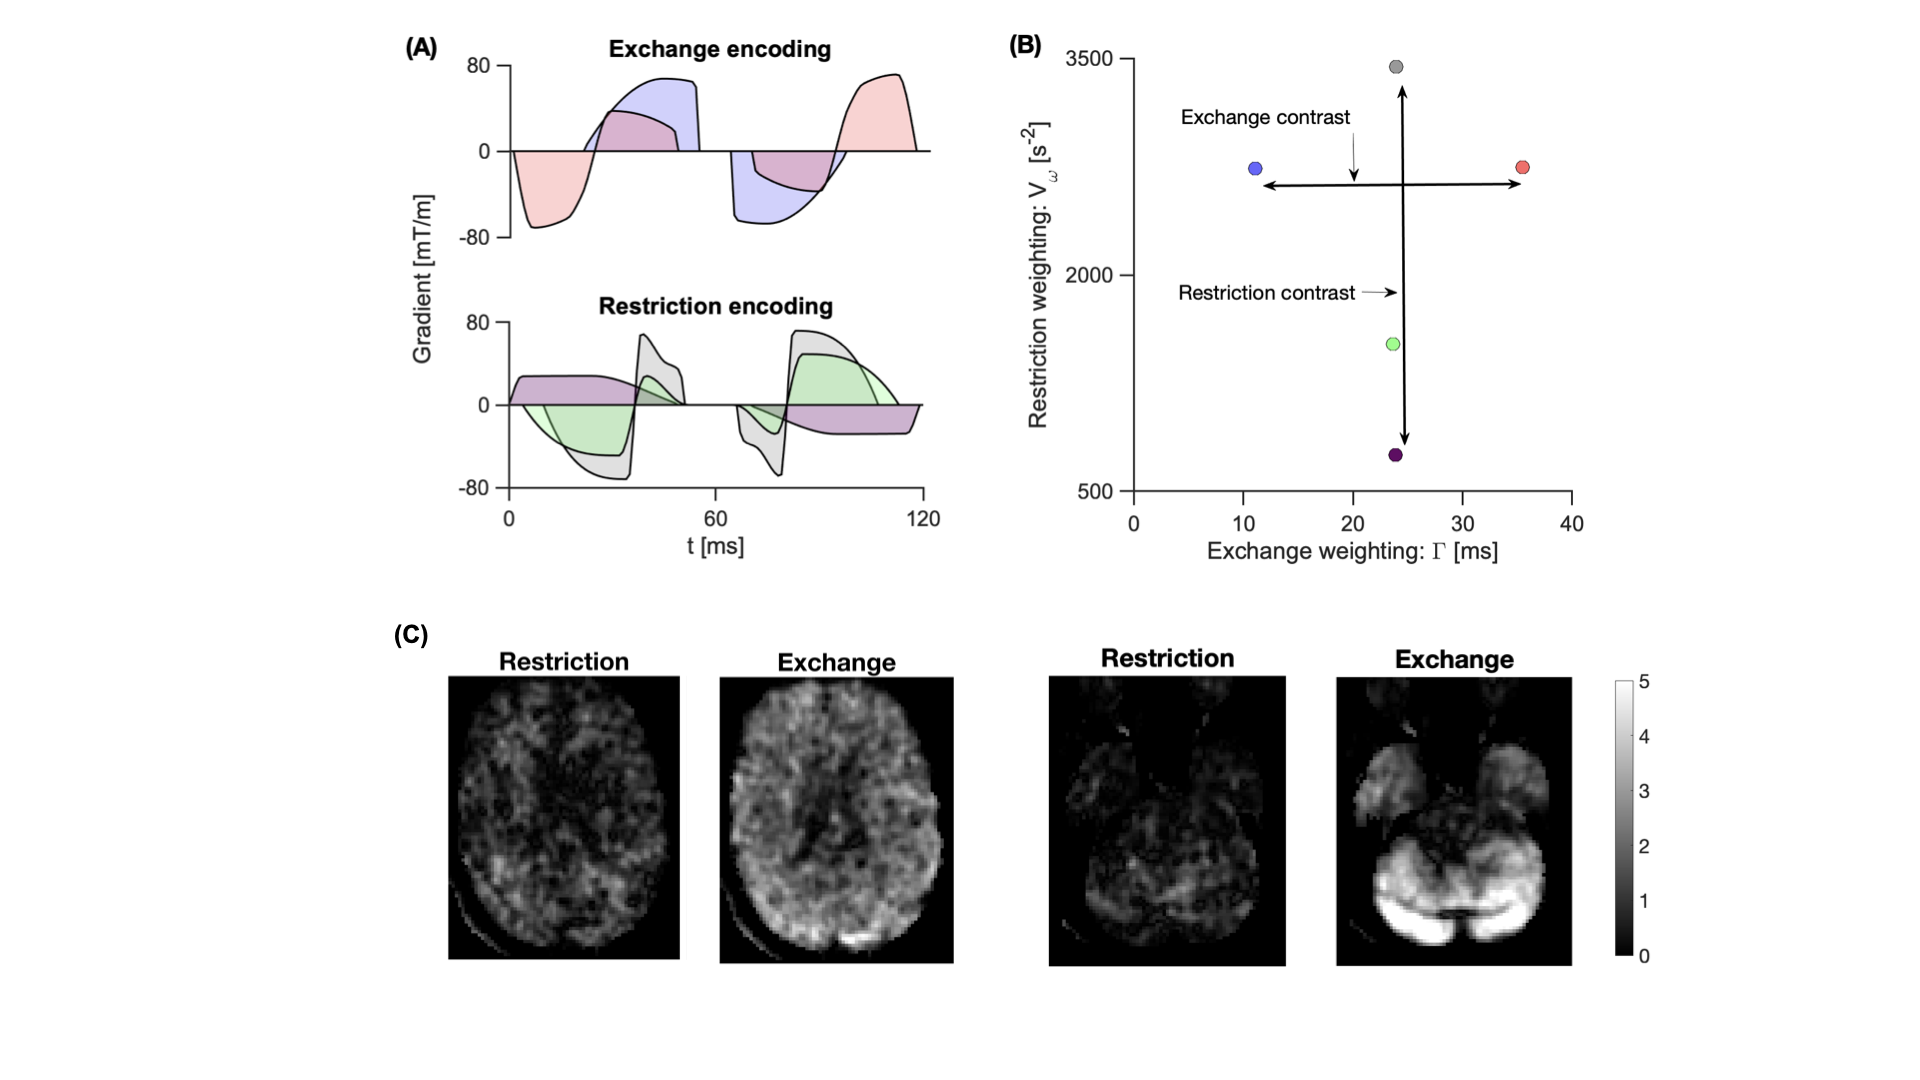
Our first objective was to build an experimental protocol comprising waveforms sensitive either to restricted diffusion or exchange. This was achieved by designing five waveforms distributed along the two orthogonal axes “restriction-weighting” and “exchange-weighting” as shown in Fig.1. The waveforms had a maximum encoding time of 120 ms, maximum b-value of 5 µm$$$^2$$$/ms at a gradient strength of 80mT/m. The protocol was implemented on a 3T MAGNETOM Prisma (Siemens Healthcare, Germany) using a prototype pulse sequence that enables user-defined gradient waveforms9.Experiment 1:
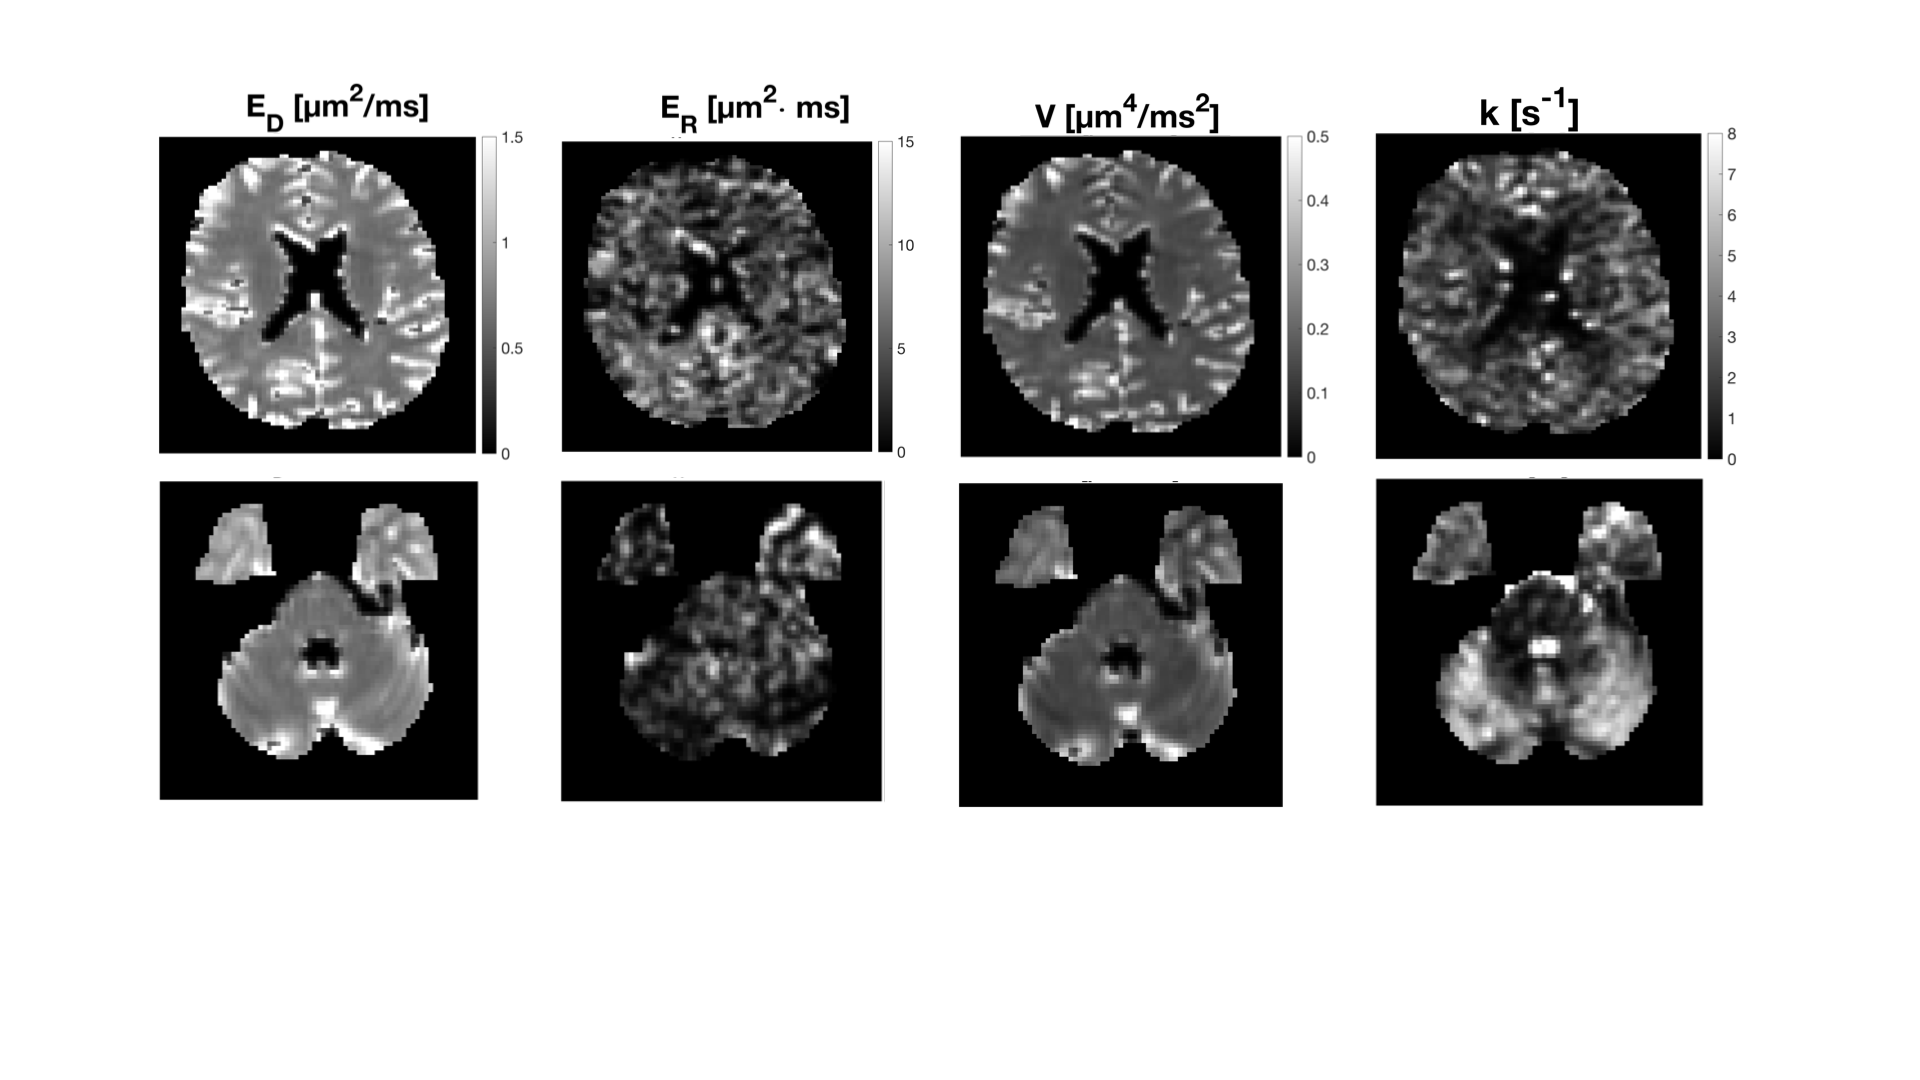
A whole-brain scan was performed in a healthy volunteer using TE = 136 ms, TR = 3.5 s, b = [0-5,0,0] ms/µm$$$^2$$$ in 42 directions, resolution 2x2x5 mm$$$^3$$$ (acquisition time: 12 minutes). Equation 1 was then fitted to powder-averaged data, with $$$V_R$$$ and $$$C_{DR}$$$ were set to zero because $$$V_D$$$ dominates the variance term for the waveforms in our protocol. In addition, we show the subtraction of images acquired at a b-value of 5 ms/µm$$$^2$$$ but with waveforms at different positions along either the restricted-diffusion axis (highest-lowest $$$V_{\omega}$$$) or exchange axis (longest-shortest $$$\Gamma$$$). This shows the sensitivity to either restricted diffusion or exchange.
Experiment 2:
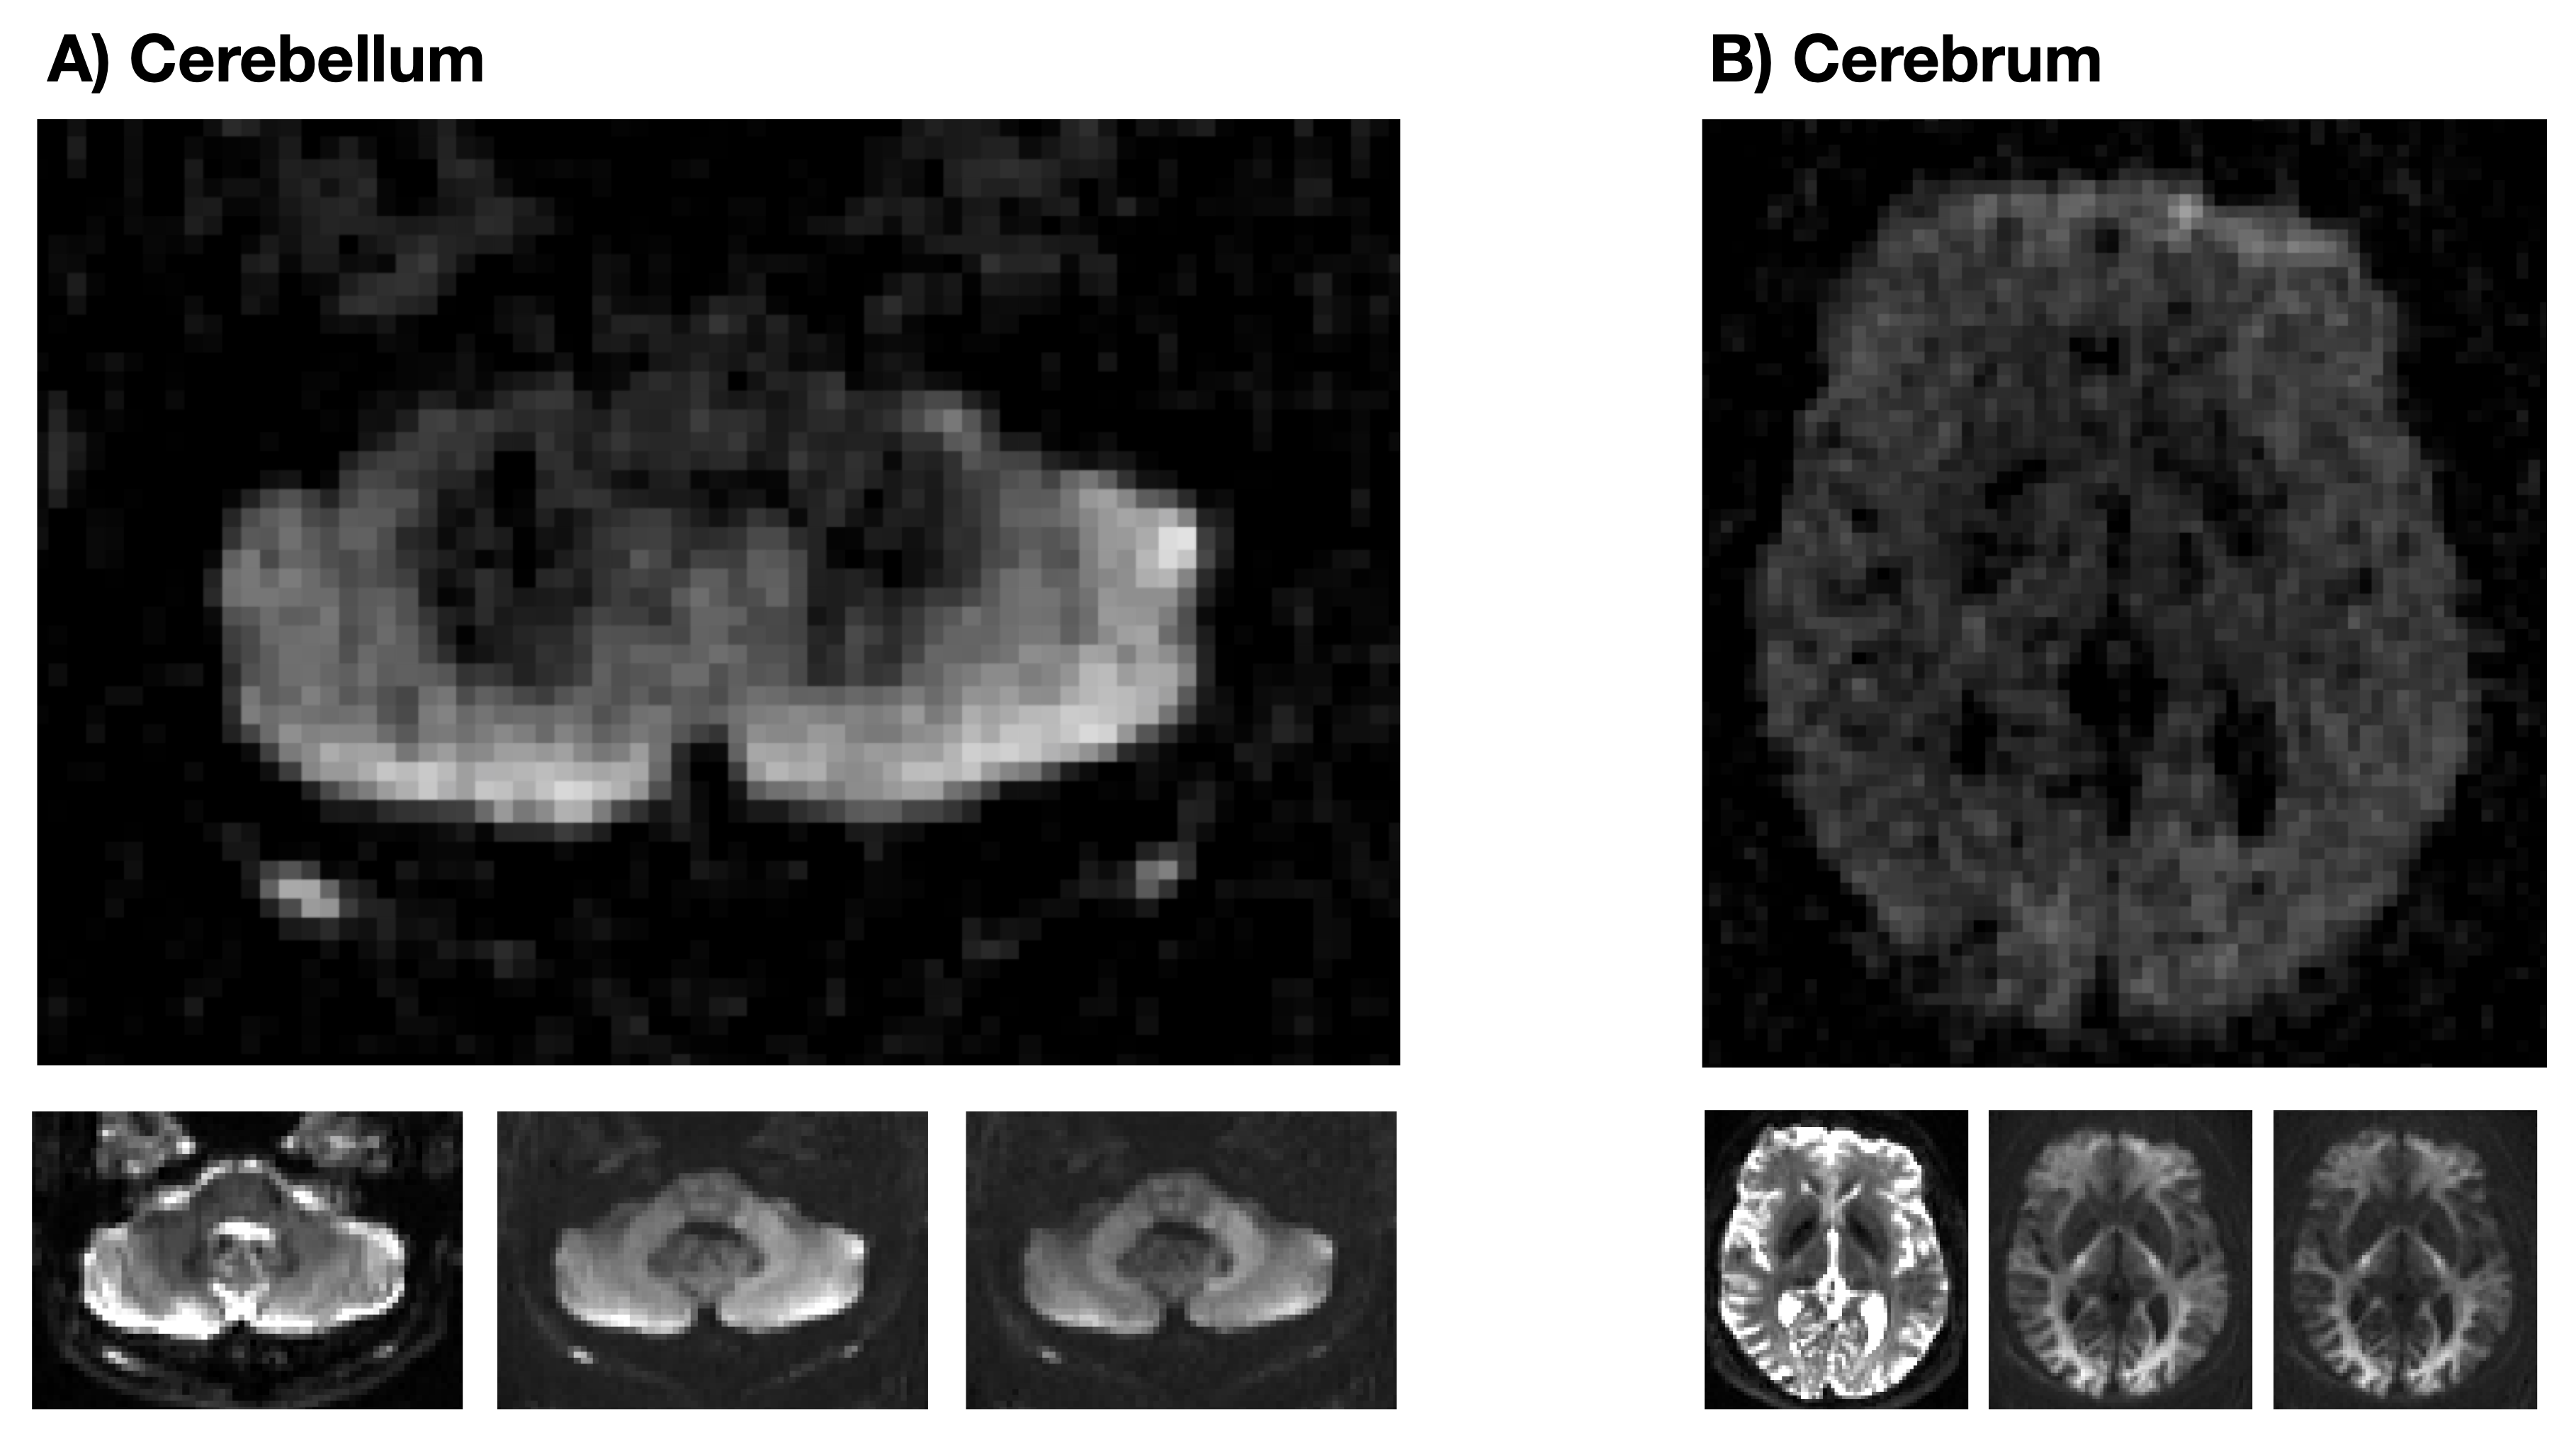
The outcome of the first experiment motivated the acquisition of a high-resolution image of the cerebellum. Therefore, we scanned another healthy volunteer at a resolution of 2x2x3 mm$$$^3$$$ where noise floor effects were suppressed by the super-resolution approach described in 8. Imaging parameters were TE = 136 ms, TR = 1.6 s, a single b-value of 5 ms/µm$$$^2$$$ in 30 directions, and acquisition time of 40 minutes. Two waveforms with equal restriction-weighting and different exchange-weighting were used to acquire data. The signal difference was used to display the effect of exchange.
Experiment 3:
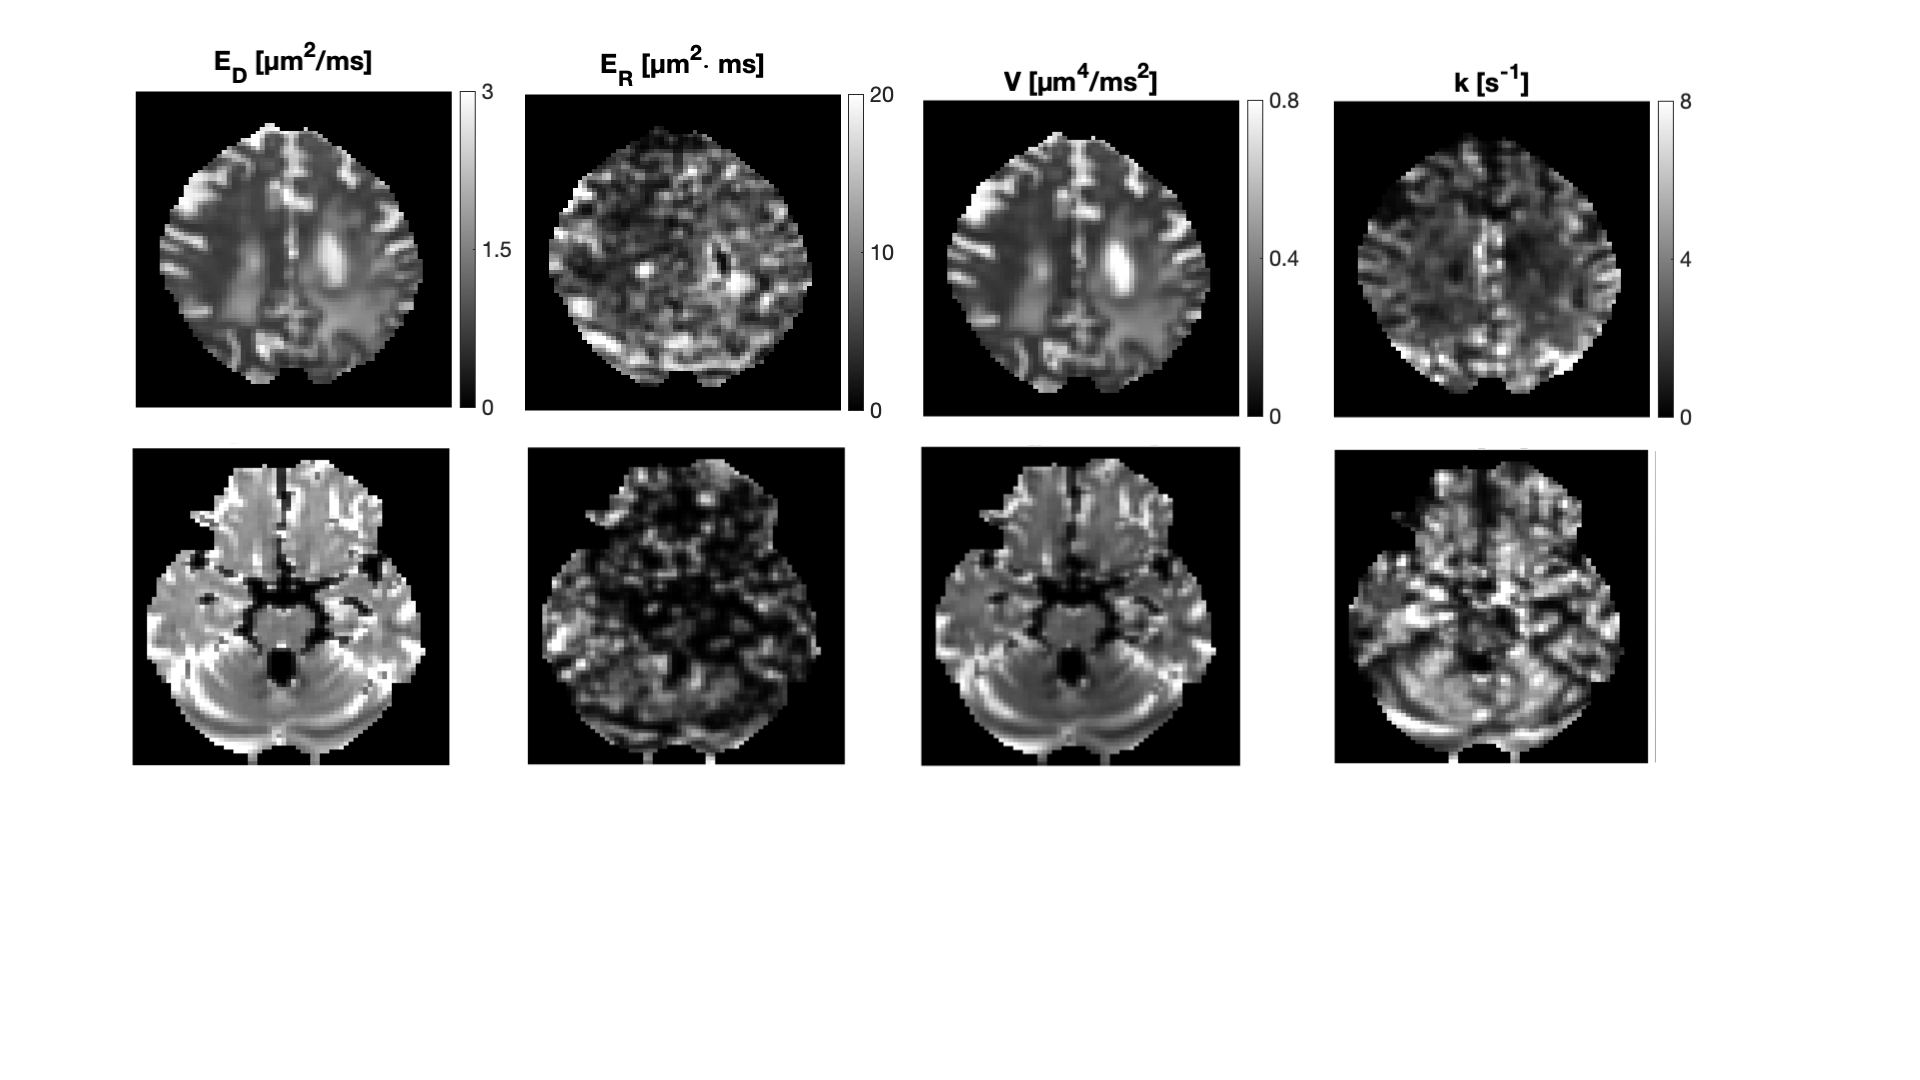
Lastly, data was acquired in a glioma patient using the same protocol as in experiment 1. The tumour was located in the parietal lobe surrounded by an extended oedematous region. Data analysis was performed by fitting equation 1.
Results
The difference images in Fig.1 indicate a low restriction contrast in the cerebrum, whereas a prominent exchange effect was observed in the cerebellum and to a lesser degree in the cerebrum. The parameter maps in Fig.2 suggest higher exchange rates in the cerebellum compared to the cerebrum, which reflects the findings presented in Fig.1. Difference images from the super-resolution reconstructed data in Fig.3 shows the same strong exchange contrast in the cerebellum observed in experiment 1. Furthermore, the effect appears to emanate from the cerebellar cortex and not from the nuclei. Figure 4 shows fitted parameters obtained from the glioma patient. The region of abnormality manifests as an area of reduced exchange rate.Discussion
The unified restriction-exchange framework proposed in previous work can be applied to map restricted diffusion and exchange in vivo. Despite considerable noise in the parameter maps, the estimated exchange rates are in harmony with literature values10,11,12,13. Using this unified framework, we expose independent contrasts as seen by the strong exchange effect in the cerebellum. The cerebellum is a complex structure comprising large, densely packed cells14. Our work suggests that time-dependence in the cerebellum is strongly driven by exchange as opposed to restriction. In this light, it is important to note that strong contrast in the cerebellum has been observed in other high-b-value studies not designed to probe exchange15. Future work will focus on correlating the current findings with other exchange-probing techniques such as filter exchange imaging (FEXI).Acknowledgements
We thank Siemens Healthcare (Erlangen, Germany) for access to the pulse sequence programming environment.References
1. Reynaud O. Time-Dependent Diffusion MRI in Cancer: Tissue Modeling and Appli- cations. Front Phys. 2017 Nov;5
2. Nilsson M, Lätt J, Westen D van, Brockstedt S, Lasič S, Ståhlberg F, et al. Noninvasive mapping of water diffusional exchange in the human brain using filter-exchange imaging. Magnetic Resonance in Medicine. 2013a;69(6):1572–80
3. Lampinen, B., Szczepankiewicz, F., van Westen, D., Englund, E., C Sundgren, P., Lätt, J., Ståhlberg, F. and Nilsson, M. (2017), Optimal experimental design for filter exchange imaging: Apparent exchange rate measurements in the healthy brain and in intracranial tumors. Magn. Reson. Med., 77: 1104-1114.
4. Lasič S, Oredsson S, Partridge SC, Saal LH, Topgaard D, Nilsson M, Bryskhe K. Apparent exchange rate for breast cancer characterization. NMR Biomed. 2016 May;29(5):631-9
5. Price WS, Barzykin AV, Hayamizu K, Tachiya M. A Model for Diffusive Transport through a Spherical Interface Probed by Pulsed-Field Gradient NMR. Biophysical Journal. 1998 May 1;74(5):2259–71
6. Nilsson M, Westin C-F, Brabec J, Lasič S, Szczepankiewicz F. A unified framework for analysis of time-dependent diffusion: numerical validation of a restriction-exchange correlation experiment.Proceedings of ISMRM Montreal, QC, Canada. 2019
7. Olesen JL, Østergaard L, Shemesh N, Jespersen SN. Diffusion time dependence, power-law scaling, and exchange in gray matter. arXiv:210809983 [physics] [Internet]. 2021 Aug 23 [cited 2021 Oct 3]; Available from: http://arxiv.org/abs/2108.09983
8. Vis G, Nilsson M, Westin CF, Szczepankiewicz F. Accuracy and precision in super-resolution MRI: Enabling spherical tensor diffusion encoding at ultra-high b-values and high resolution. Neuroimage. 2021 Oct 21;245
9. Szczepankiewicz F, Sjölund J, Ståhlberg F, Lätt J, Nilsson M. Tensor-valued diffusion encoding for diffusional variance decomposition (DIVIDE): Technical feasibility in clinical MRI systems. PLOS ONE. 2019a Mar 28;14(3):e0214238
10. Pfeuffer J, Flögel U, Dreher W, Leibfritz D. Restricted diffusion and exchange of intracellular water: theoretical modelling and diffusion time dependence of 1H NMR measurements on perfused glial cells. NMR Biomed. 1998 Feb;11(1):19–31
11. Pfeuffer J, Provencher SW, Gruetter R. Water diffusion in rat brain in vivo as detected at very large b values is multicompartmental. MAGMA. 1999 May;8(2):98–108
12. Meier C, Dreher W, Leibfritz D. Diffusion in compartmental systems. I. A comparison of an analytical model with simulations. Magn Reson Med. 2003 Sep;50(3):500–9
13. Quirk JD, Bretthorst GL, Duong TQ, Snyder AZ, Springer CS, Ackerman JJH, et al. Equilibrium water exchange between the intra- and extracellular spaces of mammalian brain. Magn Reson Med. 2003 Sep;50(3):493–9
14. Salamon N, Sicotte N, Drain A, Frew A, Alger JR, Jen J, Perlman S, Salamon G. White matter fiber tractography and color mapping of the normal human cerebellum with diffusion tensor imaging. J Neuroradiol. 2007 May;34(2):115-28
15. Tax CMW, Szczepankiewicz F, Nilsson M, Jones DK. The dot-compartment revealed? Diffusion MRI with ultra-strong gradients and spherical tensor encoding in the living human brain. Neuroimage. 2020 Apr 15;210:116534
Figures