0248
Integrating time division multiplexing (TDM) and simultaneous multi-slice (SMS) for accelerating combined diffusion-relaxometry1Department of Psychiatry, Brigham and Women’s Hospital, Harvard Medical School, Boston, MA, United States, 2Wellcome Centre for Integrative Neuroimaging, FMRIB Division, Nuffield Department of Clinical Neurosciences, University of Oxford, Oxford, United Kingdom, 3Department of Radiology, Brigham and Women’s Hospital, Harvard Medical School, Boston, MA, United States, 4Fetal-Neonatal Neuroimaging and Developmental Science Center, Boston Children’s Hospital, Harvard Medical School, Boston, MA, United States
Synopsis
We introduce an MRI sequence that integrates the time-division multiplexing (TDM) technique and simultaneous multi-slice (SMS) method to achieve a high slice-acceleration (~6x) factor for acquiring relaxation-diffusion MRI. Two variants of the sequence, i.e., TDM3e-SMS and TDM2s-SMS, were developed to simultaneously acquire slice groups with 3 distinct echo times (TEs) and 2 slice groups with the same TE, respectively. Both sequences were evaluated on a 3T scanner with in-vivo human brains and compared with standard single-band (SB) EPI and SMS-EPI using diffusion measures and tractography results. Results have shown that TDM-SMS provides reliable measures for relaxation-diffusion and standard diffusion MRI.
Introduction
Combined diffusion-relaxometry includes diffusion MRI (dMRI) acquired with multiple echo times (TEs)1. Several recent studies have shown that it can improve the sensitivity and specificity of tissue microstructure measures using in vivo measurements2-5. However, the acquisition protocol with multiple echo time (TE) significantly prolongs the scan time making it not feasible in most neuroimaging research. Recently, we proposed a time division multiplexing EPI (TDM-EPI) as a new slice-acceleration technique to reduce the scan time of relaxation-diffusion MRI6. In this work, we introduce a sequence that integrates TDM with the simultaneous multi-slice (SMS) imaging technique to further accelerate combined diffusion-relaxometry.Methods
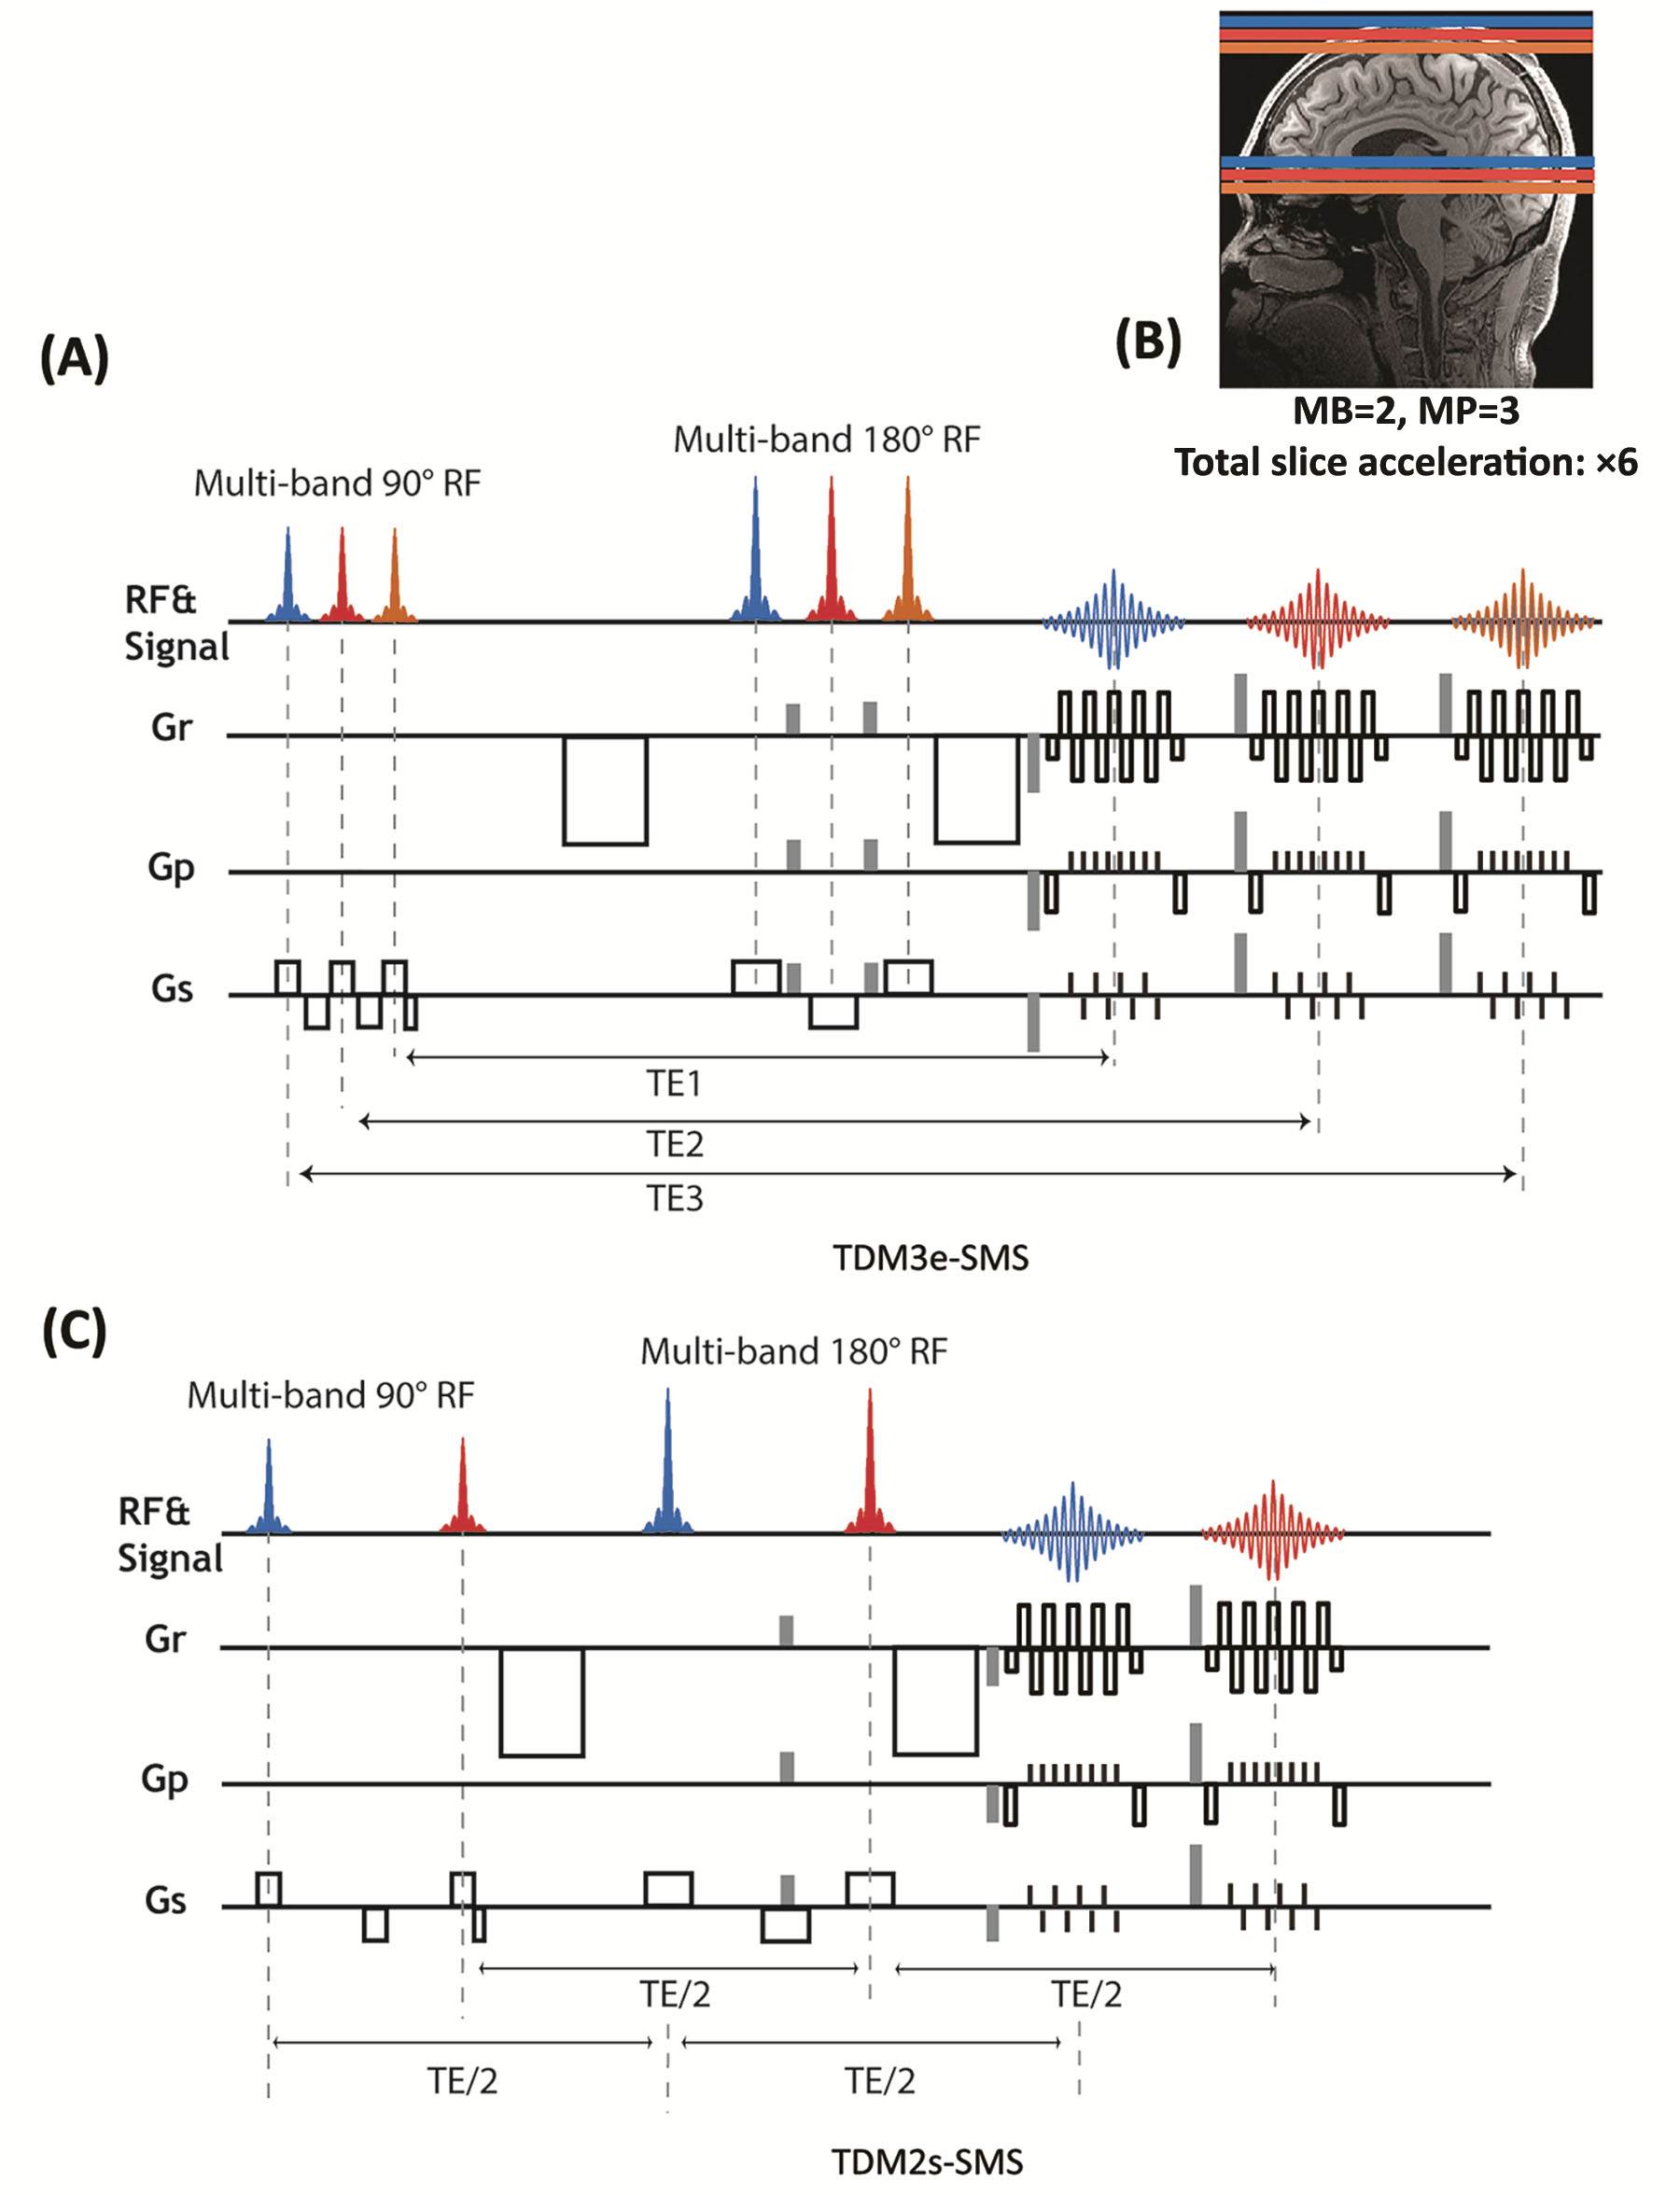
Pulse sequence implementation:Figure 1 shows a schematic diagram of the proposed sequences. In Figure 1A, three pairs of 90° and 180° multi-band (MB) RF pulses are applied to successively excite and refocus three separate SMS slice groups. The echo-shifting gradients (gray color) are applied to disentangle the echo signals from multiple slice groups. To avoid double diffusion encoding effect7, echo-shifting gradient was applied adaptively perpendicular to the diffusion gradient Compared with our previous SB-EPI version(6), the slice selection gradient of the central 180° MB RF are applied in the opposite direction of the other two, so that no additional rephasing gradients are needed to compensate for the dispersion caused by the slice-selection gradients. This sequence will be referred to as TDM3e-SMS. The integrated TDM-SMS sequence extends the slice coverage compared to the standard SMS sequence or the SB version of TDM sequence. In Figure 1C, we illustrate the configuration of the accelerated TDM-SMS for single-TE acquisition, referred to as TDM2s-SMS, where the order of RF pulses was changed so that the two SMS slice groups can be acquired at the same TE.
In vivo data acquisition:
All MRI measurements were performed on a 3T MAGNETOM Prisma scanner. All diffusion weighted images were acquired with the following parameters: TR = 3400 ms, field of view (FOV) = 200×200 mm2, matrix size = 100×100, slice thickness = 2.0 mm, partial Fourier = 6/8, MB acceleration factor of 2 for all TDM-SMS sequences, in-plane GRAPPA acceleration factor R of 3, 2, and 3, for TDM2s-SMS, TDM2e-SMS, and TDM3e-SMS, respectively, and bandwidth = 2000 Hz/pix. dMRI data were acquired along 30 gradient directions at b = 500, 750, 1500, 2250, 3000 s/mm2 together with multiple non-diffusion-weighted (b=0 s/mm2) images. TDM3e-SMS sequence was acquired at a TE set of (79 ms, 108 ms, 137 ms) and TDM2s-SMS sequence was acquired at TE=82ms. The reference images with same parameters were acquired using standard EPI sequence.
Data processing and analysis:
MRI images were reconstructed offline with MATLAB using a parallel imaging method-GRAPPA combined with Nyquist ghost correction8,9, and split slice-GRAPPA (leak block) method10. The reconstructed images were then processed for eddy current correction, motion correction, and B0 inhomogeneity with TOPUP and EDDY from the FSL software. The relative errors between the images with different acceleration factor and the reference images are computed to illustrate systematic bias in image intensity caused by different slice acceleration techniques. The DKI metrics were calculated using DTIFIT from FSL. Whole brain tractography was performed using a two-tensor unscented Kalman filter (UKF) method11.
Results
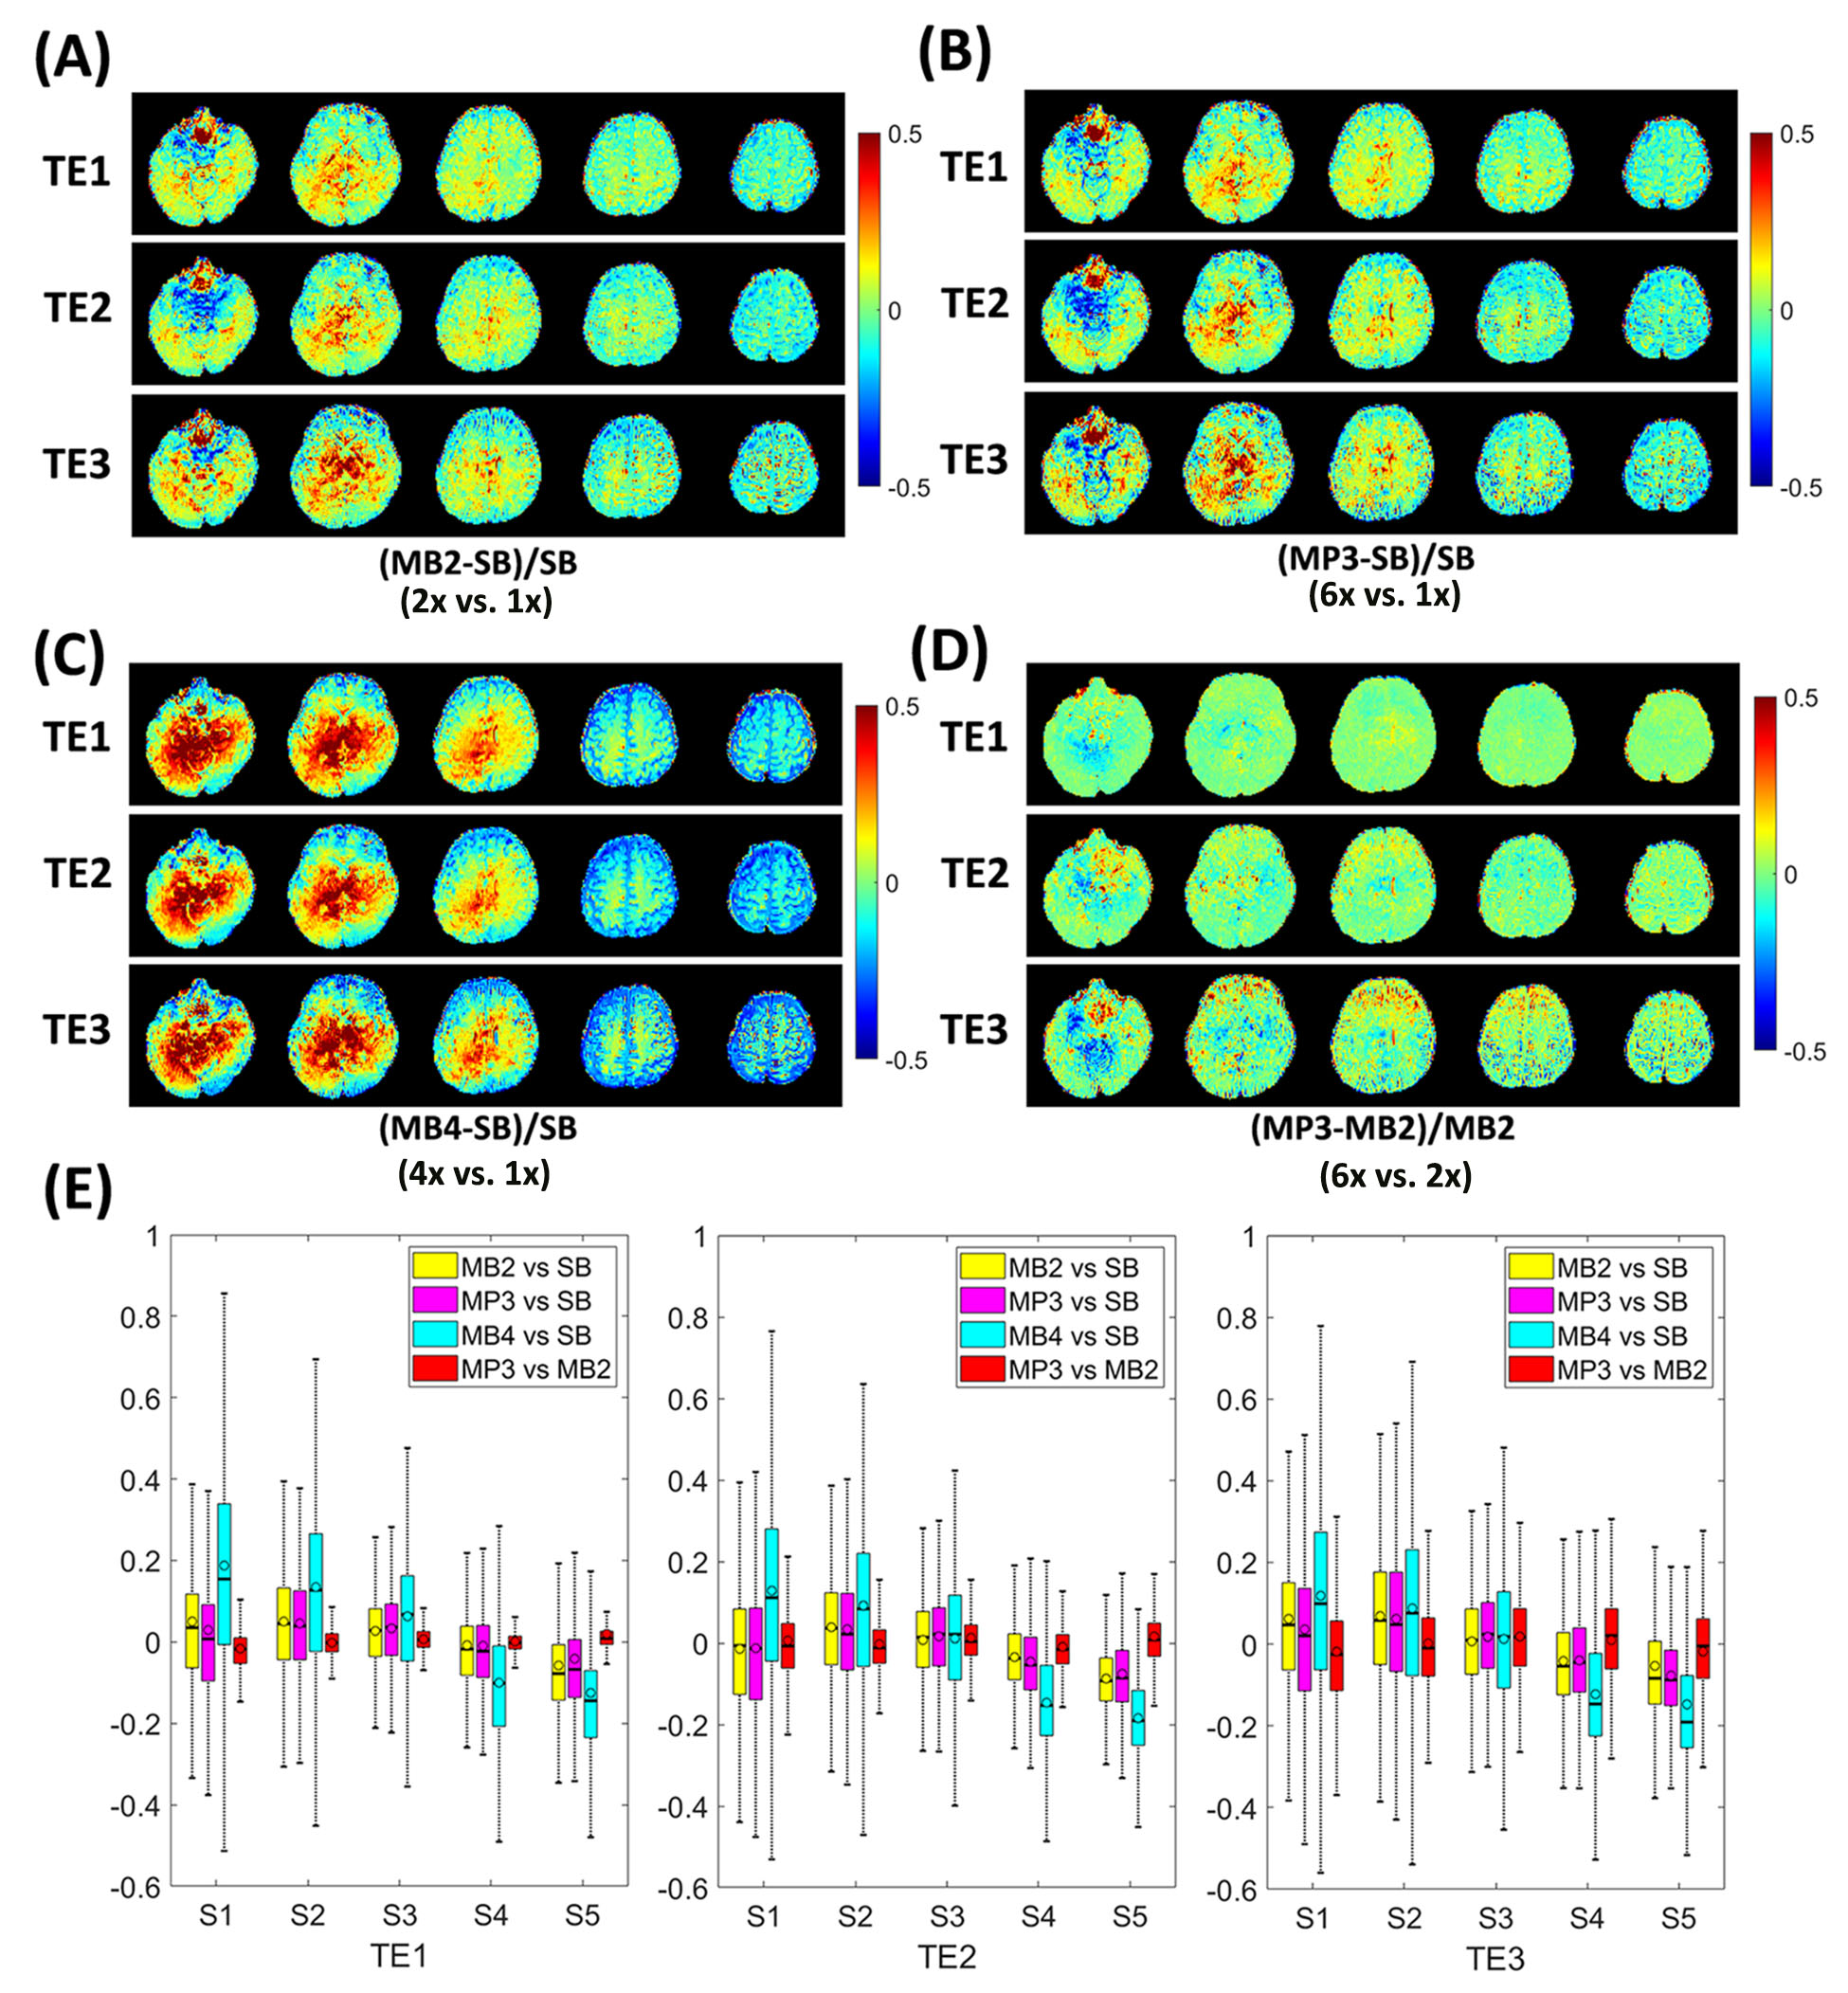
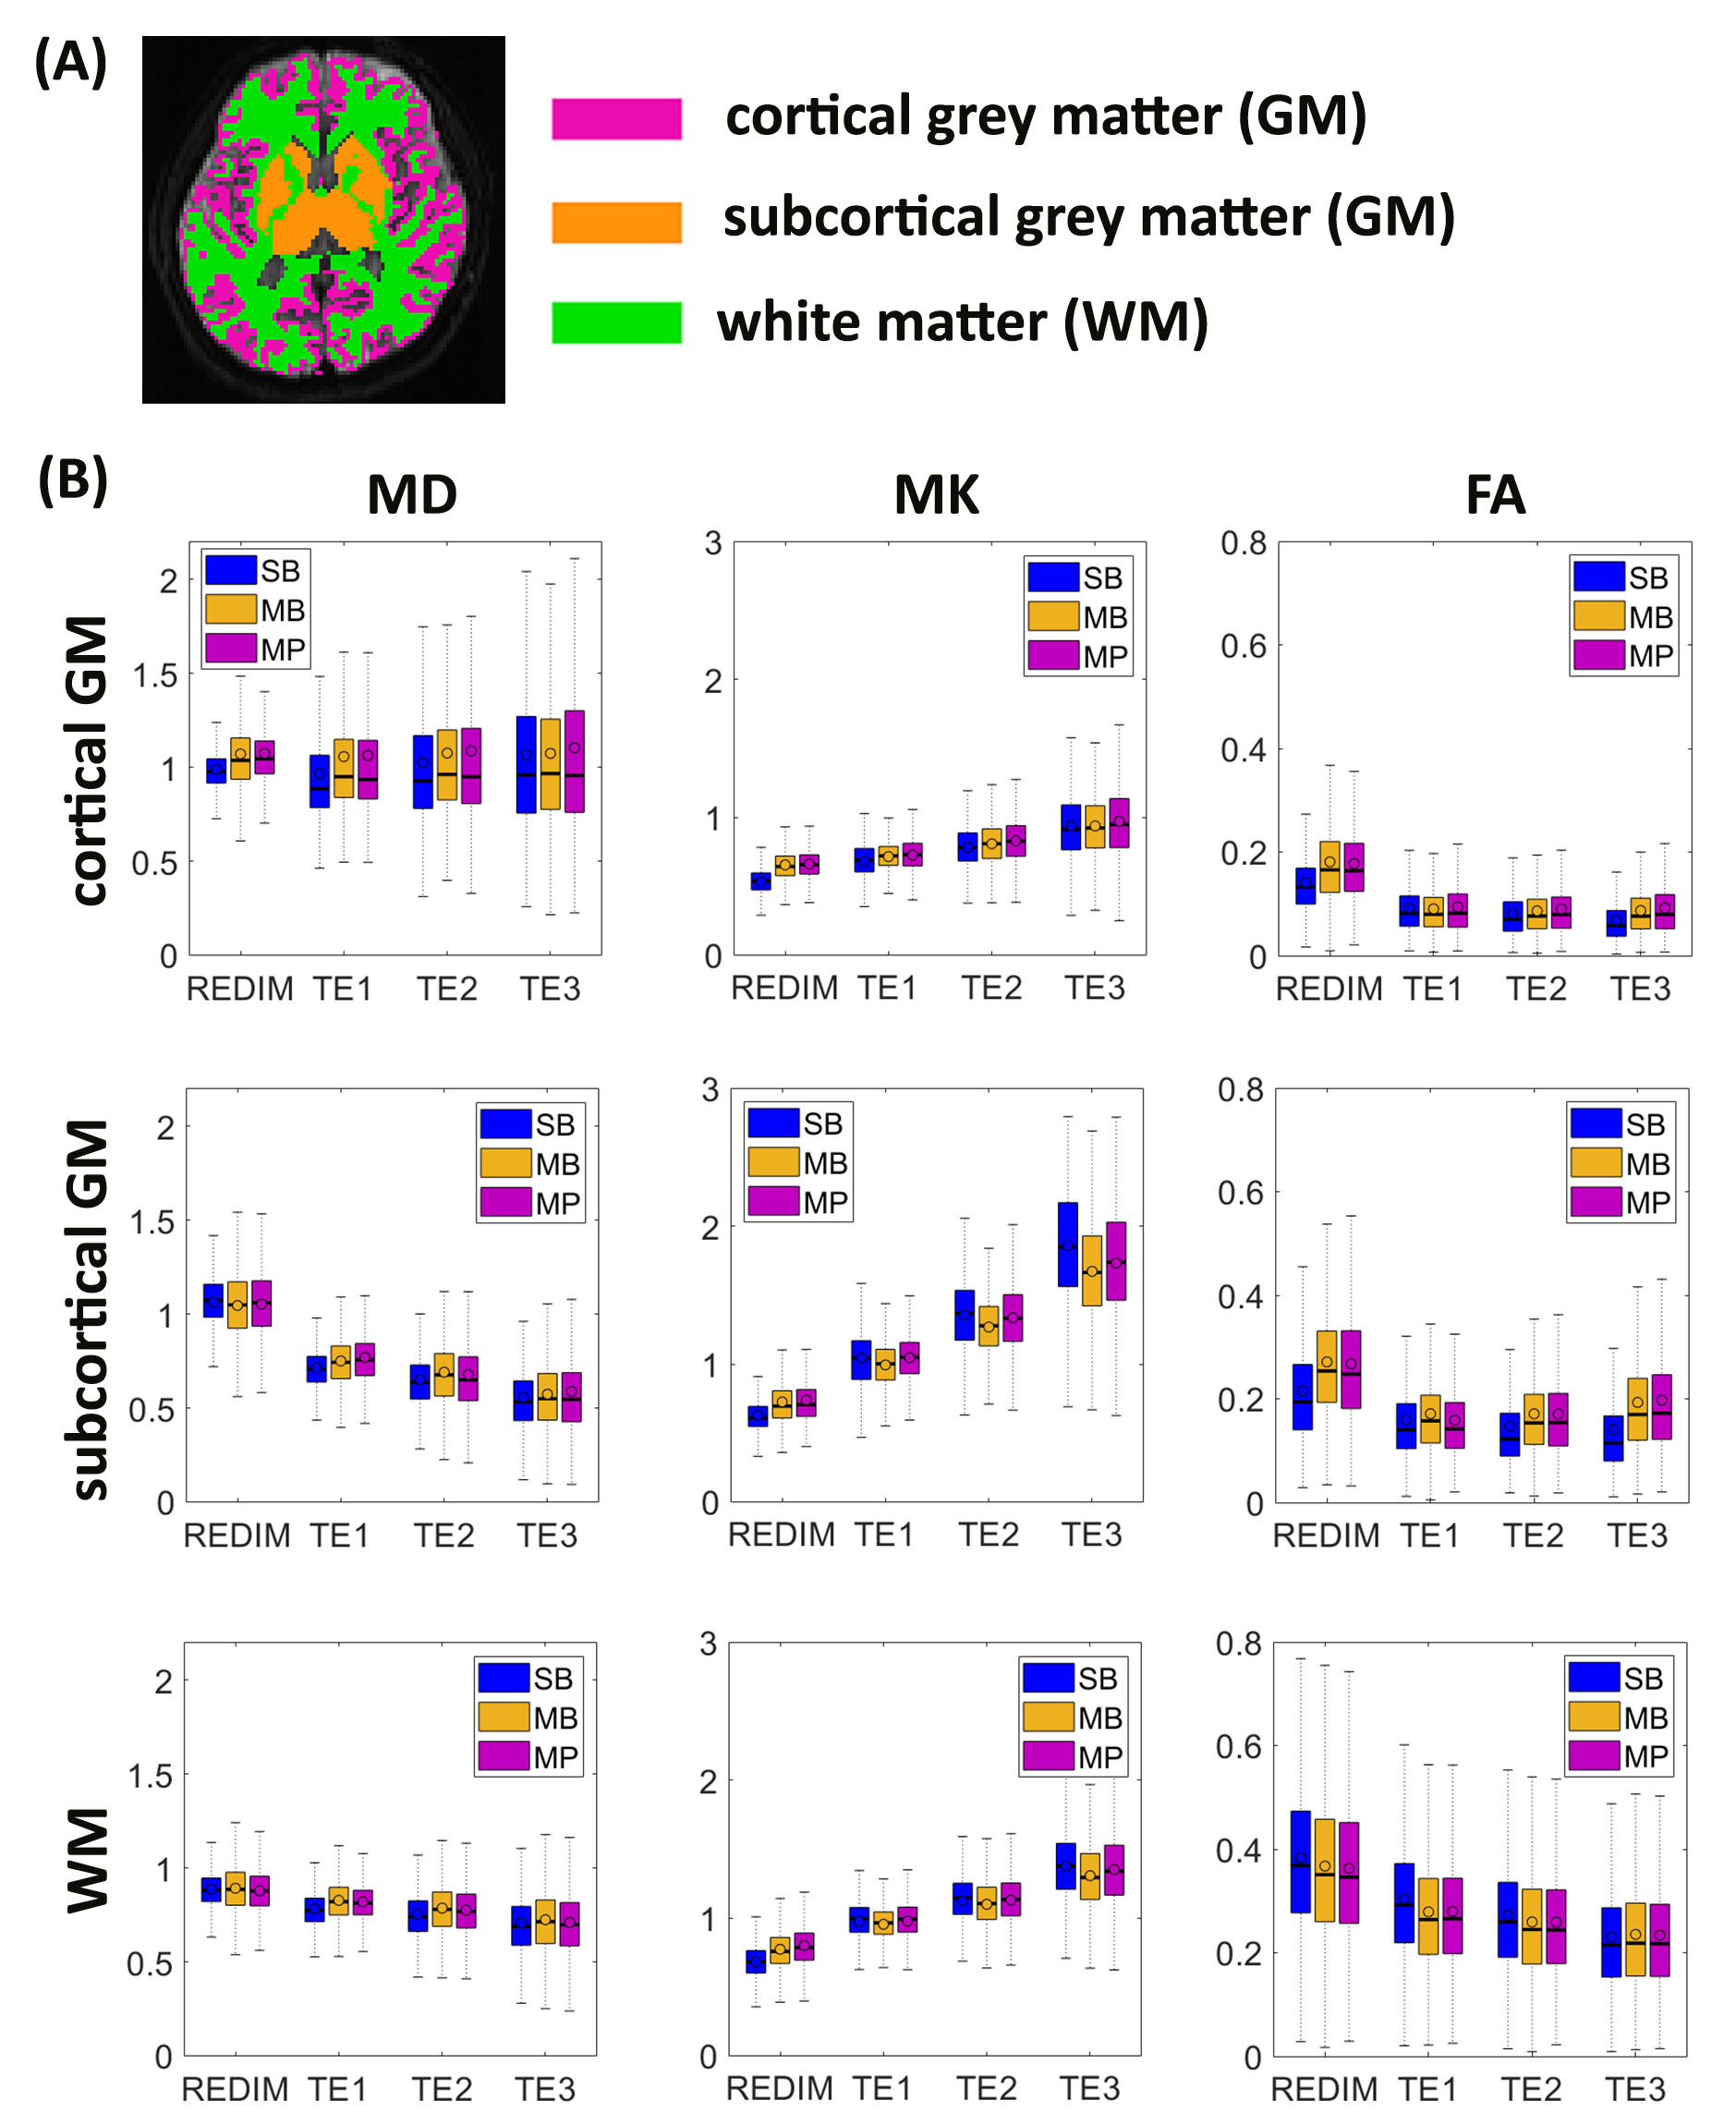
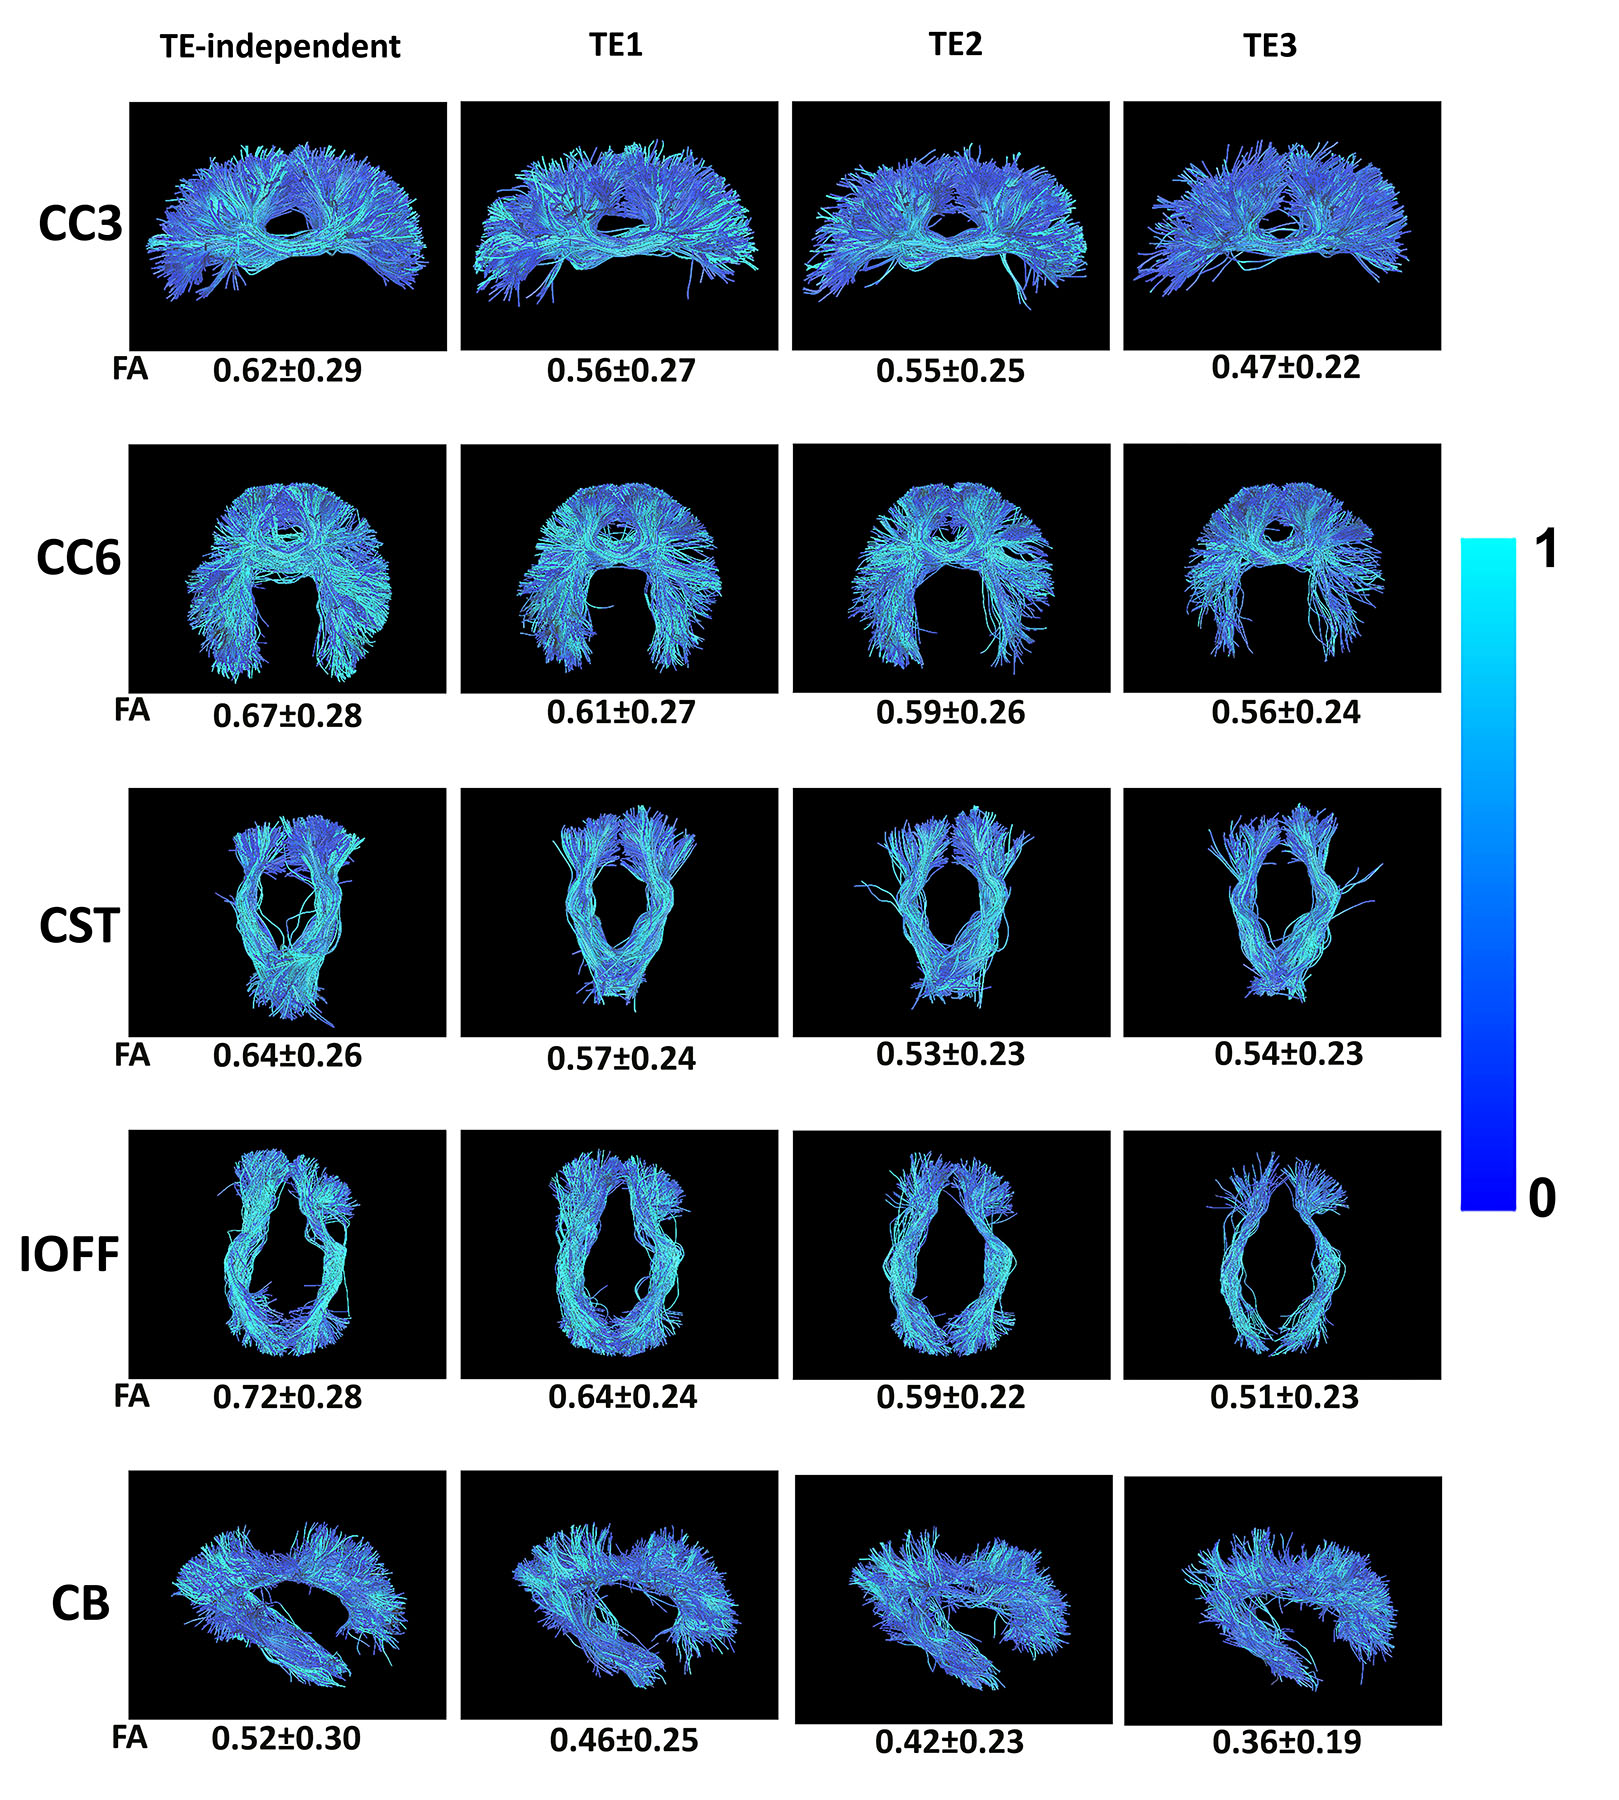
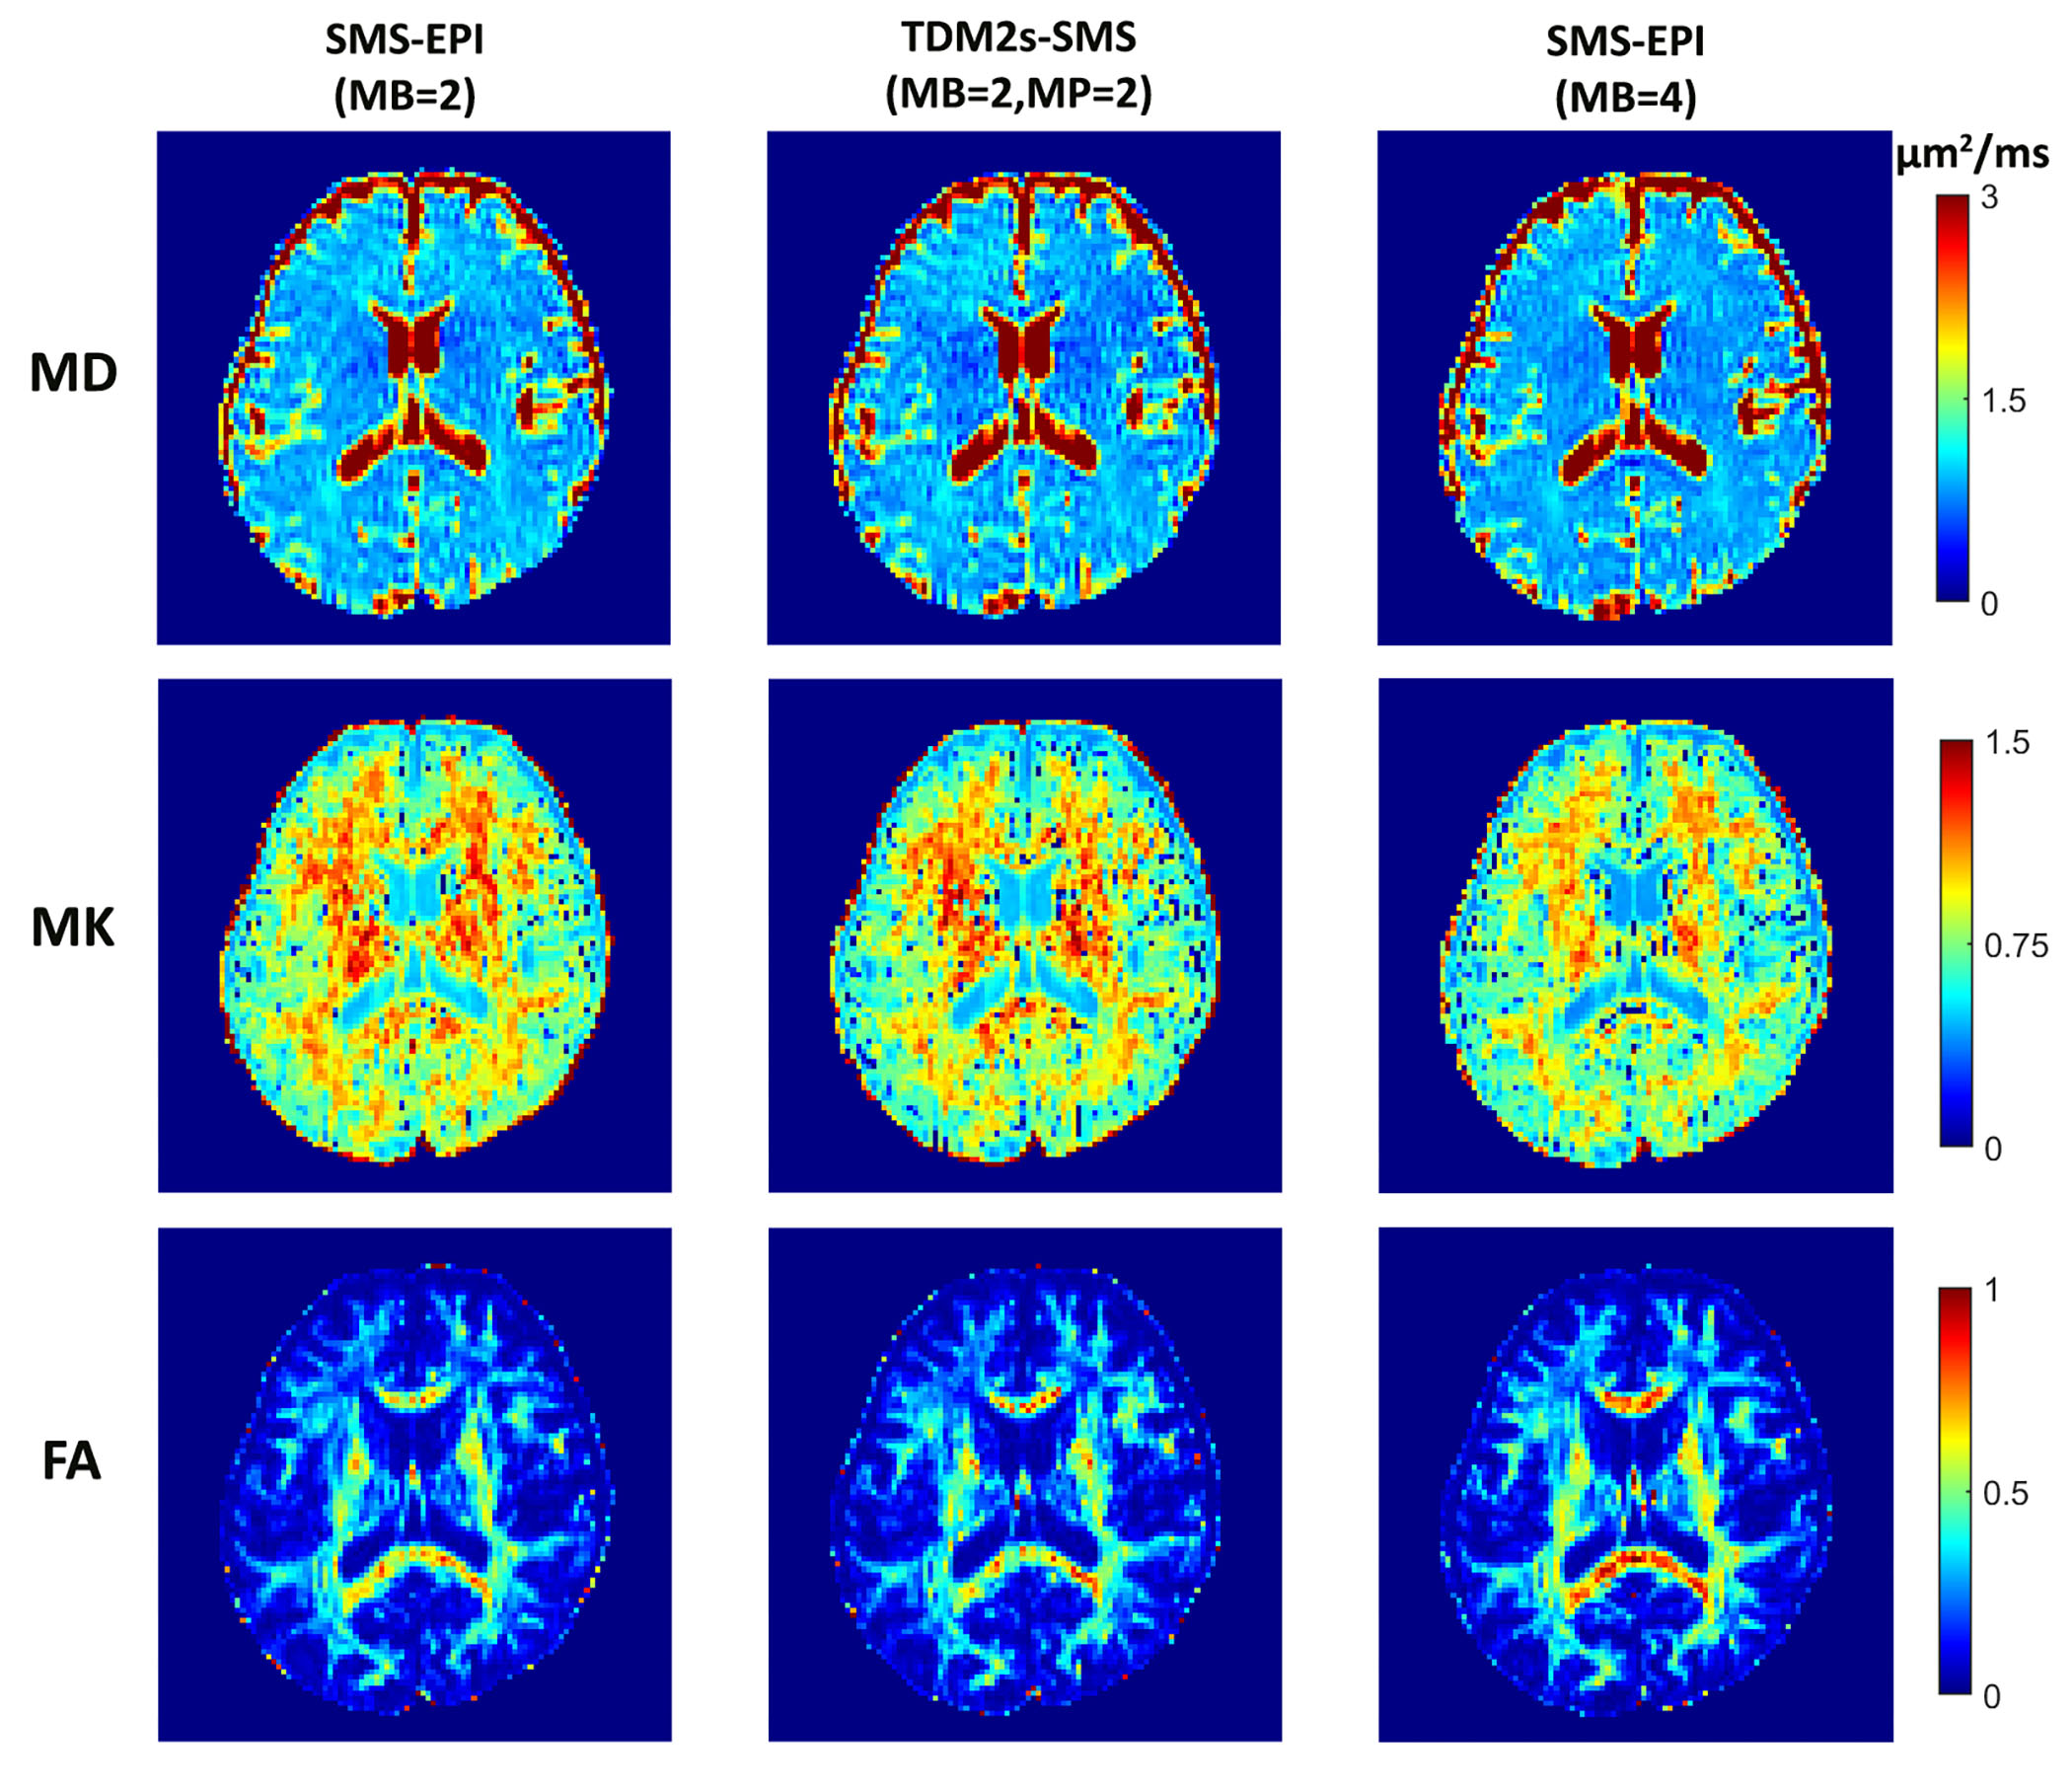
Figure 2 shows the relative error maps between the images obtained from sequences with different slice acceleration factors and the corresponding reference. The boxplots show that a higher MB factor, e.g., MB=4, can lead to more significant bias in signal intensity compared to SB images. The TDM-SMS method (MP3, total acceleration factor=6) does not lead to significant bias compared to standard MB image (MB2). The boxplots in Figure 3 show the DKI-derived MD, MK and FA metrics for a set of cortical gray matter (GM), subcortical GM and white matter (WM) ROIs with different TE as well as using the estimated TE-independent data using the REDIM method. Results from the TDM-SMS method (shown as MP) all have similar values as the standard MB method. Figure 4 shows the fiber tracking results of five representative WM fiber bundles using data acquired at different TE as well as the TE-independent data12. The mean and standard deviation of the FA of the fiber bundles are displayed under each figure. Figure 5 shows the DKI-based diffusion measures for one representative slice from TDM2s-SMS (center column, MP=2, MB=2) and SMS-EPI sequences with MB=2 (left column) and MB=4 (right column).Discussion and Conclusion
In this study, we developed a new sequence that integrates the TDM method with SMS for EPI to achieve a very high slice acceleration factor. This innovation enables the acquisition of relaxation-diffusion MRI in a much shorter time than standard SMS-EPI. The contributions of this work include the development of the TDM-SMS sequence for accelerating relaxation-diffusion MRI, comprehensive examination of sequence-dependent imaging results and comparison of TE-dependent diffusion measures using different sequences. TE-dependent diffusion measures have shown that joint analysis of relaxation-diffusion imaging can provide useful information about tissue microstructure that cannot be probed using standard dMRI. The proposed TDM-SMS can significantly reduce the scan time of relaxation-diffusion MRI enabling its more broad application in neuroscience research.Acknowledgements
This study was supported in part by NIH grants R21MH116352, R21MH126396, K01MH117346, R01MH119222, R01MH116173, R01MH125860, P41EB015902.References
1. Slator PJ, Palombo M, Miller KL, Westin CF, Laun F, Kim D, Haldar JP, Benjamini D, Lemberskiy G, de Almeida Martins JP. Combined diffusion‐relaxometry microstructure imaging: Current status and future prospects. Magn Reson Med 2021.
2. Kim D, Doyle EK, Wisnowski JL, Kim JH, Haldar JP. Diffusion‐relaxation correlation spectroscopic imaging: a multidimensional approach for probing microstructure. Magn Reson Med 2017;78(6):2236-2249.
3. Benjamini D, Basser PJ. Use of marginal distributions constrained optimization (MADCO) for accelerated 2D MRI relaxometry and diffusometry. J Magn Reson 2016;271:40-45.
4. Veraart J, Novikov DS, Fieremans E. TE dependent Diffusion Imaging (TEdDI) distinguishes between compartmental T2 relaxation times. Neuroimage 2018;182:360-369.
5. Gong T, Tong Q, He H, Sun Y, Zhong J, Zhang H. MTE-NODDI: Multi-TE NODDI for disentangling non-T2-weighted signal fractions from compartment-specific T2 relaxation times. Neuroimage 2020:116906.
6. Ji Y, Gagoski B, Hoge WS, Rathi Y, Ning L. Accelerated diffusion and relaxation‐diffusion MRI using time‐division multiplexing EPI. Magn Reson Med 2021. doi: 10.1002/mrm.28894.
7. Ji Y, Paulsen J, Zhou IY, Lu D, Machado P, Qiu B, Song YQ, Sun PZ. In vivo microscopic diffusional kurtosis imaging with symmetrized double diffusion encoding EPI. Magn Reson Med 2019;81(1):533-541.
8. Griswold MA, Jakob PM, Heidemann RM, Nittka M, Jellus V, Wang J, Kiefer B, Haase A. Generalized autocalibrating partially parallel acquisitions (GRAPPA). Magn Reson Med 2002;47(6):1202-1210.
9. Feiweier T; Siemens Healthcare GmbH, assignee. Magnetic resonance method and apparatus to determine phase correction parameters. US Patent 8497681. July 30, 2013
10. Setsompop K, Cohen-Adad J, Gagoski BA, Raij T, Yendiki A, Keil B, Wedeen VJ, Wald LL. Improving diffusion MRI using simultaneous multi-slice echo planar imaging. Neuroimage 2012;63(1):569-580.
11. Malcolm JG, Shenton ME, Rathi Y. Filtered multitensor tractography. IEEE Trans Med Imaging 2010;29(9):1664-1675.
12. Ning L, Gagoski B, Szczepankiewicz F, Westin C-F, Rathi Y. Joint RElaxation-Diffusion Imaging Moments to Probe Neurite Microstructure. IEEE Trans Med Imaging 2019;39(3):668-677.
Figures