0243
MRSI spectral quantification using linear tangent space alignment (LTSA)-based manifold learning
Chao Ma1,2 and Georges El Fakhri1,2
1Radiology, Massachusetts General Hospital, Boston, MA, United States, 2Radiology, Harvard Medical School, Boston, MA, United States
1Radiology, Massachusetts General Hospital, Boston, MA, United States, 2Radiology, Harvard Medical School, Boston, MA, United States
Synopsis
Spectral quantification is a critical step in quantitative MRS/MRSI. The recently proposed subspace-based spectral quantification method represents the spectral distribution of each model as a subspace model and enables effective use of spatiospectral priors to improve parametric estimation. However, modeling spectral distribution of each metabolite as a separate subspace leads to a large number of unknowns, which renders the resultant parametric estimation problem challenging when SNR is low. To address this issue, we propose a new linear tangent space alignment-based method for MRSI quantification, leveraging the intrinsic low-dimensional structure information of the underlying MRSI signals for improved parametric estimation.
Introduction
Spectral quantification, which estimates the concentration and relaxation parameters of metabolites from noise corrupted measurement, is a critical step in quantitative MR Spectroscopy and Spectroscopic Imaging (MRS/MRSI). This problem has been extensively investigated in the literature, leading to several widely used spectral quantification methods such as LCModel1, AMARES2, jMRUI3, and QUEST4. One common feature of these methods is the use of spectral prior information for quantification. Recent advances in MRSI data acquisition and image reconstruction have significantly improve the spatial resolution and imaging speed of the conventional MRSI, making high-resolution 3D MRSI practical in clinical settings5-10. This in turn opens new opportunities of imposing both spatial and spectral prior knowledge of MRSI data for improved spectral quantification11-14. Among them, the subspace-based spectral quantification method14 represents the spectral distribution of each metabolite as a subspace model, translates the nonlinear spectral quantification problem into a subspace estimation problem, and enables efficient and effective use of spatio-spectral priors to improve spectral quantification. However, modeling spectral distribution of each metabolite as separate subspace leads to a large number of unknowns, which renders the resultant parametric estimation problem particularly challenging when SNR is low. To address this issue, we propose a new method for MRSI spectral quantification using linear tangent space alignment (LTSA)-based manifold learning15. The LTSA model can be considered as a non-linear generalization of the subspace model, leveraging the intrinsic low-dimensional structure information of the underlying MRSI data for improved spectral quantification.Theory
Spectral quantification problem: Let $$$\rho_{q}(r,f)$$$ denote the spectrum of the $$$q$$$-th metabolite at spatial location $$$r$$$. One critical step of spectral quantification is to separate the spectrum of each metabolite from the measured spectrum in the presence of noise: $$s(r,f) = \sum_{q=1}^{Q} \rho_{q}(r,f) + \epsilon(r,f). $$ Once separated, the concentration and relaxation parameters of metabolites can be estimated from $$$\rho_{q}(r,f)$$$ in a relative straightforward way. We propose to solve this problem through manifold learning via the LTSA model. The schematic diagram of the proposed method is shown in Fig. 1.Local subspace approximation: We assume the spectra of all the metabolites $$$\rho_{q}(r,f), q=1,2,..,Q$$$ reside in a low-dimensional smooth manifold $$$M$$$ with a dimension $$$D$$$. We further group the spectra of $$$q$$$-th metabolite into a neighborhood, which spans a subspace by the Jacobian of $$$M$$$ known as the tangent space. While it is difficult to explicitly calculate the Jacobian of $$$M$$$, the tangent space can be easily approximated using the spectral prior information of the $$$q$$$-th metabolite. To this end, $$$\rho_{q}(r,f)$$$ at each spatial location can form a so-called Casorati matrix, which has a low-rank representation as shown in Fig. 1b, where $$$\phi_{q,c}(f)$$$ is the spectral basis of the approximated tangent space and $$$\theta_{qc}(r)$$$ is the corresponding local coordinates of the manifold $$$M$$$. The low-rank model in Fig. 1b is the same model as in the subspace-based method14. The spectral basis $$$\phi_{q,c}(f)$$$ can be estimated in a similar way, e.g., using quantum mechanics simulated spectra.
Tangent space approximation: The key innovation of the proposed method is leveraging the fact that the local coordinates $$$\Theta_{q} =[\theta_{q,1}(r),.., \theta_{q,C}(r)]$$$ of each neighborhood can be aligned with the global coordinates of the manifold by a linear transform when the underlying manifold is smooth, regular and without intersection: $$\Theta_{q}=T L_{q}. $$ Here, $$$\Theta_{q}$$$ is a $$$N \times C$$$ matrix ($$$N$$$ is the number of spatial locations and $$$C$$$ is the rank of the neighborhood $$$q$$$), $$$T$$$ is a $$$N \times D$$$ matrix representing the global coordinates of the manifold with a dimension $$$D$$$, and $$$L_{q}$$$ is a small $$$D \times C$$$ matrix. Intuitively, the above LTSA model leads to a low-rank representation of the Casorati matrix formed by the local coordinates as illustrated in Fig. 1c. Compared to the subspace model in14 where $$$\Theta_{q}, q=1,..,Q$$$ are estimated, the LTSA model only needs to estimate $$$T$$$ and a set of small matrices $$$L_{q},q=1,..,Q$$$, and thus significantly reduces the number of unknowns in spectral quantification.
LTSA-based spectral quantification: The spectral quantification problem can be solved by fitting the LTSA model to the measured MRSI data: $$ arg min_{T,L_{q}} \parallel s - \sum_{q=1}^{Q} T L_{q} \Phi_{q} \parallel_2^{2} + R(T L_{q}),$$ where the first term is a data fidelity term and the second term is used to incorporated spatial prior information of metabolite distributions, e.g., anatomical prior knowledge as in14. The above problem can be efficiently solved using an alternating optimization algorithm.
Results
We validated the performance of the proposed method using both simulation and in vivo experimental data and compared with QUEST and the subspace-based method14. The results of the simulation study are shown in Figs. 2 and 3, clearly demonstrating the superior performance of the proposed method. Figures 4 and 5 show spectral quantification results from a 2D MRSI data set acquired on a healthy subject at 3T (approved by our local IRB) using a phase-encoding based FID-MRSI sequence (64X64 spatial encodings, TR/TE =380/4.5 ms). Compared to the subspace-based method, the proposed method further reduced the noise and showed better structural information of the metabolite distribution (i.e., Cr, Cho, and mIn).Conclusion
Manifold learning via linear tangent space alignment can lead to improved spectral quantification for MRSI.Acknowledgements
This work was supported in part by the National Institutes of Health under awards: R01CA165221 and P41EB022544.References
[1] S. Provencher,“Estimation of metabolite concentrations from localized in vivo proton NMR spectra,” Magn. Reson. Med., vol. 30, no. 6, pp. 672– 679, 1993.[2] Vanhamme, L, van den Boogaart, A, Van Huffel, S. “Improved method for accurate and efficient quantification of MRS data with use of prior knowledge,” J. Magn. Reson. 1997; 129: 35–43.
[3] A. Naressi, C. Couturier, J. M. Devos, M. Janssen, C. Mangeat, R. de Beer, and D. Graveron-Demilly, “JAVA-based graphical user interface for the MRUI quantitation package,” Magnetic Resonance Materials in Physics, Biology and Medicine, vol. 12, no. 2-3, pp. 141– 152, 2001.
[4] H. Ratiney, M. Sdika, Y. Coenradie, S. Cavassila, D. van Ormondt, and D. Graveron-Demilly, “Time-domain semi-parametric estimation based on a metabolite basis set,” NMR in Biomedicine, vol. 18, pp. 1–13, 2005.
[5] W. Bogner, R. Otazo, A. Henning, “Accelerated MR spectroscopic imaging—a review of current and emerging techniques,” NMR Biomed, Vol. 34, 2021.
[7] F. Lam and Z. P. Liang, “A subspace approach to high-resolution spectroscopic imaging,” Magn. Reson. Med., vol. 71, no. 4, pp. 1349–1357, 2014.
[8] F. Lam, C. Ma, B. Clifford, C. L. Johnson, and Z.-P. Liang, “High-resolution 1 H-MRSI of the brain using SPICE: Data acquisition and image reconstruction,” Magn. Reson. Med., vol. 76, no. 4, pp. 1059–1070, 2016.
[9] Li Y, Wang T, Zhang T, et al. Fast high-resolution metabolic imaging of acute stroke with 3D magnetic resonance spectroscopy. Brain. 2020;143(11):3225-3233. doi:10.1093/brain/awaa264
[10] Guo R, Ma C, Li Y, et al. High-Resolution Label-Free Molecular Imaging of Brain Tumor. In: IEEE Engineering in Medicine and Biology Society; 2021.
[11] C.Sava et al.,“Exploiting spatial information to estimate metabolite levels in two-dimensional MRSI of heterogeneous brain lesions,” NMR Biomed., vol. 24, no. 7, pp. 824–835, 2011.
[12] B. M. Kelm et al.,“Using spatial prior knowledge in the spectral fitting of MRS images,” NMR Biomed., vol. 25, no. 1, pp. 1–13, 2012.
[13] Q. Ning et al., “Spectral quantification for high-resolution MR spectroscopic imaging with spatiospectral constraints,” IEEE Trans. Biomed. Eng., vol. 64, no. 5, pp. 1178–1186, May 2017.
[14] Y. Li, F. Lam, B. Clifford, Z.-P. Liang, “A subspace approach to spectral quantification for MR spectroscopic imaging,” IEEE Trans. Biomed. Eng., vol. 64, no. 10, 2017.
[15] Z. Zhang, H. Zha, “Principal manifolds and nonlinear dimensionality reduction via tangent space alignment,” SIAM Journal on Scientific Computing 26, 313–338 (2005).
Figures
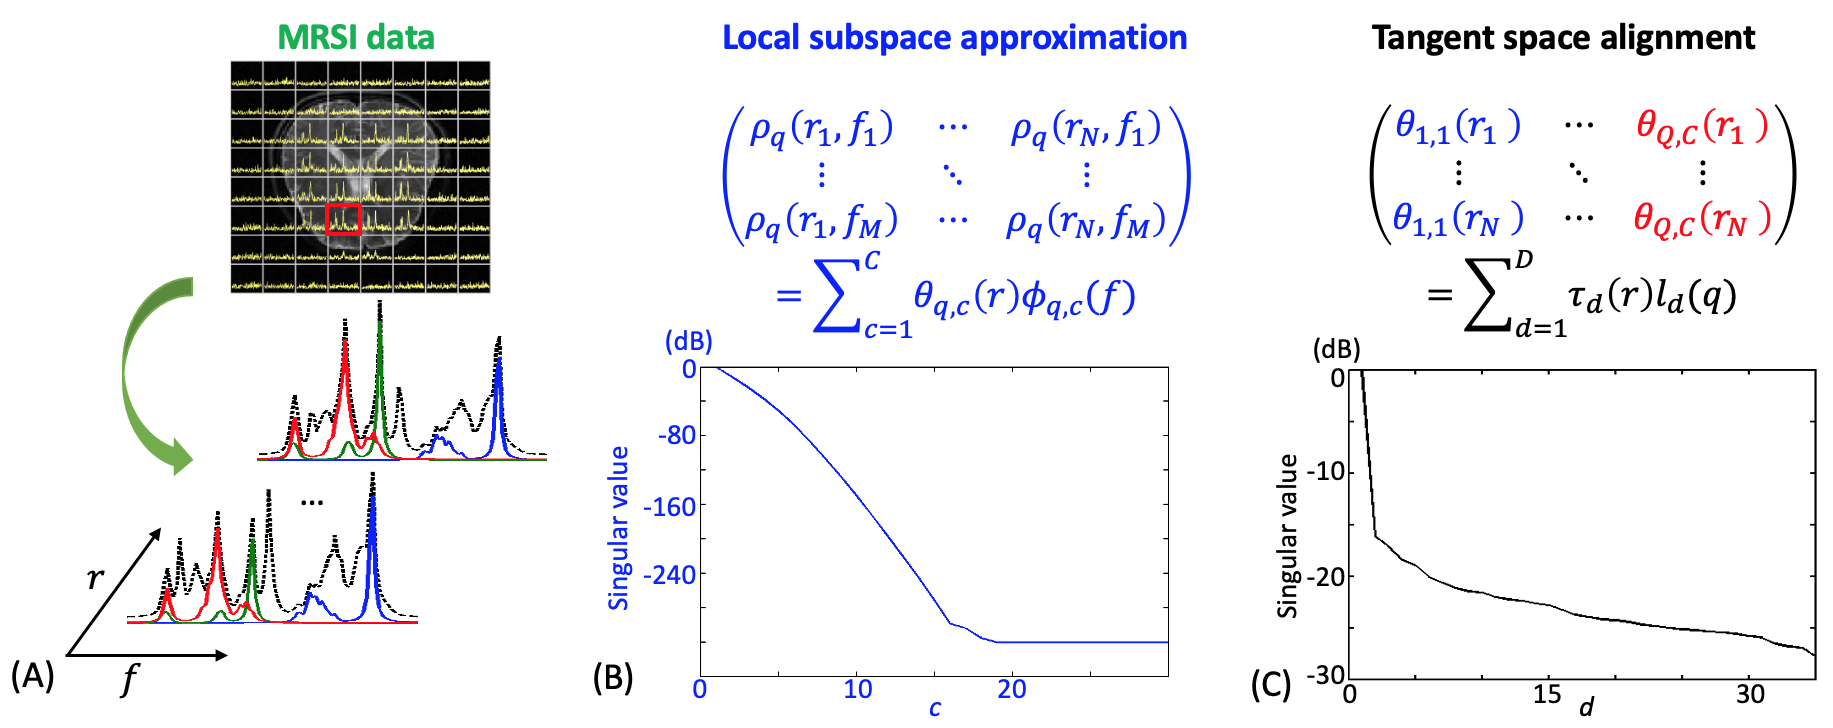
Figure 1: Schematic diagram of the proposed MRSI spectral quantification method. We assume the spectra of metabolites from an MRSI experiment live in a low-dimensional smooth manifold. The intrinsic low-dimensional structure of the manifold can be learned conceptually as follows: 1) determination of the local coordinates of the manifold via local subspace approximation and 2) determination of the global coordinates of the manifold via tangent space alignment.
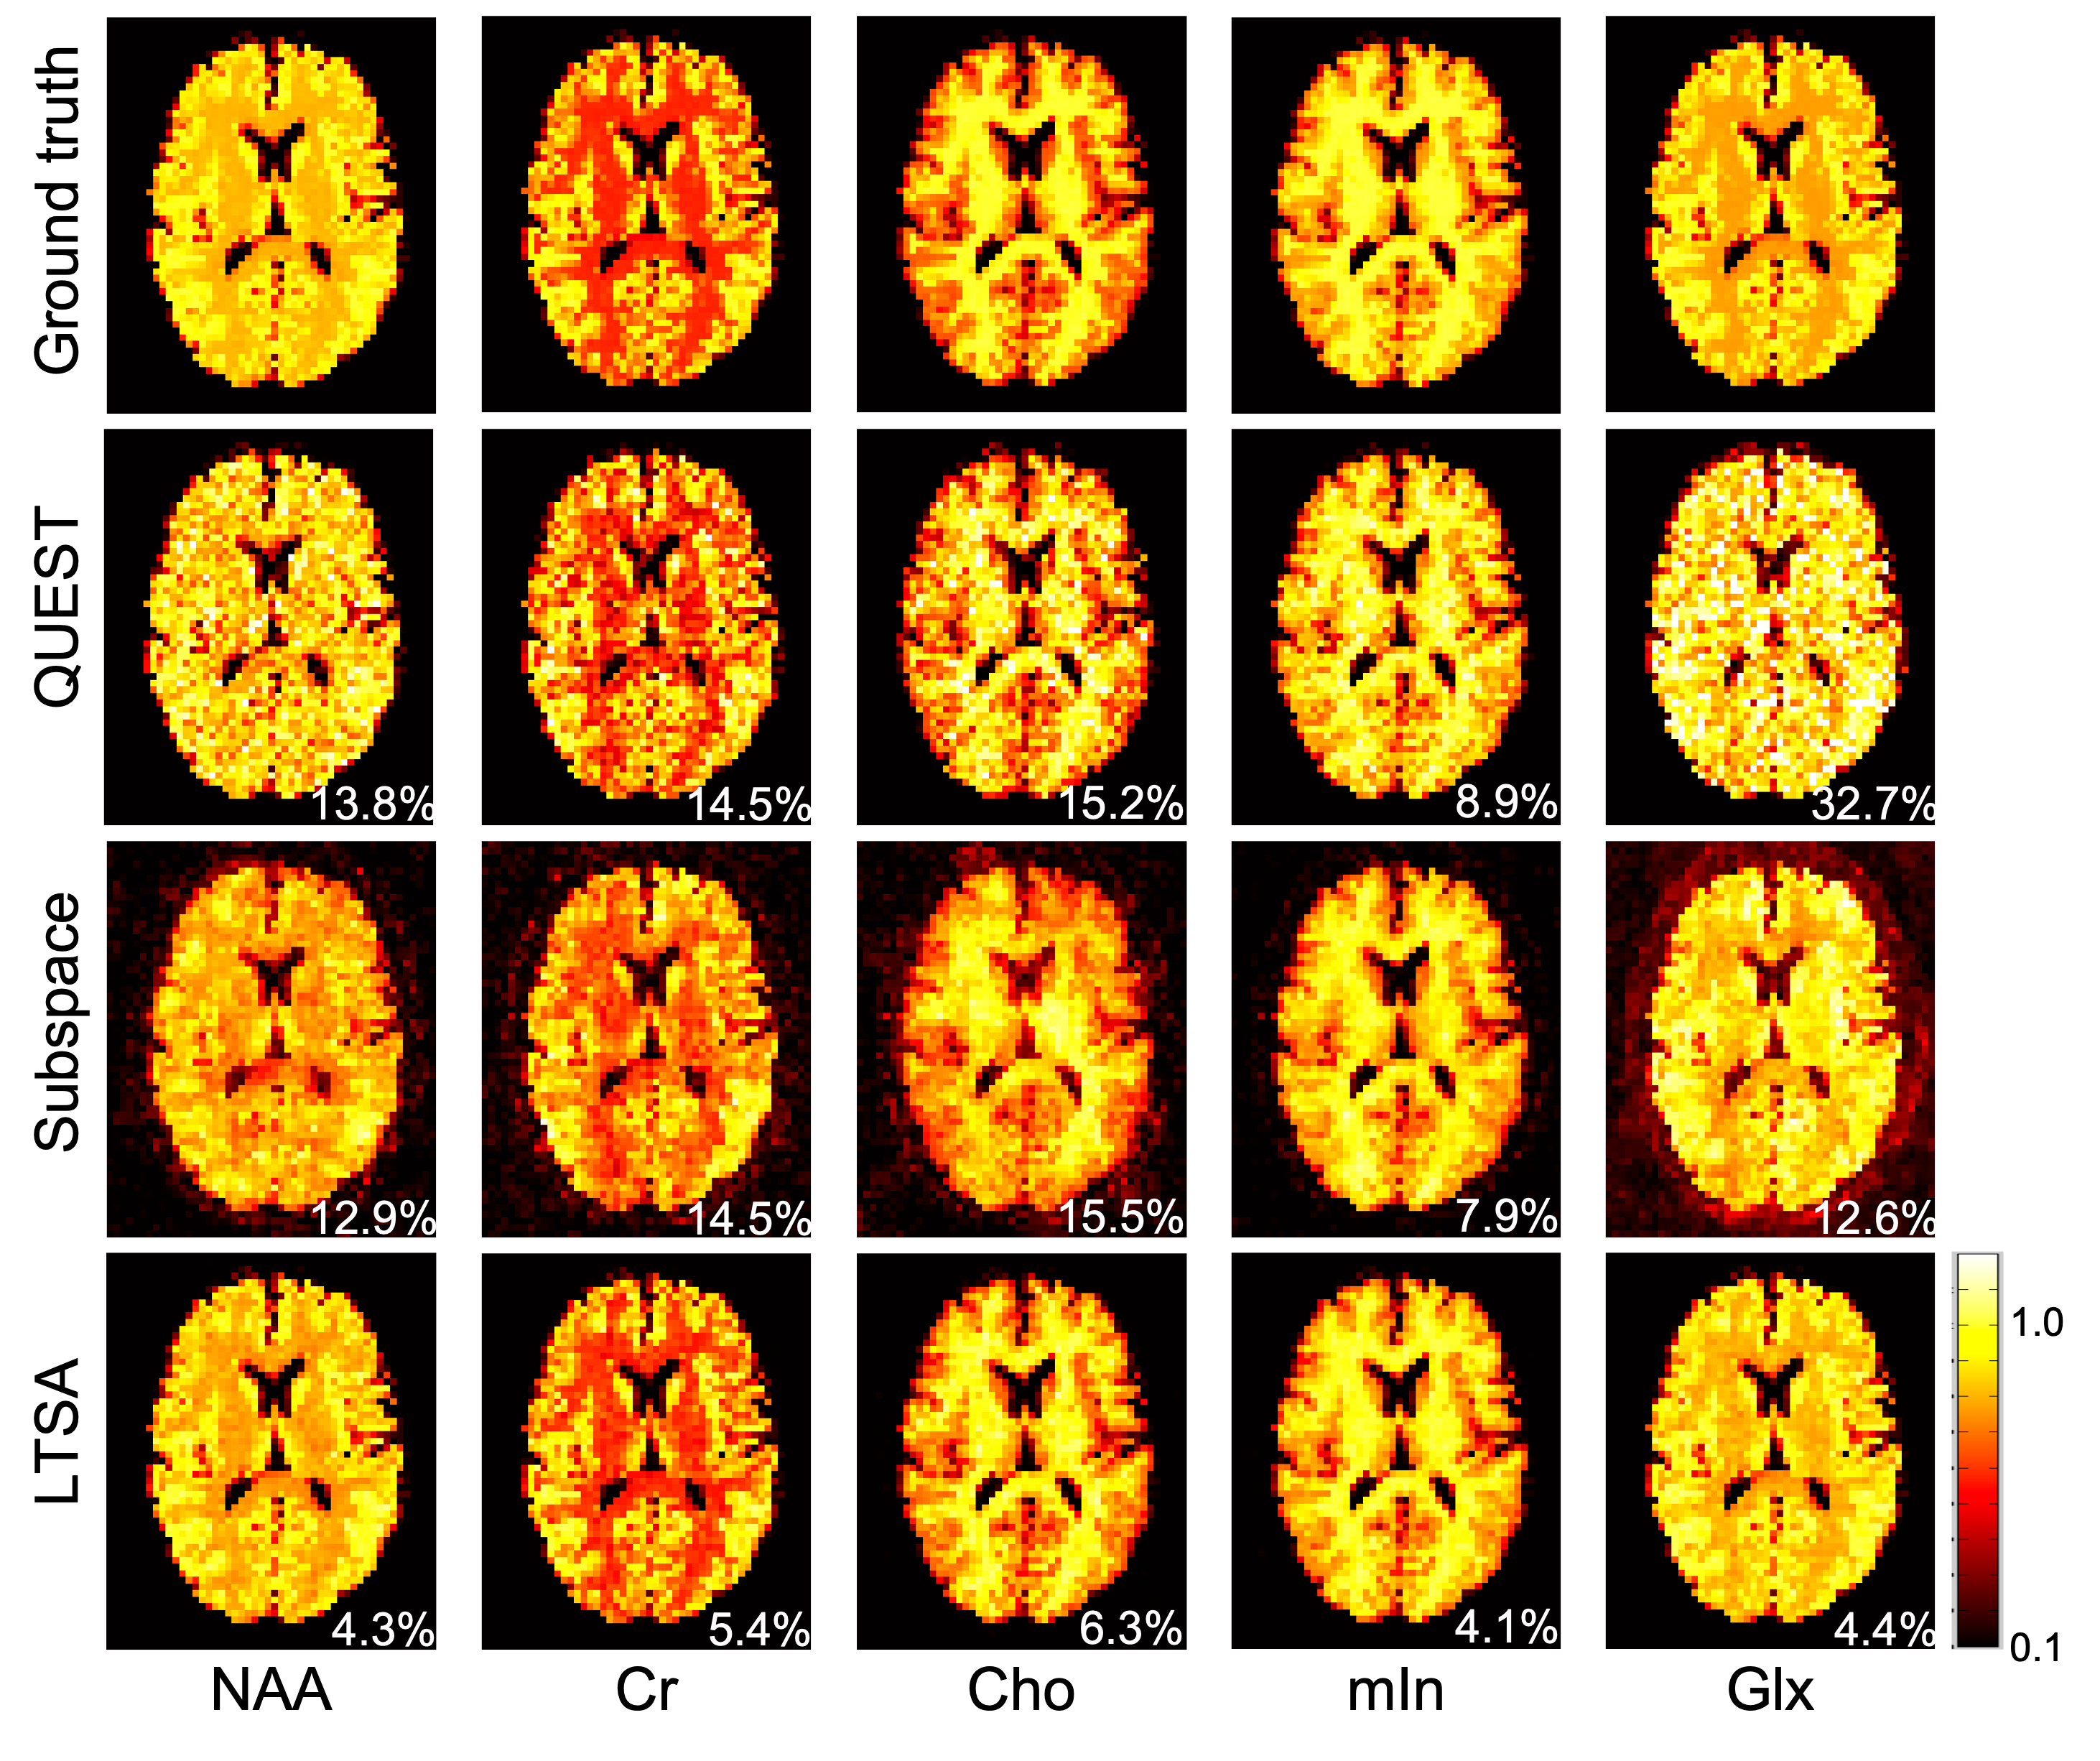
Figure 2: Simulation study. Comparison of the performance of the proposed method with the state-of-the-art methods, i.e., QUEST and the subspace-based method. The RMSE errors of spectral quantification are also listed for the compared methods.
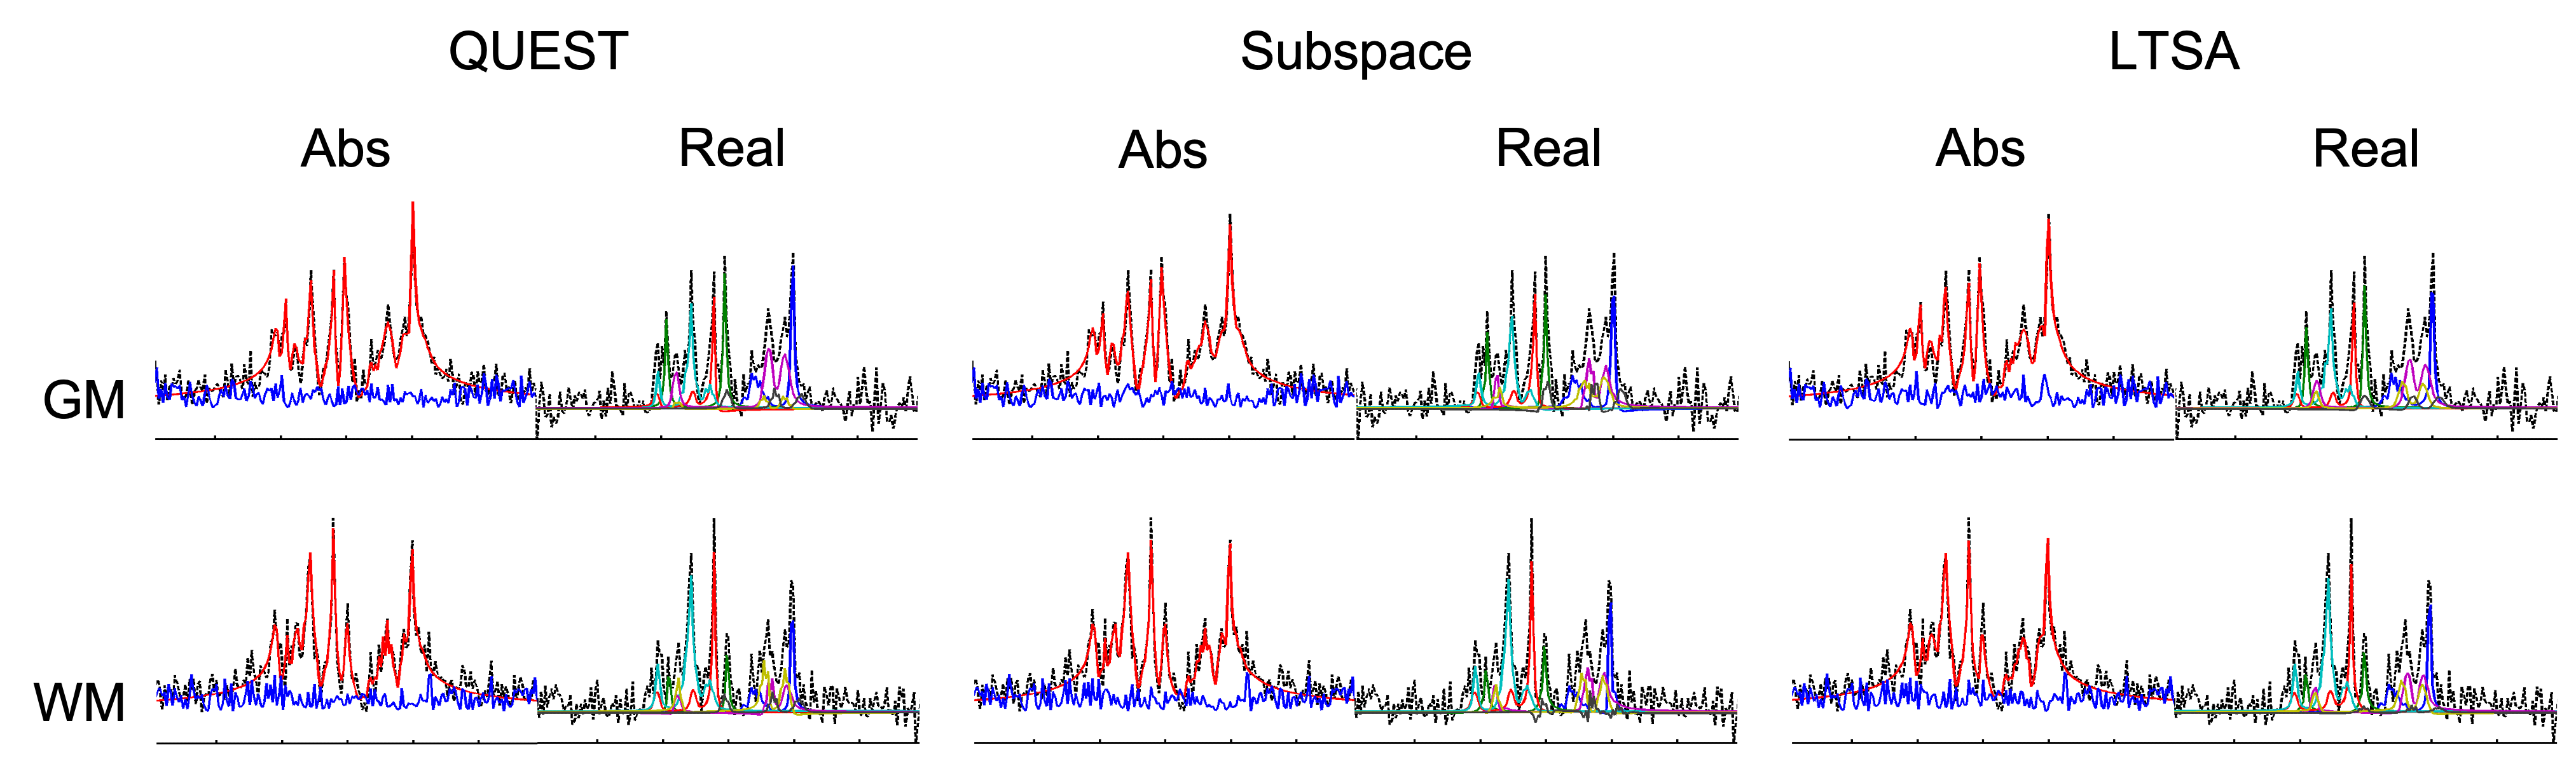
Figure 3: Simulation study. Representative spectral fitting results. The color coding is as follows. In the magnitude plot, black-dashed line: original noisy spectrum; red-solid line: fitted spectrum; blue-solid line: residuals. In the plot of the real-part, black-dashed line: original noisy spectrum; blue-, red-, green-, cyan-, magenta- and yellow-solid line: spectrum of the fitted NAA, Cho, Cr, mIn, Glu and Gln, respectively.
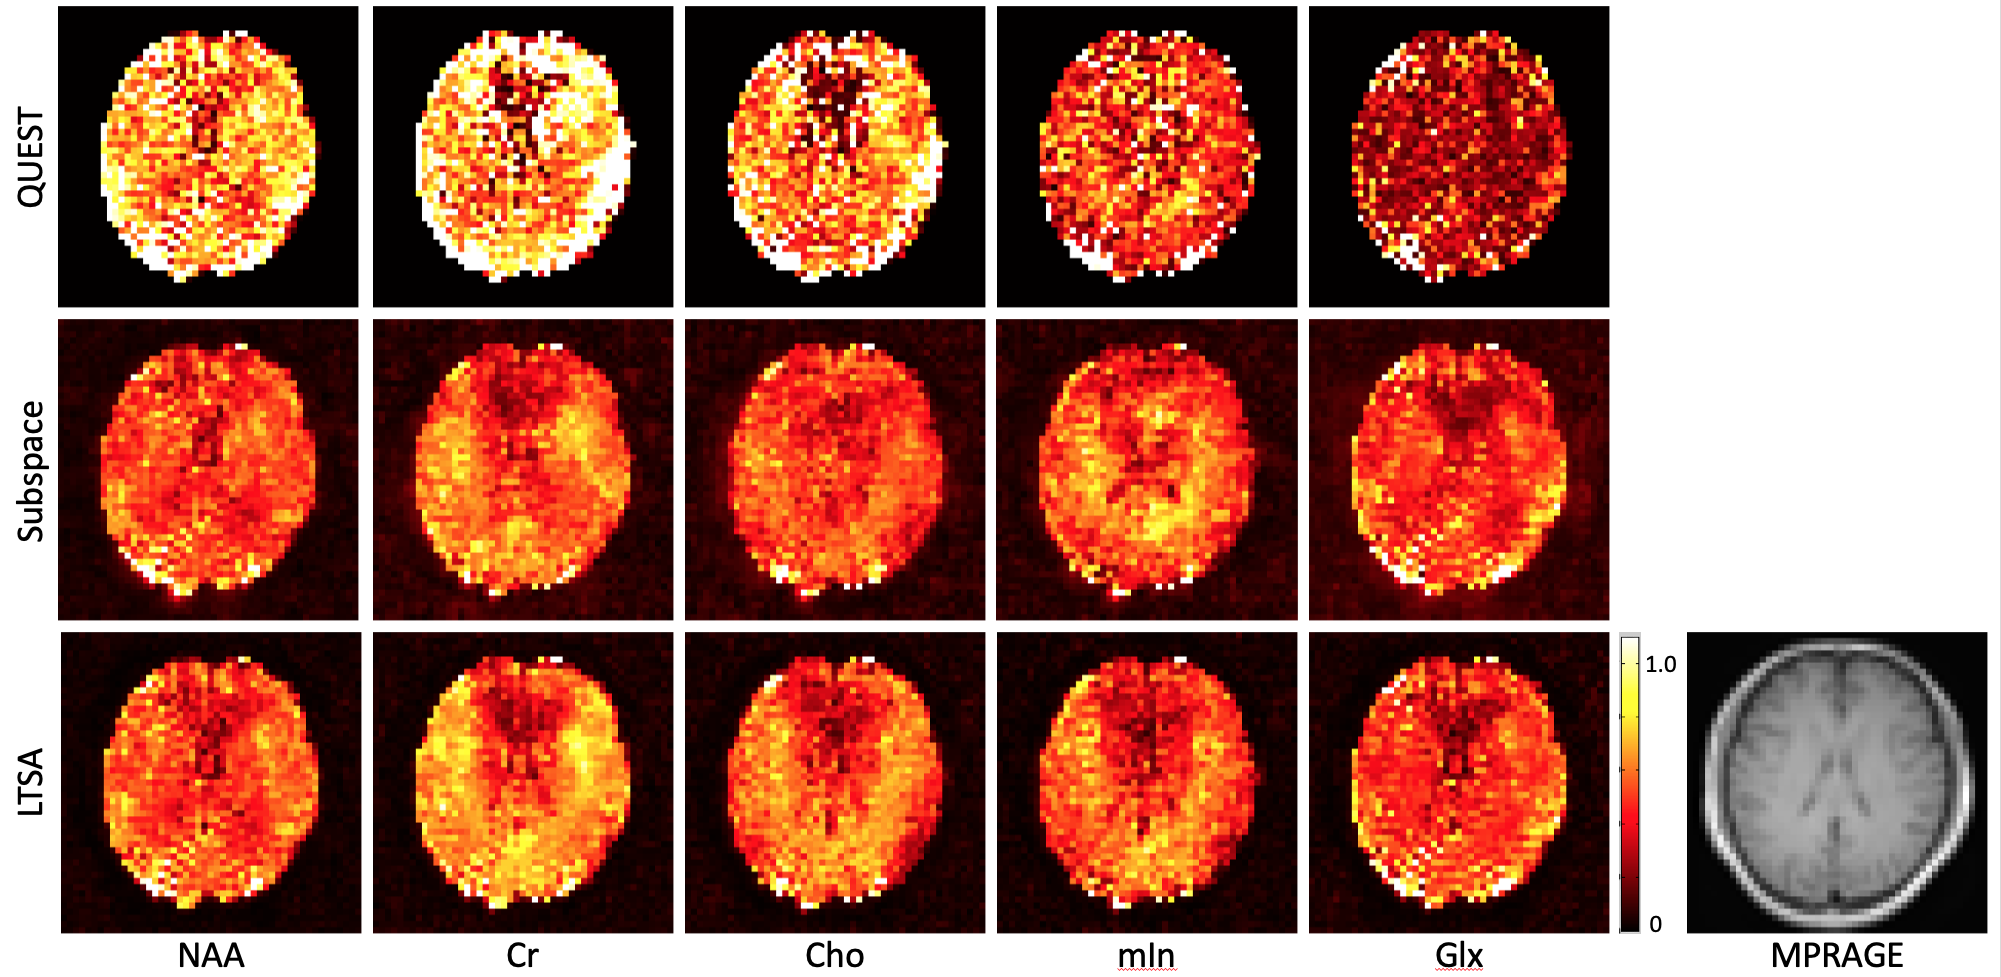
Figure 4: In vivo study. Comparison of the performance of the proposed method with QUEST and the subspace-based method. Compared to QUEST, both the subspace-based and proposed method significantly reduced the noise of the metabolite maps. Compared to the subspace-based method, the proposed method further reduced the noise and showed better structural information of the metabolite distribution (i.e., Cr, Cho, and mIn).
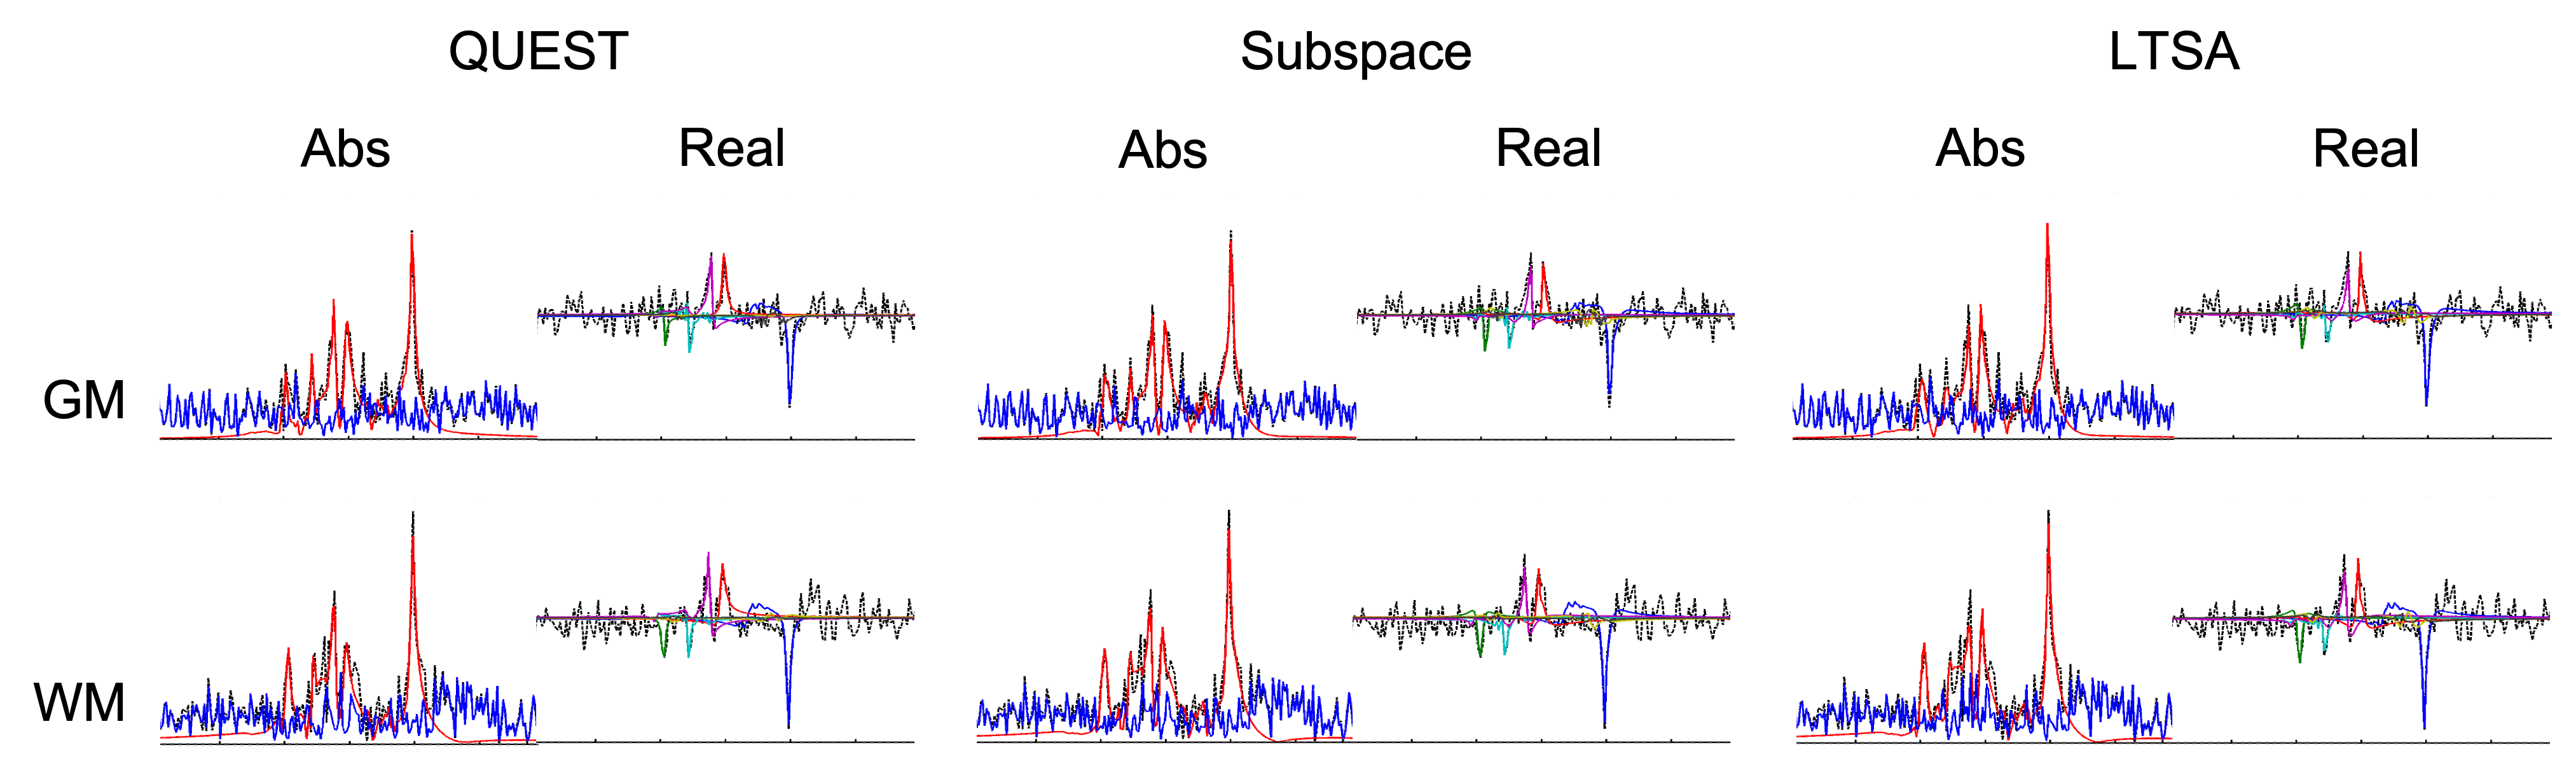
Figure 5: In vivo study. Representative spectral fitting results. The color coding is as follows. In the magnitude plot, black-dashed line: original noisy spectrum; red-solid line: fitted spectrum; blue-solid line: residuals. In the plot of the real-part, black-dashed line: original noisy spectrum; blue-, red-, green-, cyan-, and magenta-line: spectrum of the fitted NAA, Cr-CH3, Cr-CH2, mIn, and Cho, respectively.
DOI: https://doi.org/10.58530/2022/0243