0239
Ultrashort Echo Time Double Echo Steady State (UTE-DESS) Imaging with Eddy Current Compensation1Radiology, University of California, San Diego, San Diego, CA, United States, 2Radiology Service, Veterans Affairs San Diego Healthcare System, San Diego, CA, United States
Synopsis
The double echo steady state (DESS) sequence has been investigated extensively due to its short scan time and flexible image contrast achieved from a combination of a free induction decay (FID)-like S+ signal and simulated echo-based S- signal. Ultrashort echo time-based DESS (UTE-DESS) has recently been proposed for imaging of short T2 tissues in the human knee joint, but the effect of eddy currents in this technique has not yet been investigated. In this study, we demonstrate the effects of B0 and linear eddy current and elucidate the importance of eddy current compensation (ECC) for reliable UTE-DESS imaging.
Introduction
Eddy current (EC) is a major technical magnetic resonance imaging (MRI) challenge that must be addressed in pursuit of artifact-free imaging. EC introduces an additional magnetic field which is typically modeled as a polynomial of the spatial coordinates 1. The B0 EC, 0th-order term, generates a constant, albeit time-varying, magnetic field which causes additive phase error in the acquired k-space data due to a fluctuating B0 field. The linear EC, 1st-order term, generates a linear magnetic field in space that mimics a gradient field which in turn distorts a gradient waveform to result in a distorted k-space trajectory.Recently, ultrashort echo time double echo steady-state (UTE-DESS) has been proposed for imaging of short T2 tissues 2,3. However, the effect of EC in UTE-DESS imaging has not yet been investigated. In this study, we demonstrate the effects of EC and further elucidate the importance of eddy current compensation (ECC) for reliable UTE-DESS imaging.
Methods
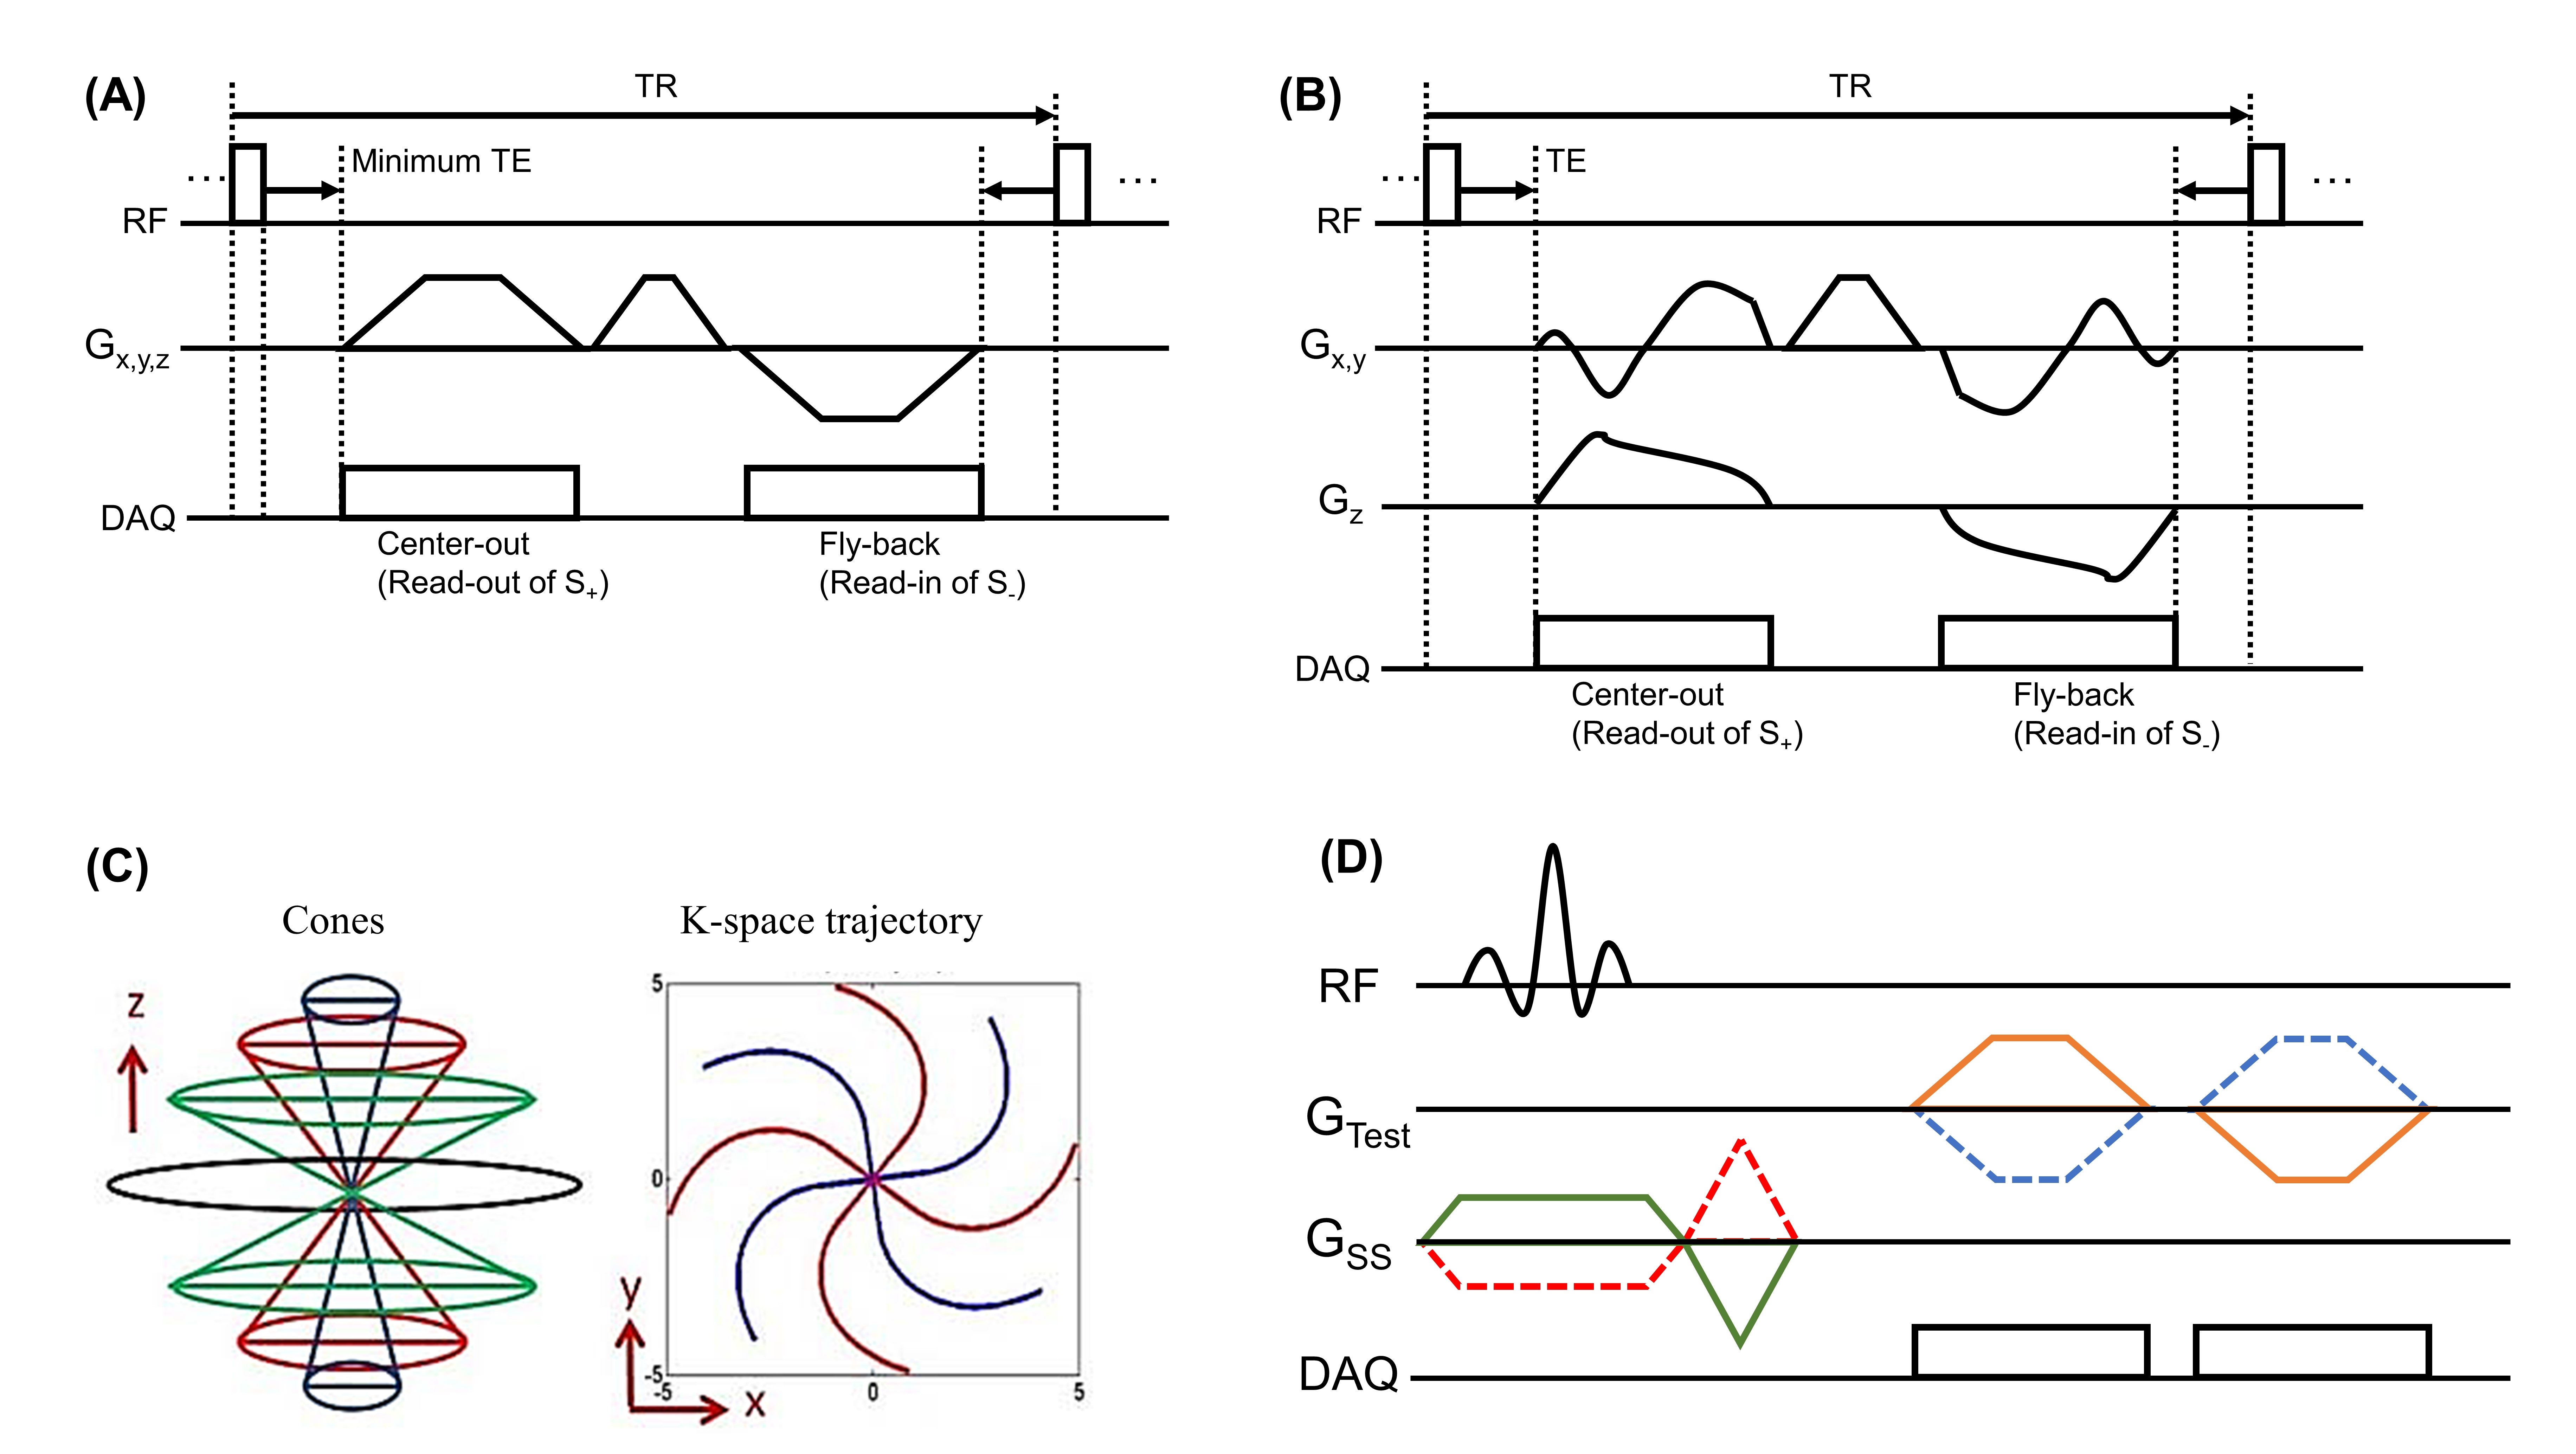
Figures 1A and 1B illustrate pulse sequences for UTE-DESS imaging which can be operated in two different modes: 3D projection radial (PR) mode (Figure 1A) and 3D spiral-cones mode (Figure 1B). By strengthening the spiral arms in spiral-cones mode (Figure 1C), PR mode can be achieved. Figure 1D shows the pulse sequence used to simultaneously measure B0 and linear EC based on the phase evolution within a thin slice excited at an off-isocentered location 4–6. For UTE-DESS, ECC was performed with two bipolar read-out/read-in gradients. ECC for the spoiling gradient was not considered since the effects of ECs are canceled along the pathway to forming the S- signal (i.e., time-reversed).First, we performed computer simulation to demonstrate effect of EC in UTE-DESS imaging. Then, both UTE-DESS and EC measurement sequences were implemented on a 3T GE MR750 scanner to evaluate ECC in phantom, ex vivo human synovium tissue and human ankle specimens, and in vivo knees of five healthy volunteers. A time-efficient ECC approach based on the linear time invariant (LTI) assumption was utilized 7, where only 16 basis gradients were measured using a body coil with the imaging parameters: slice location=20 mm, slice thickness=0.3 mm, flip angle=20 ̊, TR=50 ms, number of excitations (NEX)=10, and scan time=4min 48sec.
Results
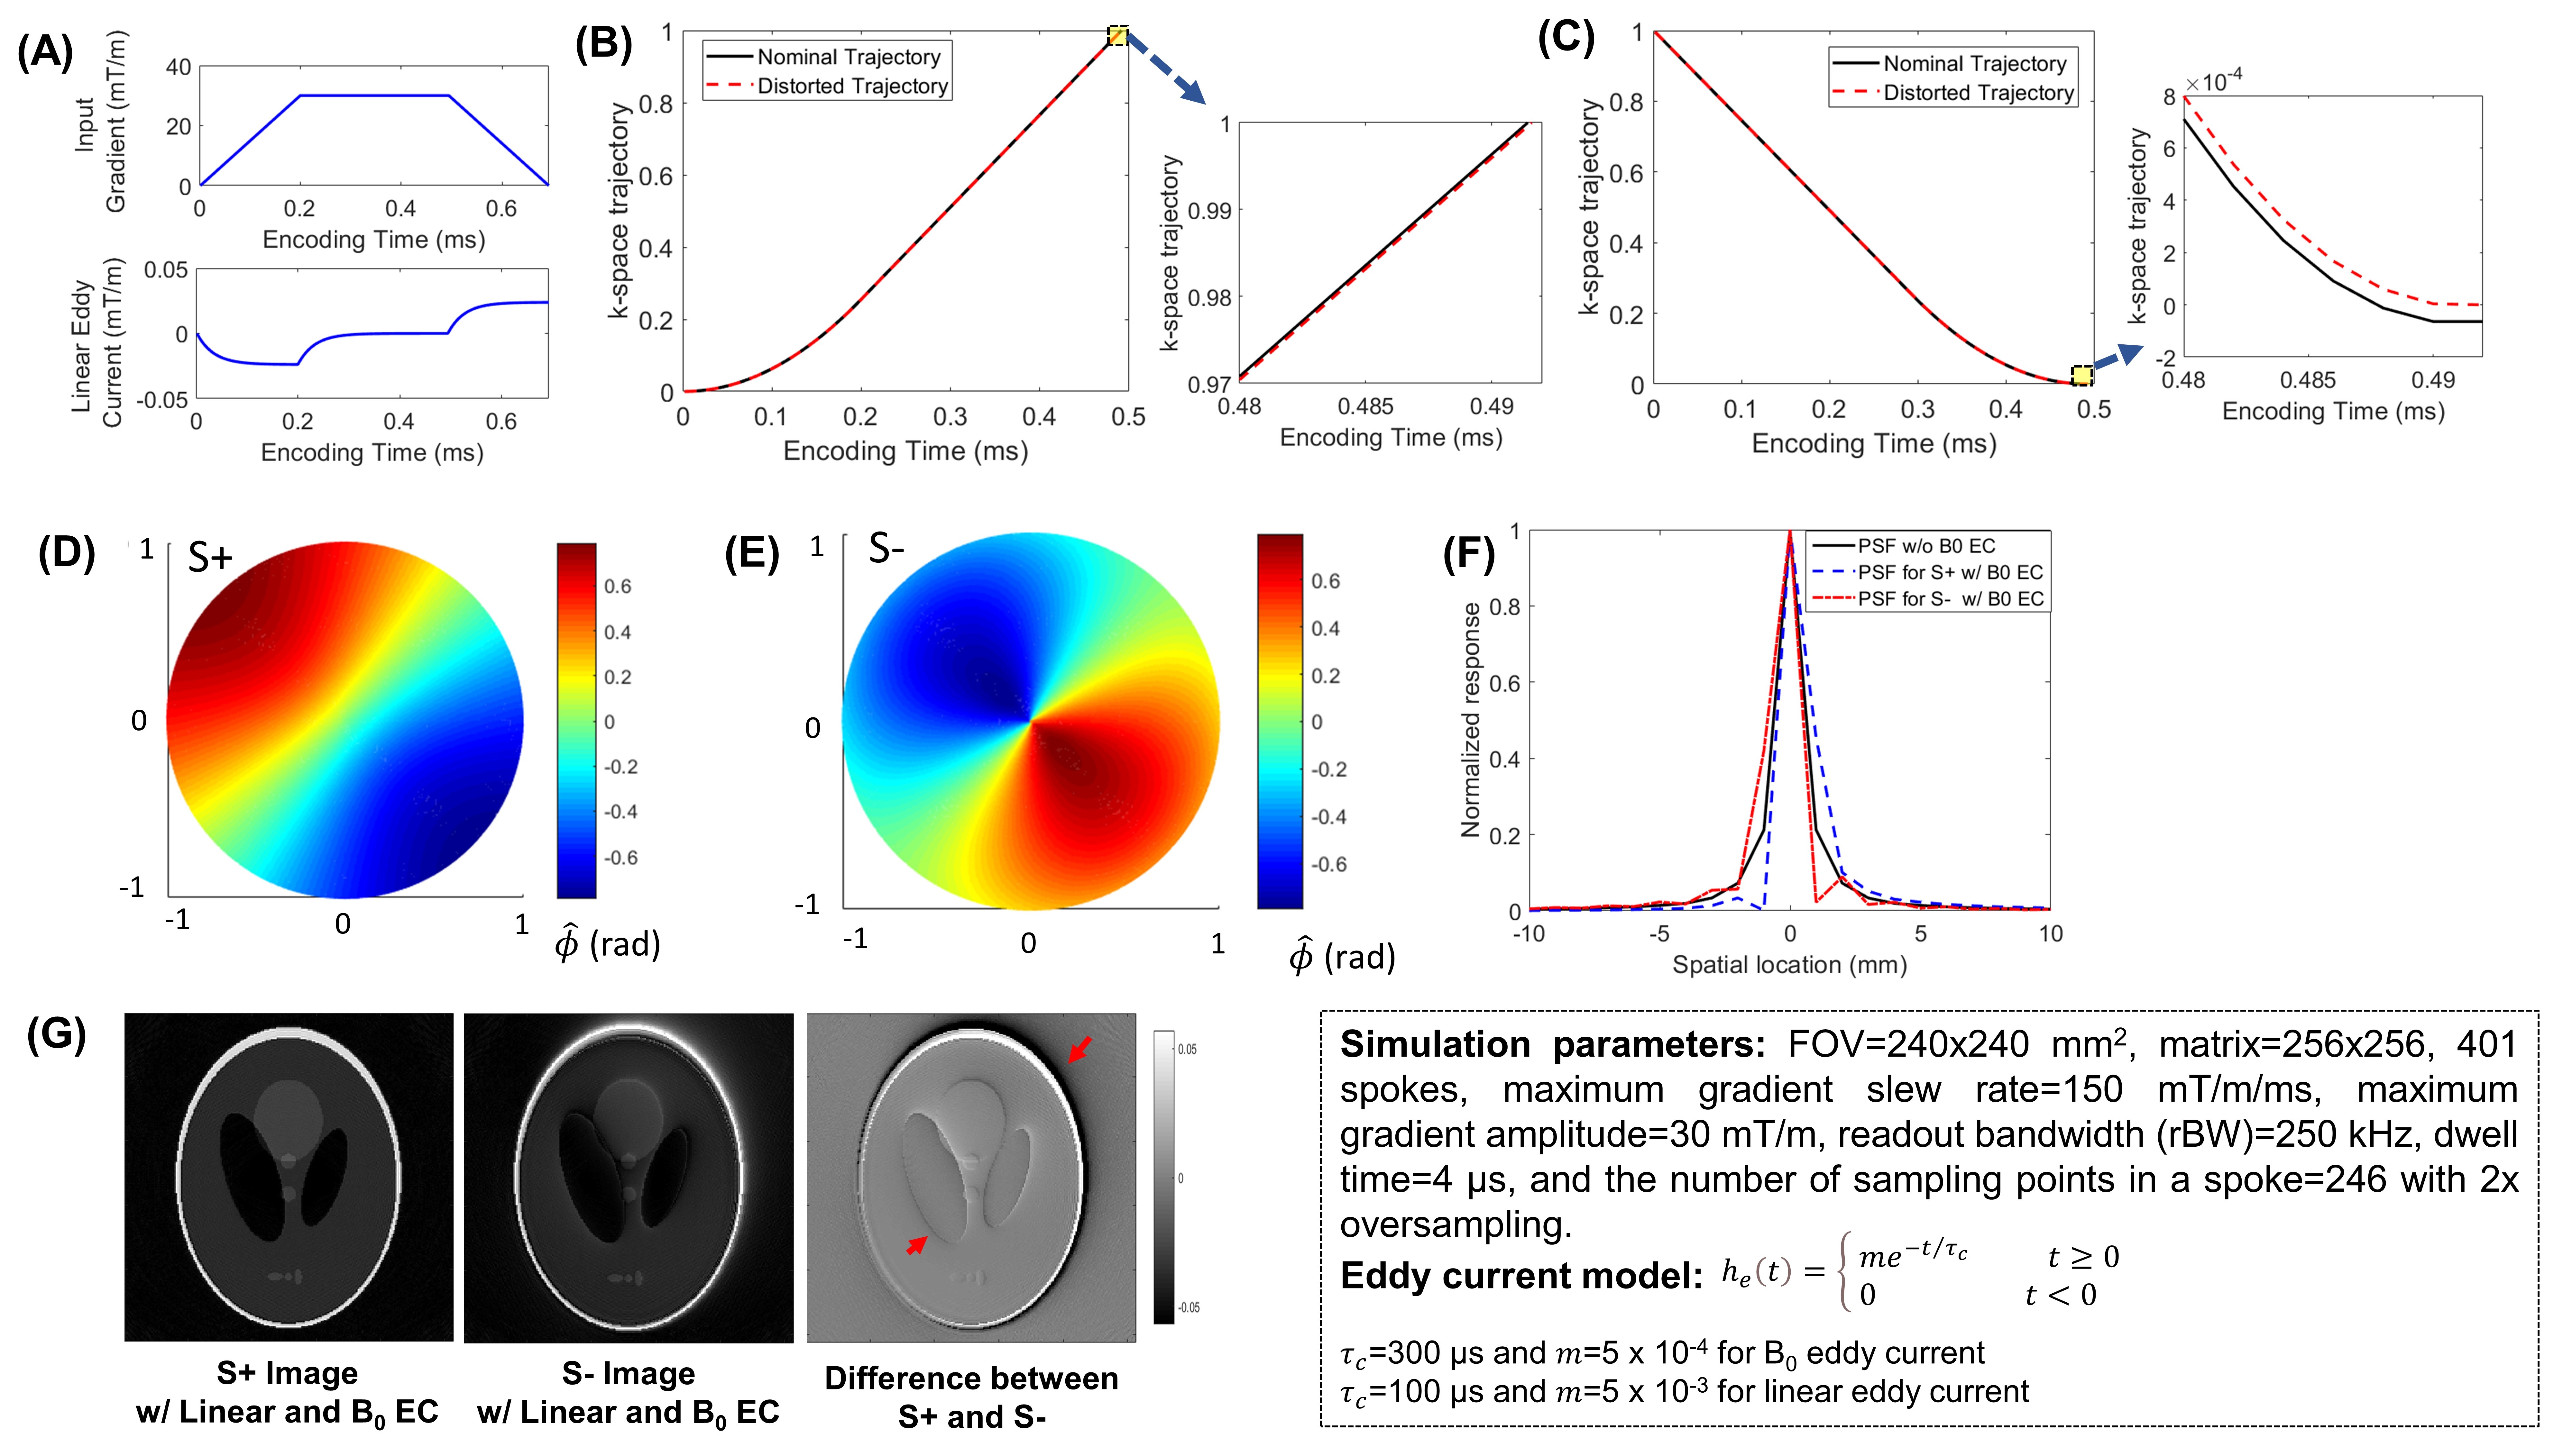
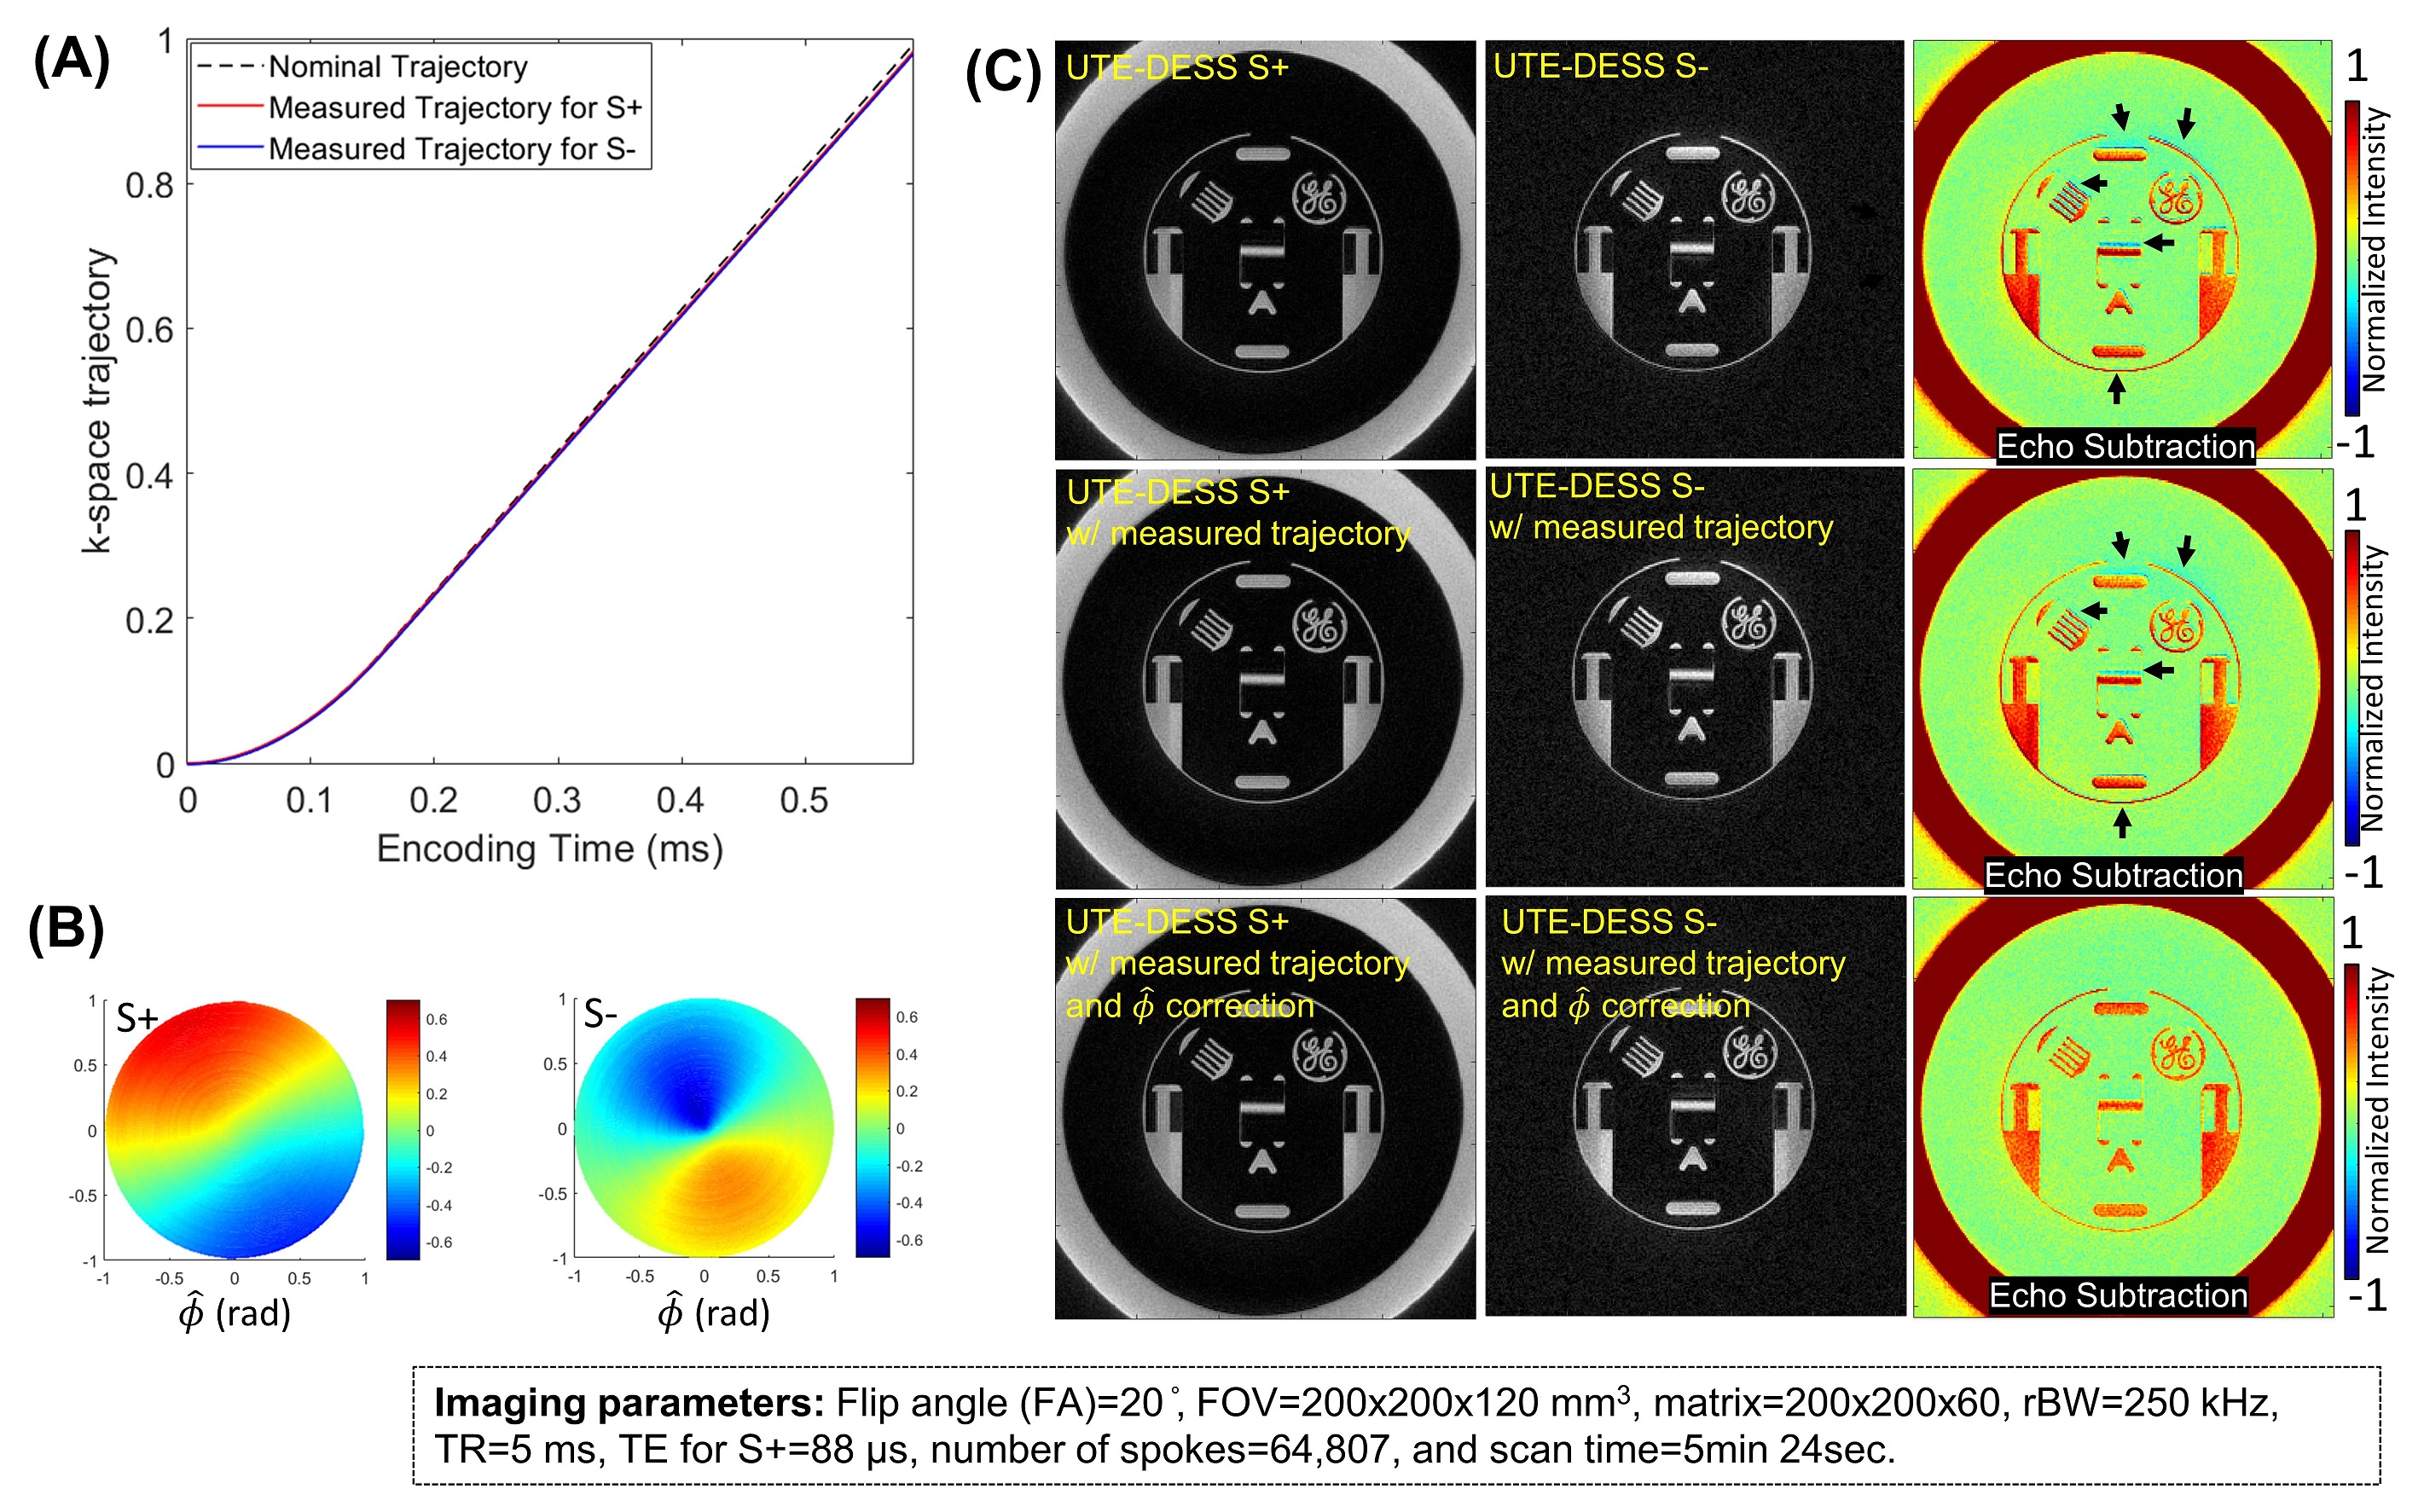
Figures 2A-C show simulated linear EC and the resultant k-space trajectories for S+ and S- echoes. Figures 2D-F show simulated phase error induced by B0 EC, $$$\widehat{\phi}$$$, and the resultant point spread functions (PSFs). Note that for the S+ acquisition, a nearly linear phase modulation was exhibited in the diagonal direction (2D), while a more complicated non-linear phase error was exhibited in the S- acquisition (2E). This is because B0 eddy current accumulates in a longer signal pathway for S- echo. The resultant PSFs shifted in opposite directions (2F), a consequence of the different phase modulations by B0 EC (can be explained by Fourier shift theorem). Figure 2G shows a strong boundary effect in the difference image between S+ and S-, which implies misalignment of pixels.Figure 3 shows results from the phantom experiment based on UTE-DESS imaging in PR mode. Figure 3A shows the measured trajectory. No significant deviation was shown in either the S+ or S- trajectory. The measured $$$\widehat{\phi}$$$ showed nearly linear and non-linear phase errors across the k-space for S+ and S-, respectively. The difference image without ECC in Figure 3C shows a strong boundary effect due to a misalignment of pixels mainly caused by the B0 EC, an effect which was significantly reduced with ECC.
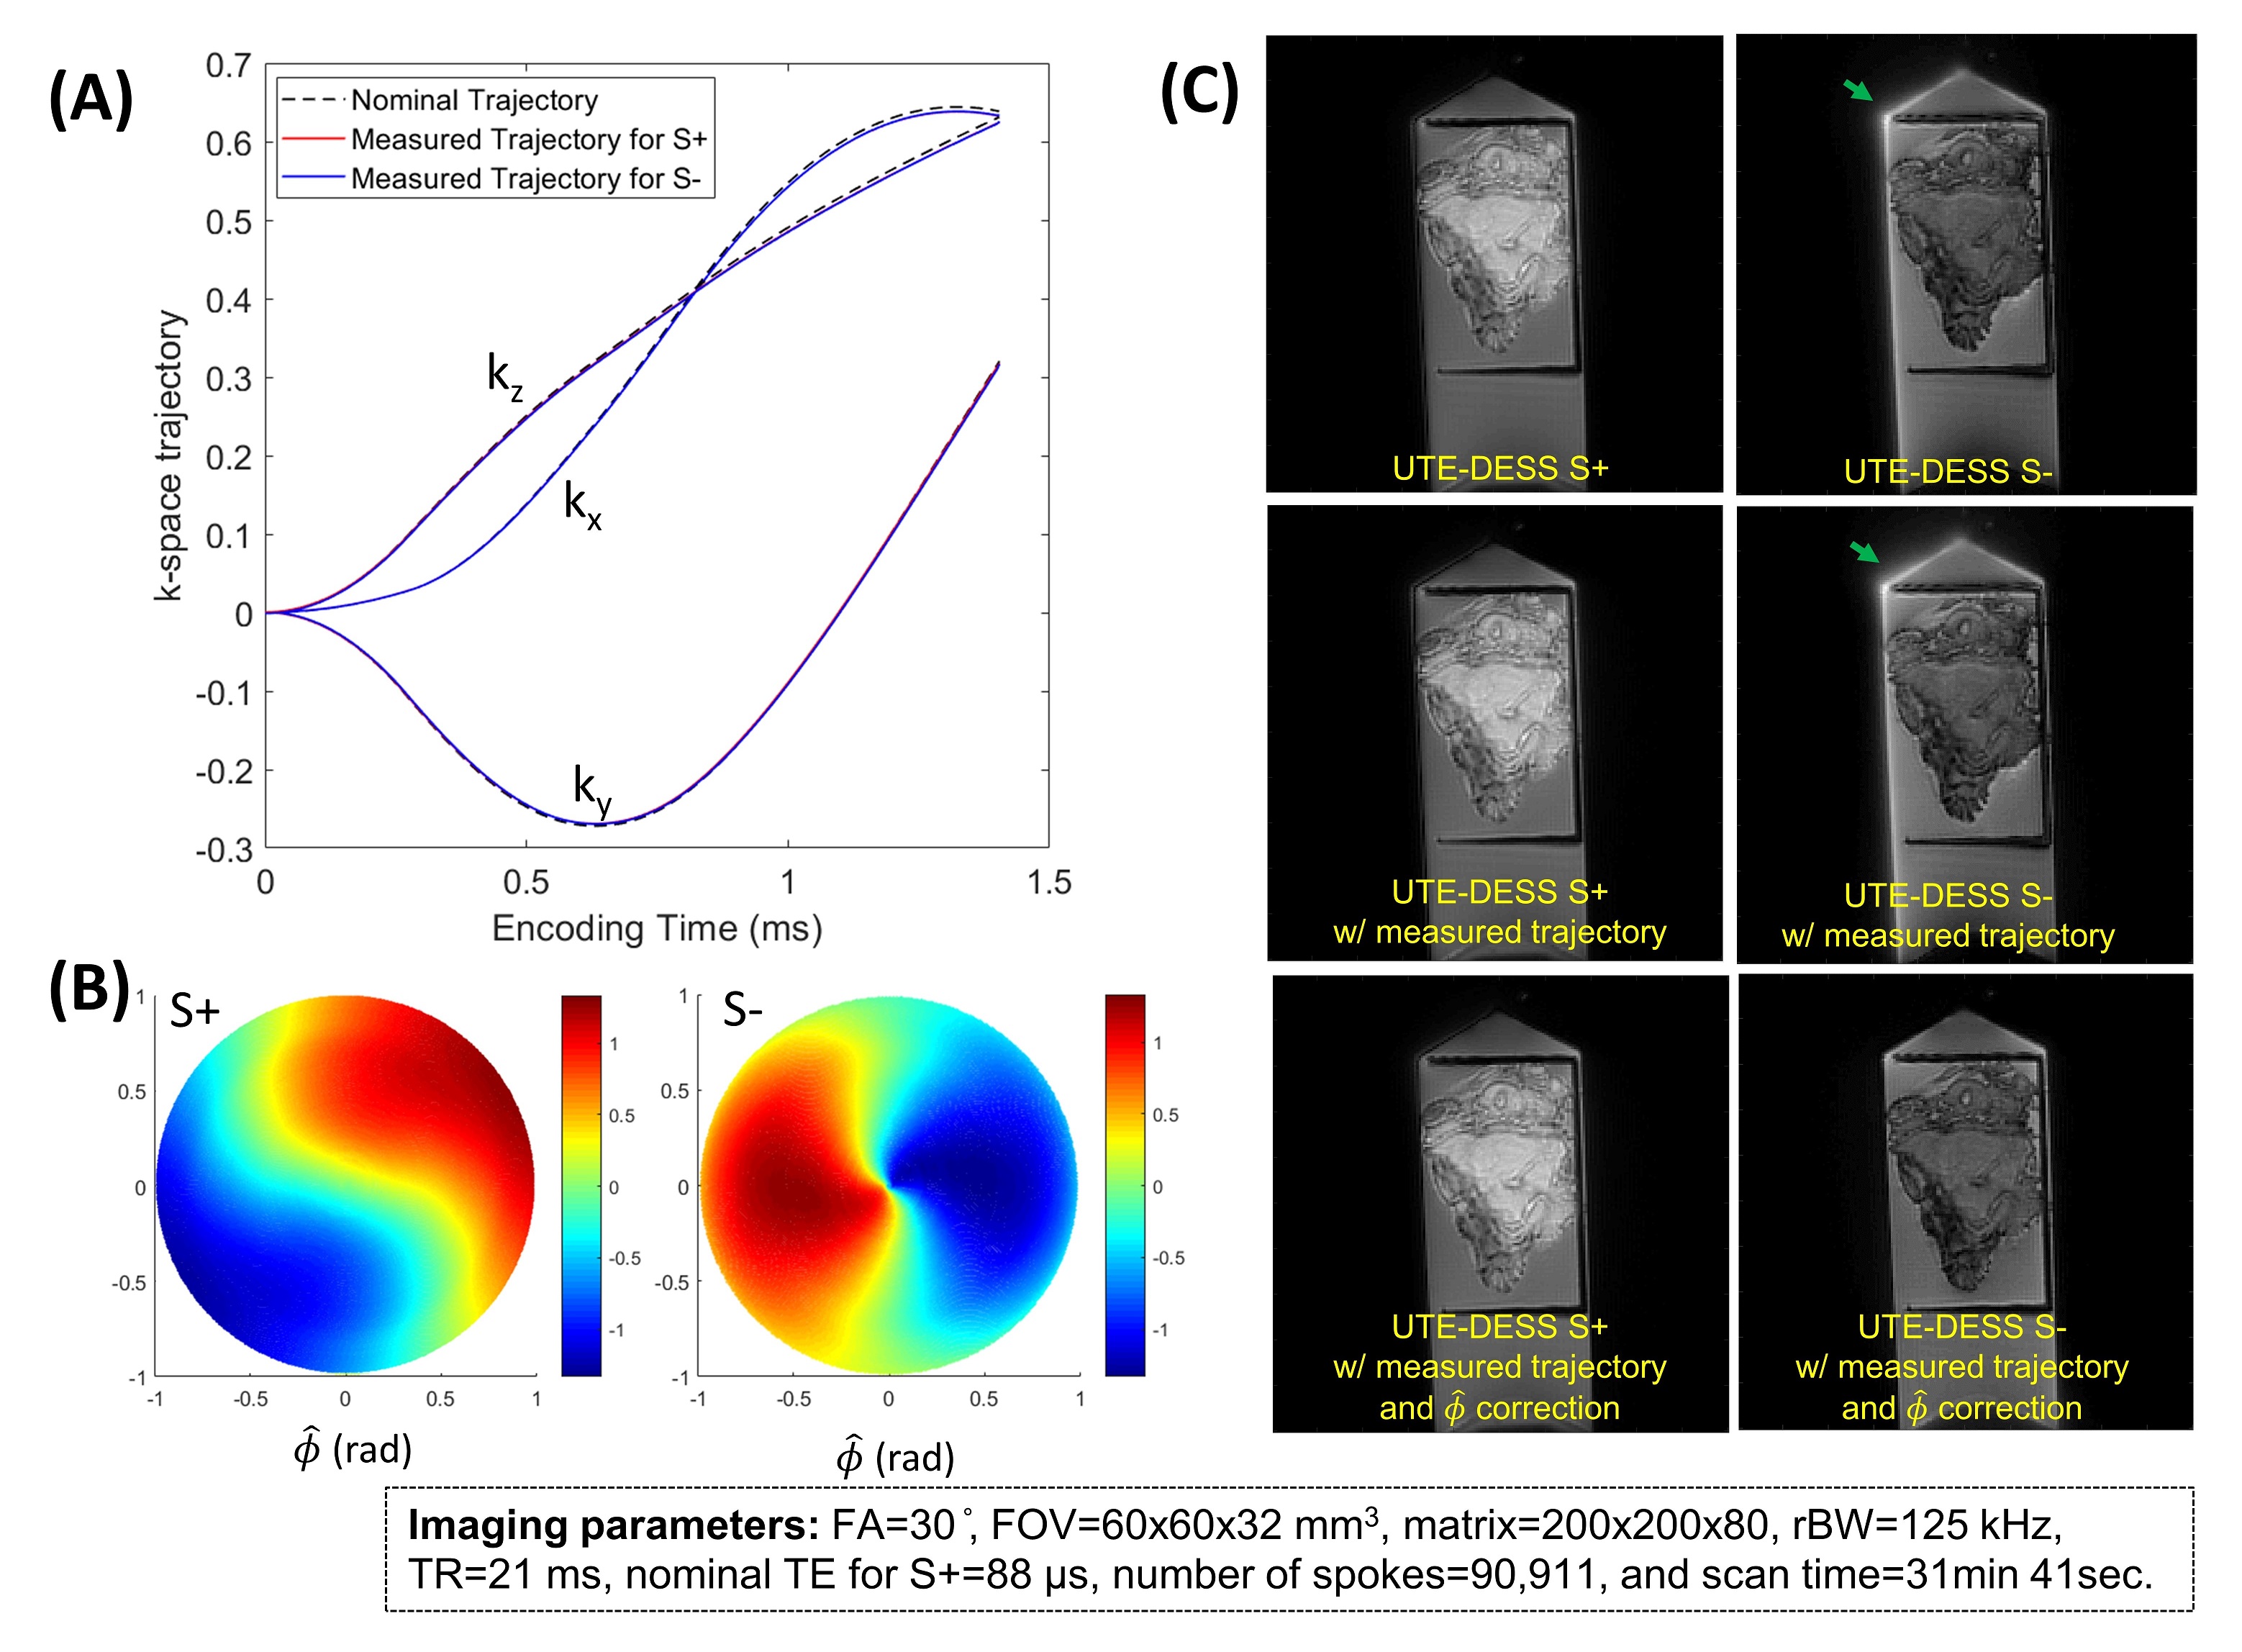
Figure 4 shows human synovium tissue from the knee joint scanned with UTE-DESS in 3D spiral-cones mode. The overall image quality was significantly improved by ECC especially for the S- image, where $$$\widehat{\phi}$$$ correction suppressed the blurriness artifact near the boundary of the syringe (green arrow).
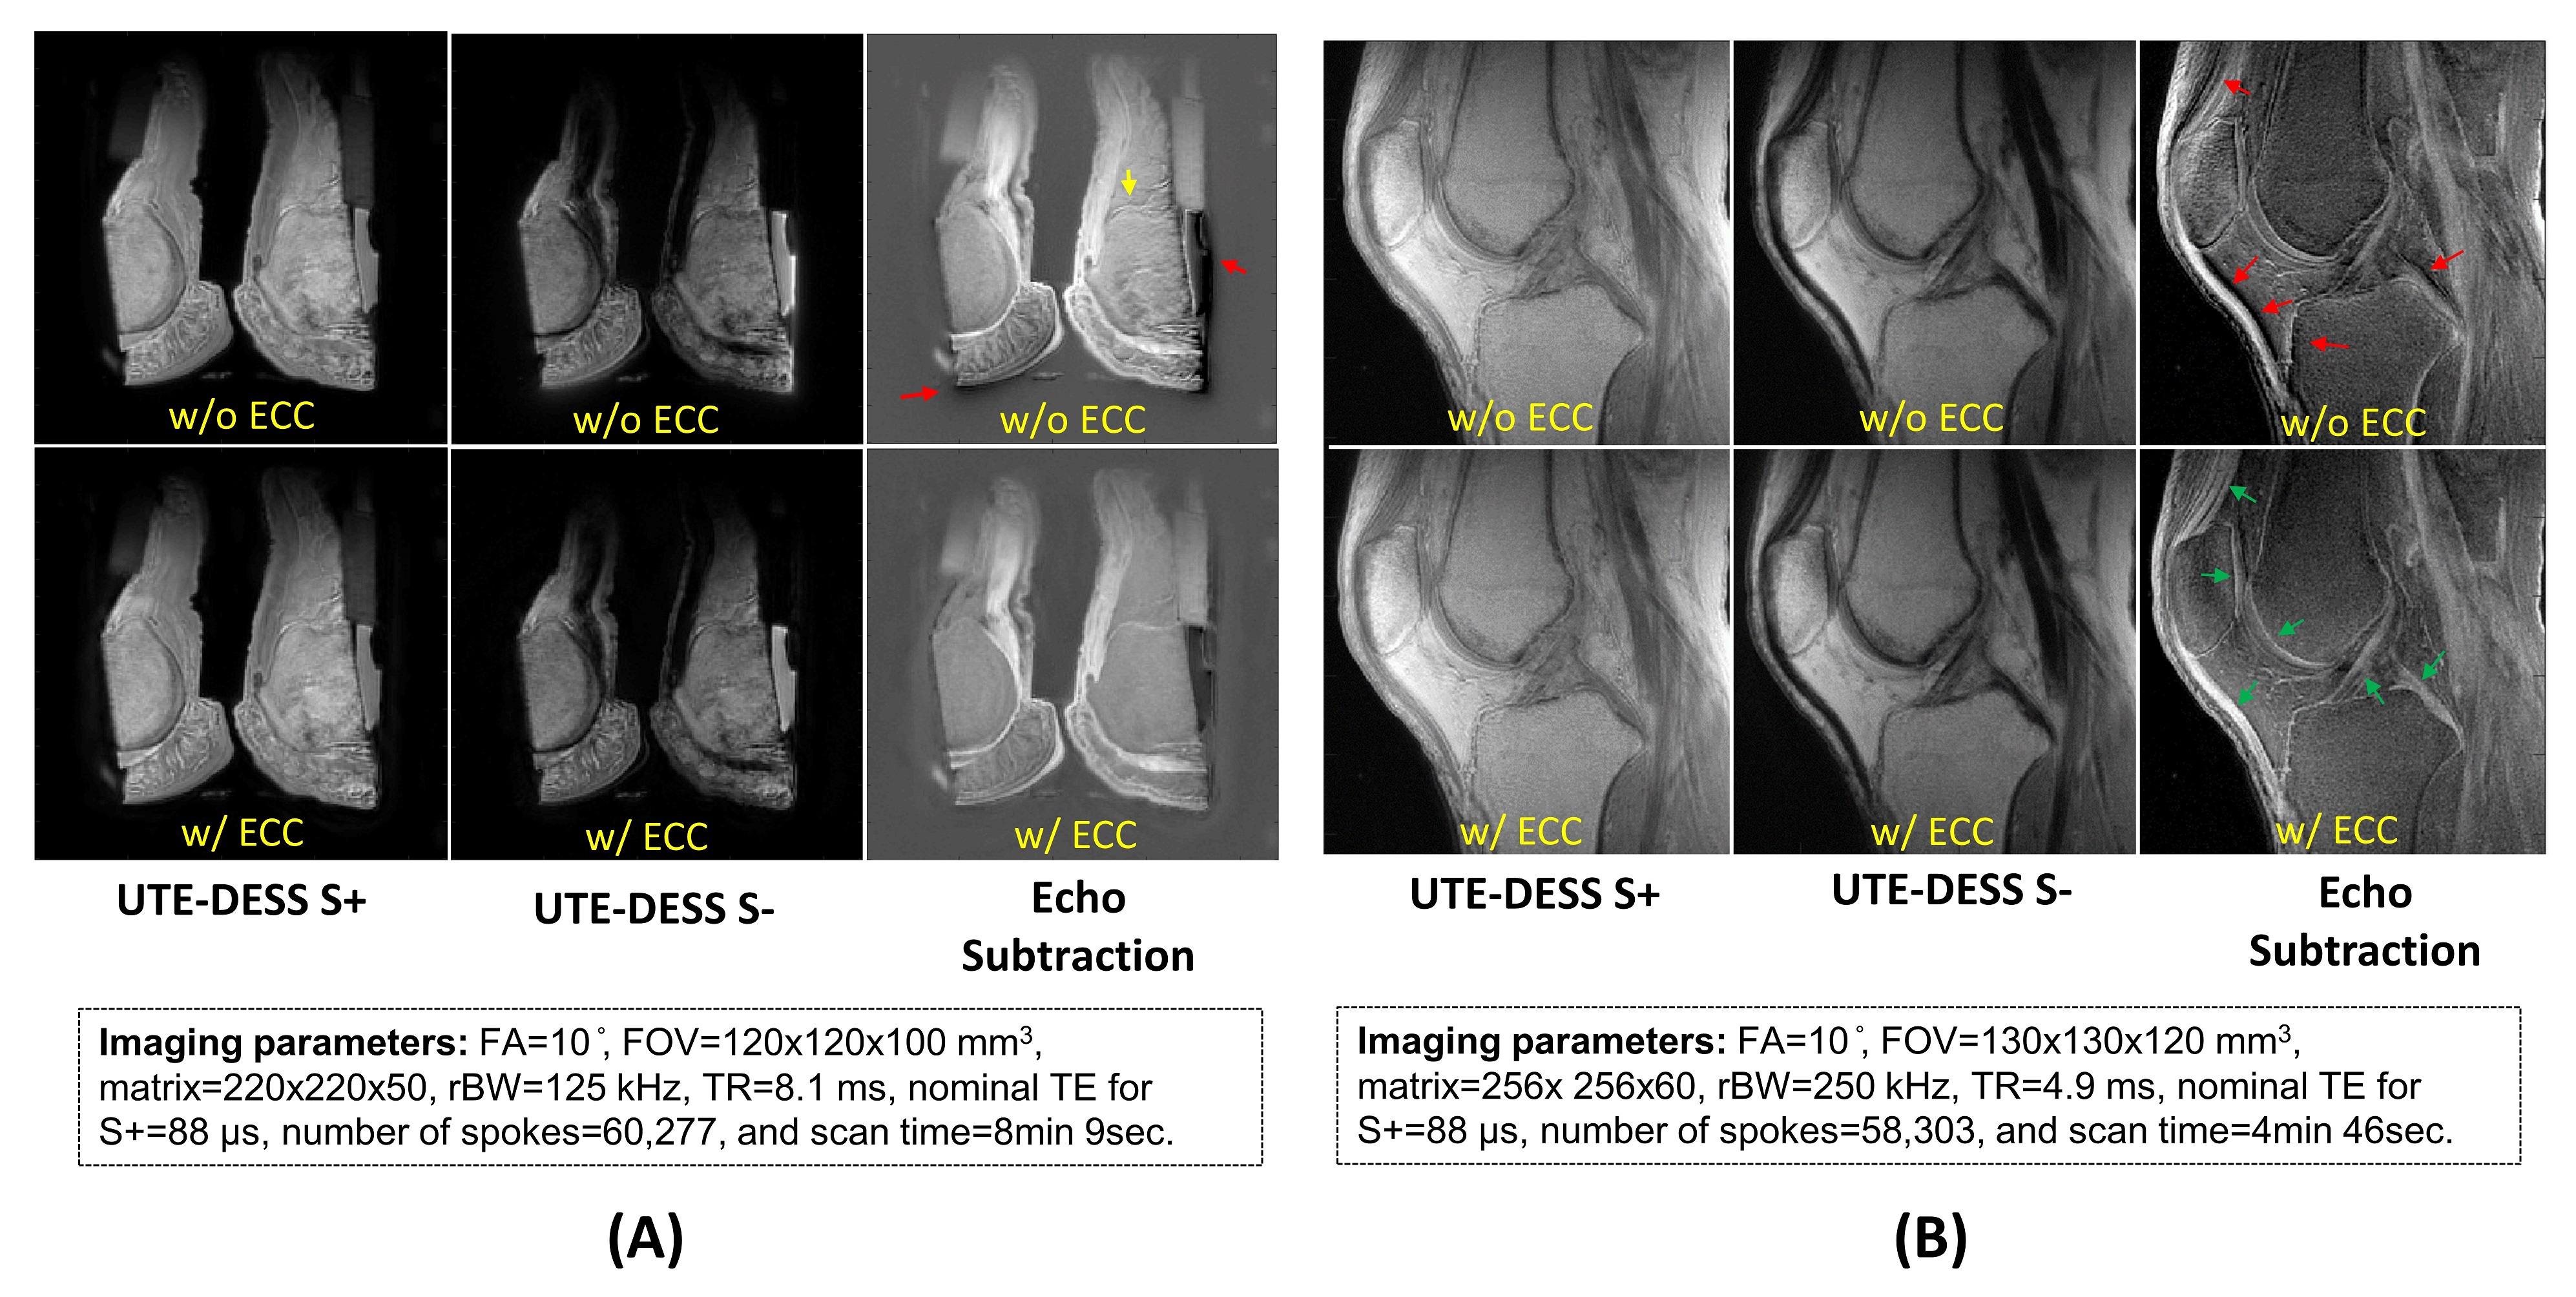
Figure 5A shows UTE-DESS images of human ankle specimens. ECC significantly improved short T2 contrast in the echo subtraction image by resolving the misalignment of pixels between the S+ and S- images (red arrows in 5A). Fine structures affected by the boundary effect (yellow arrow in 5A) were more clearly detected with ECC in the echo-subtracted image.
In the in vivo experiments, ECC dramatically improved depiction of short T2 tissues in the echo subtraction images for all study participants. Figure 5B shows the results from a representative healthy volunteer. ECC improved short T2 contrast in the echo subtraction image with significantly suppressed boundary effects (red arrows in 5B), resulting in improved depiction of the patellar tendon, quadriceps tendon, osteochondral junction, anterior cruciate ligament, and posterior cruciate ligament (green arrows in 5B).
Discussion and Conclusion
In UTE-DESS imaging, echo subtraction can be performed between S+ and S- to suppress long T2 tissues, thereby accentuating tissues with short T2 or high diffusivity 2,8. The pixel misalignment effect mainly caused by the B0 EC is a critical issue not only when performing echo subtraction with the S+ and S- images in UTE-DESS but also when performing quantitative parameter mapping 9,10, where adequate image registration is a pre-requisite. ECC is therefore an essential component for robust morphological and quantitative UTE-DESS imaging. EC can also cause difficulties in regular UTE imaging that utilizes a pair of center-out and fly-back gradients 11.Acknowledgements
The authors acknowledge grant support from the NIH (R01AR062581, R01AR068987, R01AR075825, R01AR078877, and R21AR075851), Veterans Affairs (I01RX002604 and I01CX001388), and GE Healthcare.References
1. Vannesjo SJ, Haeberlin M, Kasper L, et al. Gradient system characterization by impulse response measurements with a dynamic field camera. Magn. Reson. Med. 2013;69:583–93.
2. Chaudhari AS, Sveinsson B, Moran CJ, et al. Imaging and T2 relaxometry of short-T2 connective tissues in the knee using ultrashort echo-time double-echo steady-state (UTEDESS). Magn. Reson. Med. 2017;78:2136–2148.
3. Jang H, Ma Y, Carl M, Jerban S, Chang EY, Du J. Ultrashort echo time Cones double echo steady state (UTE‐Cones‐DESS) for rapid morphological imaging of short T 2 tissues. Magn. Reson. Med. 2021;86:881–892.
4. Brodsky EK, Klaers JL, Samsonov AA, Kijowski R, Block WF. Rapid measurement and correction of phase errors from B0 eddy currents: Impact on image quality for non-cartesian imaging. Magn. Reson. Med. 2013;69:509–515.
5. Robison RK, Li Z, Wang D, Ooi MB, Pipe JG. Correction of B0 eddy current effects in spiral MRI. Magn. Reson. Med. 2019;81:2501–2513.
6. Duyn JH, Yang Y, Frank J a, van der Veen JW. Simple correction method for k-space trajectory deviations in MRI. J. Magn. Reson. 1998;132:150–153.
7. Jang H, McMillan AB. A rapid and robust gradient measurement technique using dynamic single-point imaging. Magn. Reson. Med. 2017;78:950–962.
8. Jang H, Ma Y, Carl M, Jerban S, Chang EY, Du J. Ultrashort echo time Cones double echo steady state (UTE‐Cones‐DESS) for rapid morphological imaging of short T 2 tissues. Magn. Reson. Med. 2021;86:881–892.
9. Bieri O, Ganter C, Scheffler K. Quantitative in vivo diffusion imaging of cartilage using double echo steady-state free precession. Magn. Reson. Med. 2012;68:720–729.
10. Freed DE, Scheven UM, Zielinski LJ, Sen PN, Hürlimann MD. Steady-state free precession experiments and exact treatment of diffusion in a uniform gradient. J. Chem. Phys. 2001;115:4249–4258.
11. Jang H, Liu F, Bradshaw T, McMillan AB. Rapid dual-echo ramped hybrid encoding MR-based attenuation correction (dRHE-MRAC) for PET/MR. Magn. Reson. Med. 2018;79:2912–2922.
Figures