0238
Imaging eddy currents induced by crusher gradients using SPEEDI with sub-millisecond temporal resolution1Center for MR Research, University of Illinois at Chicago, Chicago, IL, United States, 2Department of Radiology, Stanford University, Stanford, CA, United States, 3Department of Radiology, University of Illinois at Chicago, Chicago, IL, United States, 4Department of Neurosurgery, University of Illinois at Chicago, Chicago, IL, United States, 5Department of Biomedical Engineering, University of Illinois at Chicago, Chicago, IL, United States
Synopsis
Crusher gradients, typically having very high amplitude, can induce a substantial amount of eddy currents, causing various artifacts. In order to fully characterize the spatiotemporal characteristics of the currents, we have developed a spin echo version of the previously reported SPEEDI technique. The method consists of a series of spin echo acquisitions where each echo point is assigned to a different k-space, reaching a temporal resolution equal to the dwell time. The measured phase difference between sequences with positive and negative crushers revealed B0 and linear eddy currents with time constants equal to the ones measured by the manufacturer’s tool.
Introduction
Crucial but often overlooked elements of MRI sequences are crusher gradients, routinely used to select the optimal signal pathways by suppressing the formation of undesired coherences1. In the case of spin echo sequences, a typical design consists of a pair of gradient lobes straddling the 180⁰ refocusing pulse. The pair is intended to remove the excited FID by the non-ideal refocusing pulse while restoring the refocused magnetization. The crusher gradients typically have very high amplitude in order to introduce sufficient phase dispersion over a short period of time. As such, they can induce a substantial amount of eddy currents, causing various artifacts. For example, eddy currents with time constants in the range of 1-5ms are particularly detrimental to fast-spin-echo sequences, yet very challenging to measure accurately using conventional techniques1. In this context, a precise measurement of the crushers-induced eddy currents has great value in mitigating artifacts and improving image quality1,2. In order to fully characterize the spatiotemporal characteristics of eddy currents arising from crushers, we have developed a spin echo version of the previously reported SPEEDI technique3,4. We herein describe this novel sequence and demonstrate its ability to image B0 and spatially linear eddy currents with sub-millisecond temporal resolution.Methods
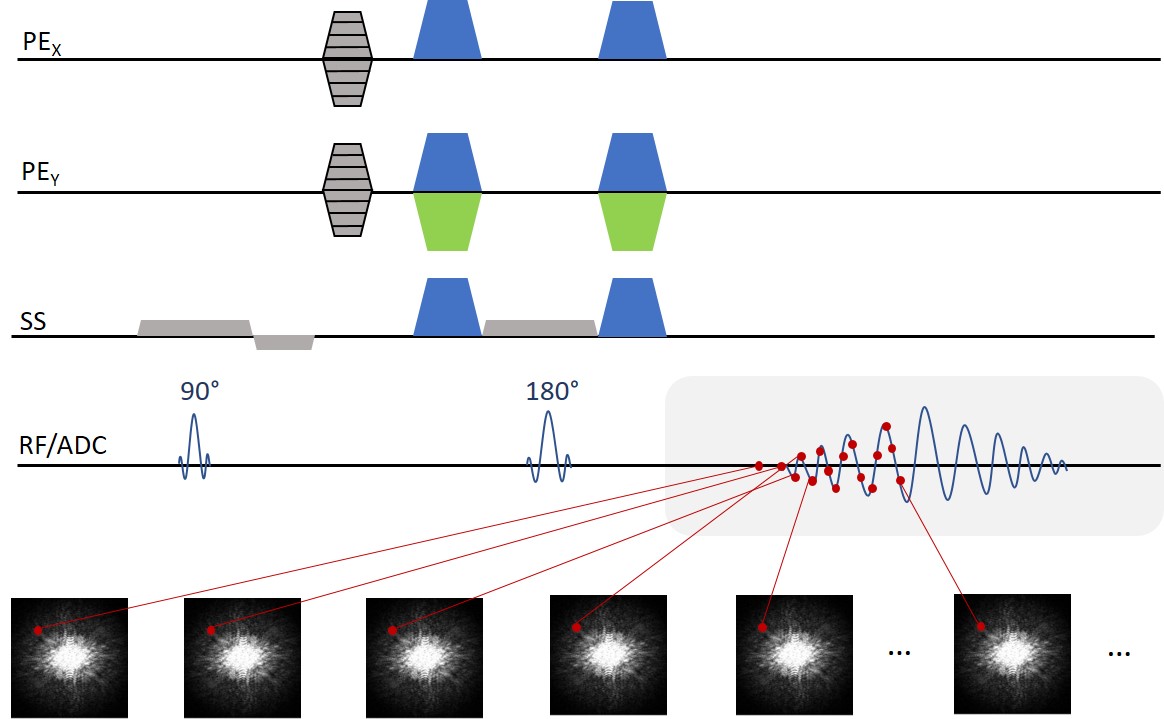
The original SPEEDI method consists of a series of FID acquisitions where each point of the FID is assigned to a different k-space3-6. Under the assumption that each acquisition is synchronized with a cyclic event, a series of time-resolved images can be fully assembled over several cycles. By doing so, the temporal resolution is greatly shortened, reaching a frame rate in effect equal to the dwell time. For 2D imaging, the spatial localization is accomplished by slice selection and 2D phase encoding. In this study, we extended SPEEDI from FID to spin-echo signals (Fig. 1). While maintaining the same concept of the FID-based SPEEDI, this sequence acquires the entire spin echo immediately after the refocusing pulse. The sequence was implemented on a clinical 3T scanner (GE MR 750, Waukesha, Wisconsin) and applied to a 17-cm ID spherical phantom containing silicone for spatially resolved eddy current measurements. Conventionally, eddy-current measurements rely on detecting the residual currents from a strong gradient played out before RF excitation. Here, the eddy currents were generated by the native crushers straddling the refocusing pulse. Crushers were played out with either positive or negative polarity along different axes (in-plane x and y) with known uncompensated eddy currents, including on-axis linear terms (along x and y) and the spatially independent B0 terms. The time constants measured using the manufacturer’s hardware tool7 served as a reference for our measurement. To characterize the fast-decaying eddy currents with time constants of the order of 1 ms, a bandwidth of 10 kHz was chosen, producing a temporal resolution of 0.1ms. Imaging parameters were TR=220ms, TE=57ms, slice thickness=5mm, FOV=22cm×22cm, matrix size=64×64, number of points=256, and total acquisition time=15min. For each time point in the image series, the phase difference between the images acquired with positive and negative crusher polarity (denoted by S+ and S-, respectively) was calculated according to:$$∆ϕ=arctan(\frac{Im(S_+ S_-^*)}{Re(S_+ S_-^*)})$$
The phase difference in each pixel was then fitted to an exponential model:
$$ϕ(t)=A(1-\exp(-(t+t_0)/τ))+C(t)$$
which describes the decaying eddy currents with amplitude A, time constant $$$\tau$$$, and a C term to account for other time dependent effects, e.g., the scanner frequency drift. The time constant $$$\tau$$$ obtained from the above equation was compared to the one measured using the manufacturer’s tool for each eddy-current component7.
Results
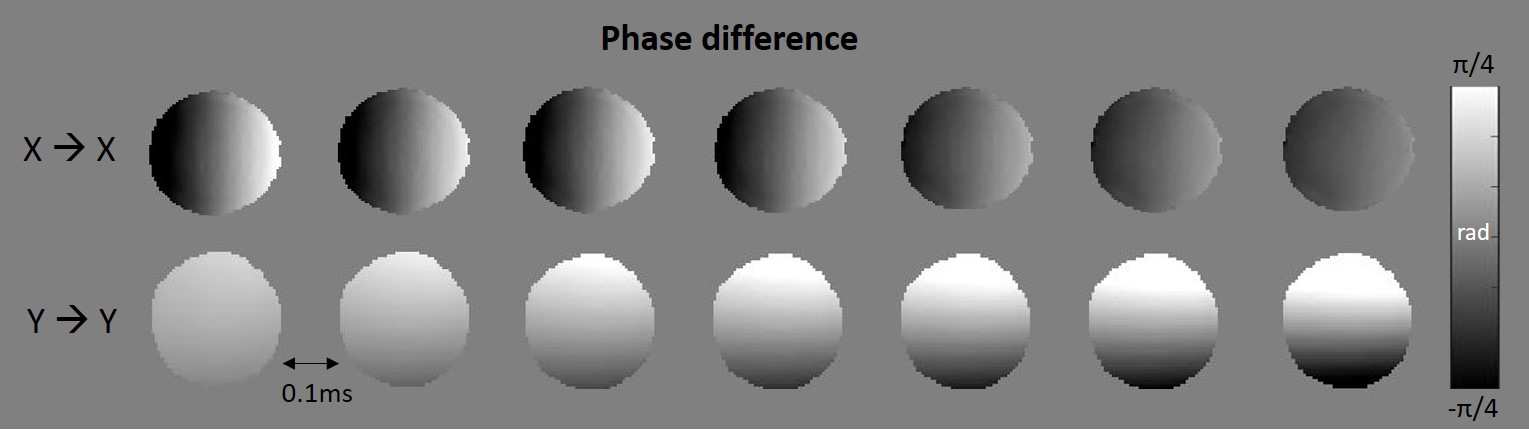
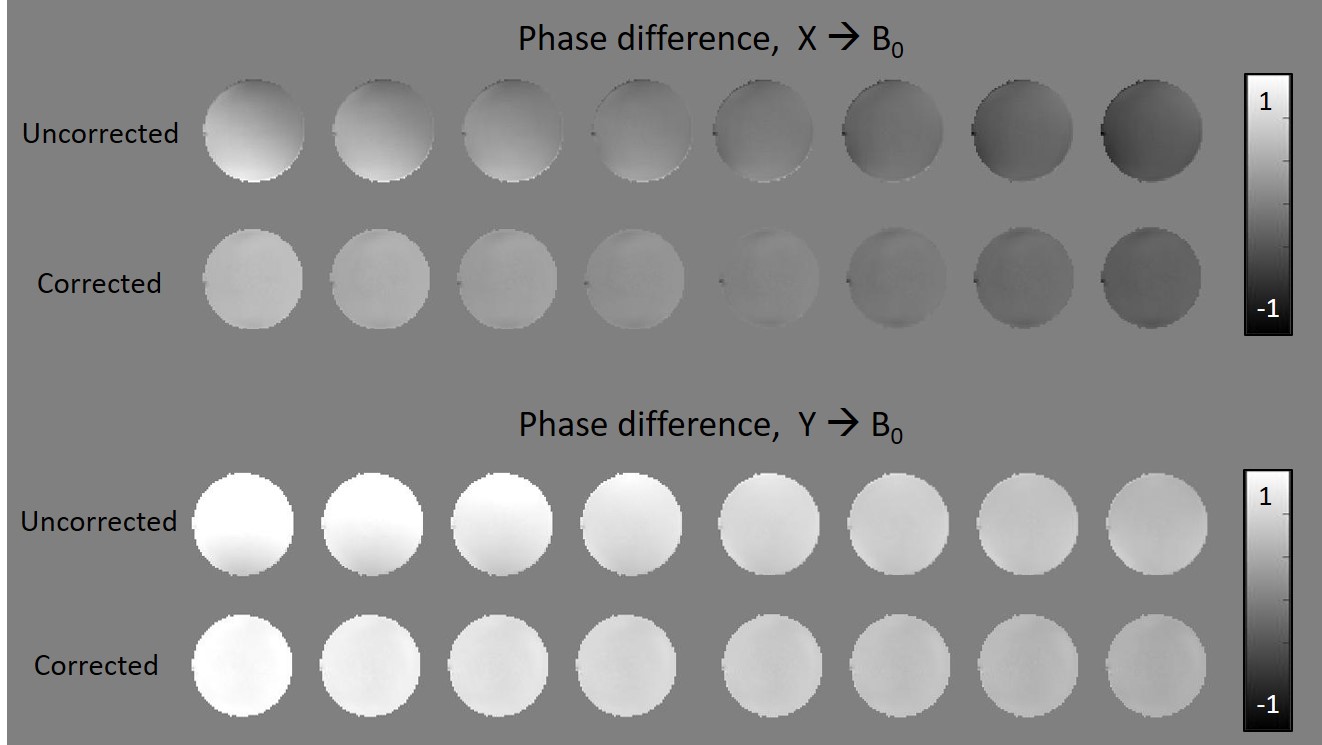
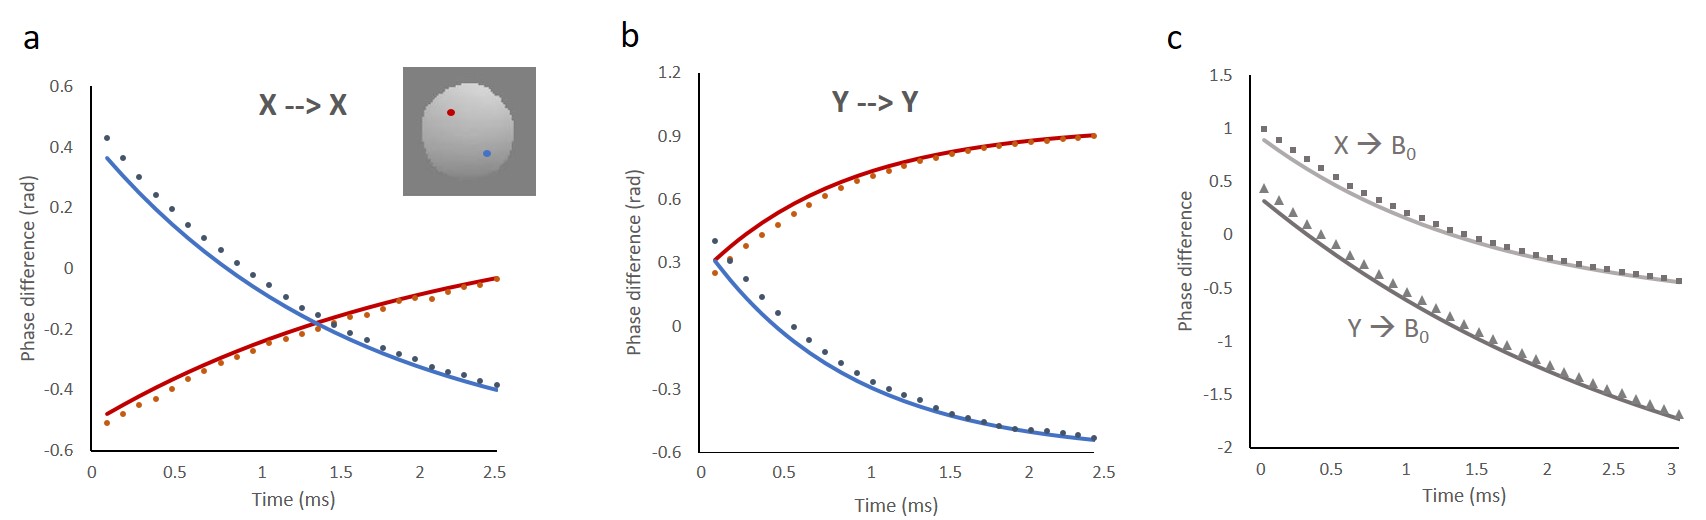
The spin-echo SPEEDI sequence produced a series of images reflecting the eddy current dynamics over time. In Figure 2, the change in the phase signal was evident across the entire field of view, with different spatial distributions for the linear on-axis terms. The time constants extracted by the fit were 1.82±0.61ms and 1.79±0.57ms for X and Y, which agree with the reference values: 1.85ms and 1.81ms, respectively. The phase difference due to the B0 terms also revealed, unexpectedly, a spatial dependency (Figure 3). Such non-uniformity in phase was likely due to incomplete correction of the linear eddy currents terms. After subtracting the phase change due to such residual eddy currents, the phase signal appeared spatially uniform (Figure 3) and the measured time constants were: 1.52±0.40ms and 3.01±0.11ms for crushers along X and Y respectively, comparable to the reference values of 1.59ms and 2.98ms. In Figure 4, the time course of the phase evolution is plotted at two randomly selected locations for each eddy-current term under study. Again, an excellent agreement was observed between spin-echo SPEEDI results and known eddy currents measured using the manufacturer’s tool.Conclusion
In this work, we have shown that the SPEEDI technique can be successfully implemented in a spin echo sequence. By virtue of the sub-millisecond temporal resolution (five-fold shorter than the previous reports3,4), we were able to capture the short-time -constant (~1-3ms) eddy currents produced by crusher gradients. The examples demonstrated in this study suggest that spin-echo SPEEDI may be used to characterize eddy currents with higher-order spatial distributions and assess other ultra-fast physical processes such as dynamically evolving electrical currents and cyclic biological phenomena like vocal fold oscillation and cardiac valve movement.Acknowledgements
This work was supported in part by the National Institutes of Health (Grant Nos. 5R01EB026716-01 and 1S10RR028898-01). We thank Dr. Kaibao Sun and Guangyu Dan for helpful discussions.References
1. Bernstein MA, King KF, Zhou XJ. Handbook of MRI Pulse Sequences. Amsterdam: Elsevier, Academic Press; 2004.
2. Nagy Z, Thomas DL, Weiskopf N. Orthogonalizing crusher and diffusion-encoding gradients to suppress undesired echo pathways in the twice-refocused spin echo diffusion sequence. Magn Res Med. 2014;71:506–515.
3. Zhong Z, Sun K, Karaman MM, Zhou XJ. Magnetic resonance imaging with sub-millisecond temporal resolution. Magn Reson Med. 2021;85:2434–2444
4. Zhong Z, Sun K, Dan G, Luo Q, Farzaneh-Far A, Karaman MM, Zhou XJ. Visualization of human aortic valve dynamics using magnetic resonance imaging with sub-Millisecond temporal resolution. J. Magn. Reson. Imaging 2021;54:1246–1254.
5. Bakker CJG, van Gorp JS, Verwoerd JL, et al. Multiple single-point imaging (mSPI) as a tool for capturing and characterizing MR signals and repetitive signal disturbances with high temporal resolution: The MRI scanner as a high-speed camera. Magn Reson Imaging. 2013;31:1037-1043.
6. Zhou XJ. Method for Measuring and Compensating for Spatially and Temporally Varying Magnetic Fields Induced by Eddy Currents. Washington DC: US Patent No. 5,770,943; 1998.
7. Glover GH, Pelc NJ. Method for Magnetic Field Gradient Eddy Current Compensation.: US Patent No. 4,698,591; 1986.
Figures