0231
Y-90 treatment lung shunting prediction of hepatocellular cancer using DCE MRI with kinetic modeling and quantitative transport mapping1Cornell University, Ithaca, NY, NY, United States, 2Weill Cornell Medical College, New York, NY, United States, 3Cornell University, New York, NY, United States
Synopsis
Trans-arterial radioembolization with yttrium-90 microspheres (TARE with Y90) is a treatment for patients with liver cancers, but requires the evaluation of lung shunting fraction (LSF). Currently, LSF is estimated using a separate invasive “dry-run” with a transient radioactive Technetium-99m macroaggregated albumin (Tc-99m-MAA) that doubles the cost and risk of TARE. This study proposes to predict LSF from dynamic contrast enhanced MRI (DCE MRI) and perfusion quantification. Our preliminary data demonstrated that it is feasible to estimate LSF as measured by Tc-99m-MAA from noninvasive DCE MRI using quantitative transport mapping (QTM) velocity.
Introduction
Trans-arterial radioembolization with yttrium-90 microspheres (TARE with Y90) has been widely adopted as a primary trans-arterial locoregional treatment for patients with hepatocellular carcinoma (HCC). Evaluation of lung shunting fraction (LSF) is a key step in Y90 treatment planning. Currently LSF estimation requires a pre-treatment invasive arteriogram using Technetium-99m macroaggregated albumin (Tc-99m MAA) injected into the hepatic artery using single photon computed emission tomography (SPECT) scans to determine the amount of Tc-99m MAA inside lungs1,2. This LSF estimation requires a dedicated hepatic artery catheterization that doubles the costs in time, expense, and risk to patients. Currently, there is no noninvasive method to estimate LSF. A more cost-efficient, safer, and radiation-free LSF estimation is needed for further development of Y90 therapy. We propose to predict LSF from noninvasive dynamic contrast enhanced (DCE) MRI using perfusion quantification (PQ). Two PQ methods were used to process DCE MRI in 25 patients with HCC: Kety’s tracer kinetic modeling with a delay-fitted global arterial input function (AIF) and quantitative transport mapping (QTM) based on the inversion of transport equation using spatial deconvolution.Methods
25 patients with HCC were enrolled. Diagnosis was determined based on the Liver Imaging Reporting and Data System (LIRADS)3. All the patients underwent trans-arterial radioembolization therapy utilizing Y-90 resin or glass microspheres. LSF was calculated from a single photon computed emission tomography (SPECT) scan after Tc-99m-macroaggregated albumin (MAA) administration4,5. Before Y90 treatment, the patients were scanned on a 1.5T scanner with contrast enhanced 3D CAIPI-VIBE sequence6 with imaging parameters: in-plane resolution 0.84mm, slice thickness 3mm, temporal resolution 5s, repetition time 4.68ms, echo time 2.39ms, flip angle 10°.Tracer concentration spacetime resolved imaged were estimated from relative enhancement of DCE MRI using a linear relationship7, and were then processed using quantitative transport mapping (QTM) and traditional kinetic modeling method. In QTM, tracer concentration was modeled by a transport equation8,9:
$$-\triangledown \cdot c(\boldsymbol r,t)\boldsymbol u(\boldsymbol r)=\partial_t c(\boldsymbol r,t) \quad [1] $$
Here $$$\partial_t$$$ is the time derivative, $$$\triangledown=(\partial_x,\partial_y,\partial_z)$$$ the gradient operator, $$$ c(\boldsymbol r,t)$$$ the tracer concentration scalar field at a voxel with index $$$\boldsymbol r = (r_x,r_y,r_z)$$$ in a volume of size $$$N_x,N_y,N_z$$$, and time index $$$t\subseteq { \left\{ 1,2,...N_t-1 \right\}}$$$ the time index with $$$N_t$$$ as the number of time frames. $$$\boldsymbol u (\boldsymbol r)= (u^x(\boldsymbol r),u^y(\boldsymbol r),u^z(\boldsymbol r))$$$ is an velocity vector field. Both time derivative and gradient operator are implemented using finite differences. Eq.1 is solved using ADMM with L1 total variation regularization (regularization parameter $$$\lambda=10^{-4}$$$ ):
$$u=argmin_u\sum_{t=1}^{N_t-1}||\partial_tc+\triangledown \cdot c\mathbf{u}||_2^2 + \lambda ||\triangledown\mathbf{u}||_1 \quad [2] $$
In traditional Kety’s tracer kinetics (also known as extended Tofts’ model), the tracer concentration was modeled by10:
$$\partial_tc(\boldsymbol r,t)=K^{trans}{\boldsymbol r}[c_a(t-\tau)-\frac{1}{V_e(\boldsymbol r)}c(\boldsymbol r,t)] \quad [3] $$
where $$$c_a(t) $$$ is the global AIF, $$$K^{trans}$$$ is volume transfer constant, $$$V_e(\boldsymbol r)$$$ is the volume fraction of extravascular extracellular space (EES), and $$$\tau$$$ is traveling delay. A voxel wise non-linear least square method is used Eq. 3 with additionoal regularization:
$$ K^{trans},K_{ep},\tau=argmin_{K^{trans},K_{ep},\tau}\sum _{t=1}^{N_t-1}||\partial_tc-K^{trans}c_a(t-\tau)+K_{ep}c||_2^2+\lambda ||\triangledown K^{trans}||_1 + \mu||\triangledown K_{ep}||_1 \quad [4] $$
where $$$\lambda$$$=$$$\mu$$$ = 10-3(chosen according to the L-curve method11) and $$$K_{ep}=\frac{K^{trans}}{V_e}$$$. For each patient, an experienced radiologist drew the AIF in the feeding artery of the tumor, and manually segmented regions of interest (ROI) consisting of the carcinoma that Y-90 radioembolization treated. $$$|\boldsymbol{u}|$$$, $$$K^{trans}$$$, $$$V_e$$$and $$$\tau$$$ were averaged over these ROIs.
The patients were separated into 2 groups: a low risk group (LSF<10%) and a high risk group (LSF≥10%). Mann-Whitney U tests were performed to compare parameters between low and high risk groups. A receiver operating characteristic curve (ROC) analysis was performed to investigate the risk prediction performance of all parameters. Spearman correlation test was performed to test the relationship between these parameters and lung shunting fraction.
Results
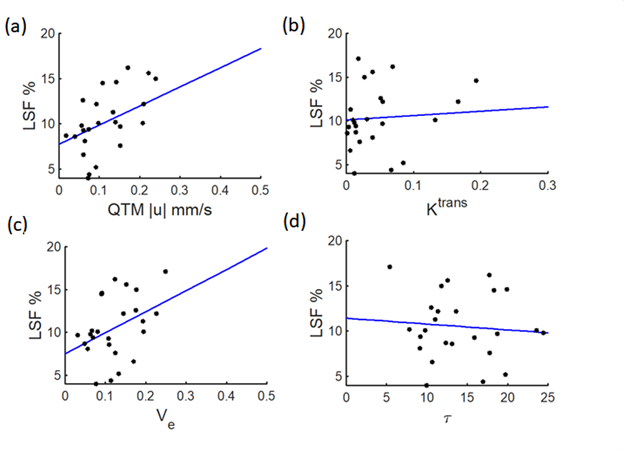
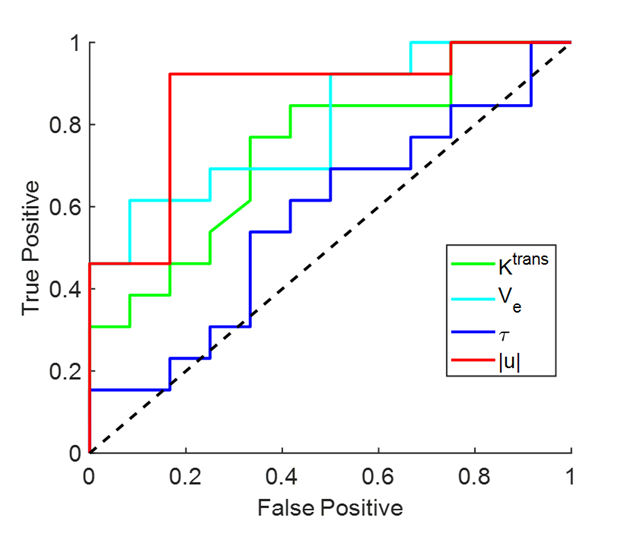
A representative post contrast DCE MRI image of a 74 years old low LSF patient (LSF=9.3%) is shown in Figure 1a. The lesion was well enhanced on post contrast DCE MRI image (red arrow). $$$|\boldsymbol{u}|$$$ , $$$K^{trans}$$$ and $$$V_e$$$ maps are shown in Figure 1b-d, respectively. $$$|\boldsymbol{u}|$$$was positively correlated with LSF (R2=0.3790, F=14.0363, p=0.0011). No significant relationship was found for$$$K^{trans}$$$ (R2=0.0772, F=1.9251, p=0.1786), $$$V_e$$$ (R2=0.1549, F=4.2168, p=0.0506) and $$$\tau$$$ (R2=0.0078, F=0.1815, p=0.6741). Mann-Whitney U tests indicated differences between the low and high LSF risk groups for $$$|\boldsymbol{u}|$$$ (0.0760 ± 0.0440 vs 0.1822±0.1225 mm/s, p=0.0011), $$$K^{trans}$$$ (0.07±0.04 vs 0.07±0.06, p=0.04) and $$$V_e$$$ (0.0900±0.0307 vs 0.1495±0.0485, p=0.0114). No significant difference was found for $$$\tau$$$ (14.43±3.86 vs 13.12±3.87s, p=0.5679). $$$|\boldsymbol{u}|$$$ gave rise to the highest AUC value (AUC=0.86), followed by $$$V_e$$$ (AUC=0.80), $$$K^{trans}$$$ (AUC=0.74), and $$$\tau$$$ (AUC=0.57). A correlation plot, box plot for the U test, and ROC curve are shown in Figures 2-4, respectively.Discussion and Conclusion
This study demonstrated the feasibility of using QTM for LSF prediction based on noninvasive pretreatment DCE MRI data. QTM velocity $$$|\boldsymbol{u}|$$$ showed the highest correlation with LSF ($$$R^2=0.3790$$$), following volume fraction $$$V_e$$$($$$R^2=0.1549$$$); $$$|\boldsymbol{u}|$$$ and $$$V_e$$$ can distinguish low LSF and high LSF patients with good accuracy (AUC=0.86 and 0.80, respectively). Future work should include enlarging the dataset and exploring the LSF prediction accuracy of the combination of DCE MRI and other MR modalities to further improve the model performance.Acknowledgements
No acknowledgement found.References
(1) Balogh J, Victor III D, Asham EH, Burroughs SG, Boktour M, Saharia A, et al. Hepatocellular carcinoma: a review. Journal of hepatocellular carcinoma 2016;3:41
(2) Salem R, Gabr A, Riaz A, Mora R, Ali R, Abecassis M, et al. Institutional decision to adopt Y90 as primary treatment for hepatocellular carcinoma informed by a 1,000‐patient 15‐year experience. Hepatology 2018;68(4):1429-40.
(3) Mitchell DG, Bruix J, Sherman M, Sirlin CB. LI‐RADS (Liver Imaging Reporting and Data System): Summary, discussion, and consensus of the LI‐RADS Management Working Group and future directions. Hepatology 2015;61(3):1056-65.
(4) Camacho JC, Moncayo V, Kokabi N, Reavey HE, Galt JR, Yamada K, et al. 90y radioembolization: Multimodality imaging pattern approach with angiographic correlation for optimized target therapy delivery. Radiographics 2015;35(5):1602-18.
(5) Elsayed M, Martin JG, Dabrowiecki A, Goldman DT, Faraj R, McMahon JT, et al. Tc-99m-MAA lung shunt fraction before Y-90 radioembolization is low among patients with non-hepatocellular carcinoma malignancies. Nuclear medicine communications 2019;40(11):1154-7
(6) Morani AC, Vicens RA, Wei W, Gupta S, Vikram R, Balachandran A, et al. CAIPIRINHA-VIBE and GRAPPA-VIBE for liver MR imaging at 1.5 T: a comparative in vivo patient study. Journal of computer assisted tomography 2015;39(2):263.
(7) Jansen SA, Fan X, Karczmar GS, Abe H, Schmidt RA, Newstead GM. Differentiation between benign and malignant breast lesions detected by bilateral dynamic contrast‐enhanced MRI: a sensitivity and specificity study. Magnetic Resonance in Medicine: An Official Journal of the International Society for Magnetic Resonance in Medicine 2008;59(4):747-54.
(8) Zhou, Liangdong, Qihao Zhang, Pascal Spincemaille, Thanh D. Nguyen, John Morgan, Weiying Dai, Yi Li, Ajay Gupta, Martin R. Prince, and Yi Wang. "Quantitative transport mapping (QTM) of the kidney with an approximate microvascular network." Magnetic resonance in medicine 85, no. 4 (2021): 2247-2262.
(9) Zhang, Qihao, Pascal Spincemaille, Michele Drotman, Christine Chen, Sarah Eskreis-Winkler, Weiyuan Huang, Liangdong Zhou et al. "Quantitative transport mapping (QTM) for differentiating benign and malignant breast lesion: Comparison with traditional kinetics modeling and semi-quantitative enhancement curve characteristics." Magnetic Resonance Imaging (2021).
(10) Sourbron S. A tracer-kinetic field theory for medical imaging. IEEE Trans Med Imaging 2014;33(4):935-46.
(11) Jafari R, Chhabra S, Prince MR, Wang Y, Spincemaille P. Vastly accelerated linear least-squares fitting with numerical optimization for dual-input delay-compensated quantitative liver perfusion mapping. Magn Reson Med 2018;79(4):2415-21.
Figures