0223
300 mT/m diffusion MRI 'below the neck': First results in healthy prostate1Cardiff University Brain Research Imaging Centre (CUBRIC), Cardiff University, Cardiff, United Kingdom, 2Siemens Healthcare Ltd, Camberly, United Kingdom, Camberly, United Kingdom, 3Siemens Healthcare GmbH, Erlangen, Germany, Erlangen, Germany, 4Centre for Medical Image Computing, University College London, London, United Kingdom, 5Image Sciences Institute, University Medical Center Utrecht, Utrecht, Netherlands
Synopsis
This work showcases the first ever use of ultra-strong gradient in ’below the neck’ human MRI. It assesses the benefits, compared to more commonly-available gradient strengths, of 300mT/m gradients for comprehensive characterization of the prostate gland. Leveraging such gradient amplitudes enables unique tissue contrasts, with a potential to improve specificity and/or sensitivity of current MRI methods for prostate cancer characterisation and detection.
Introduction
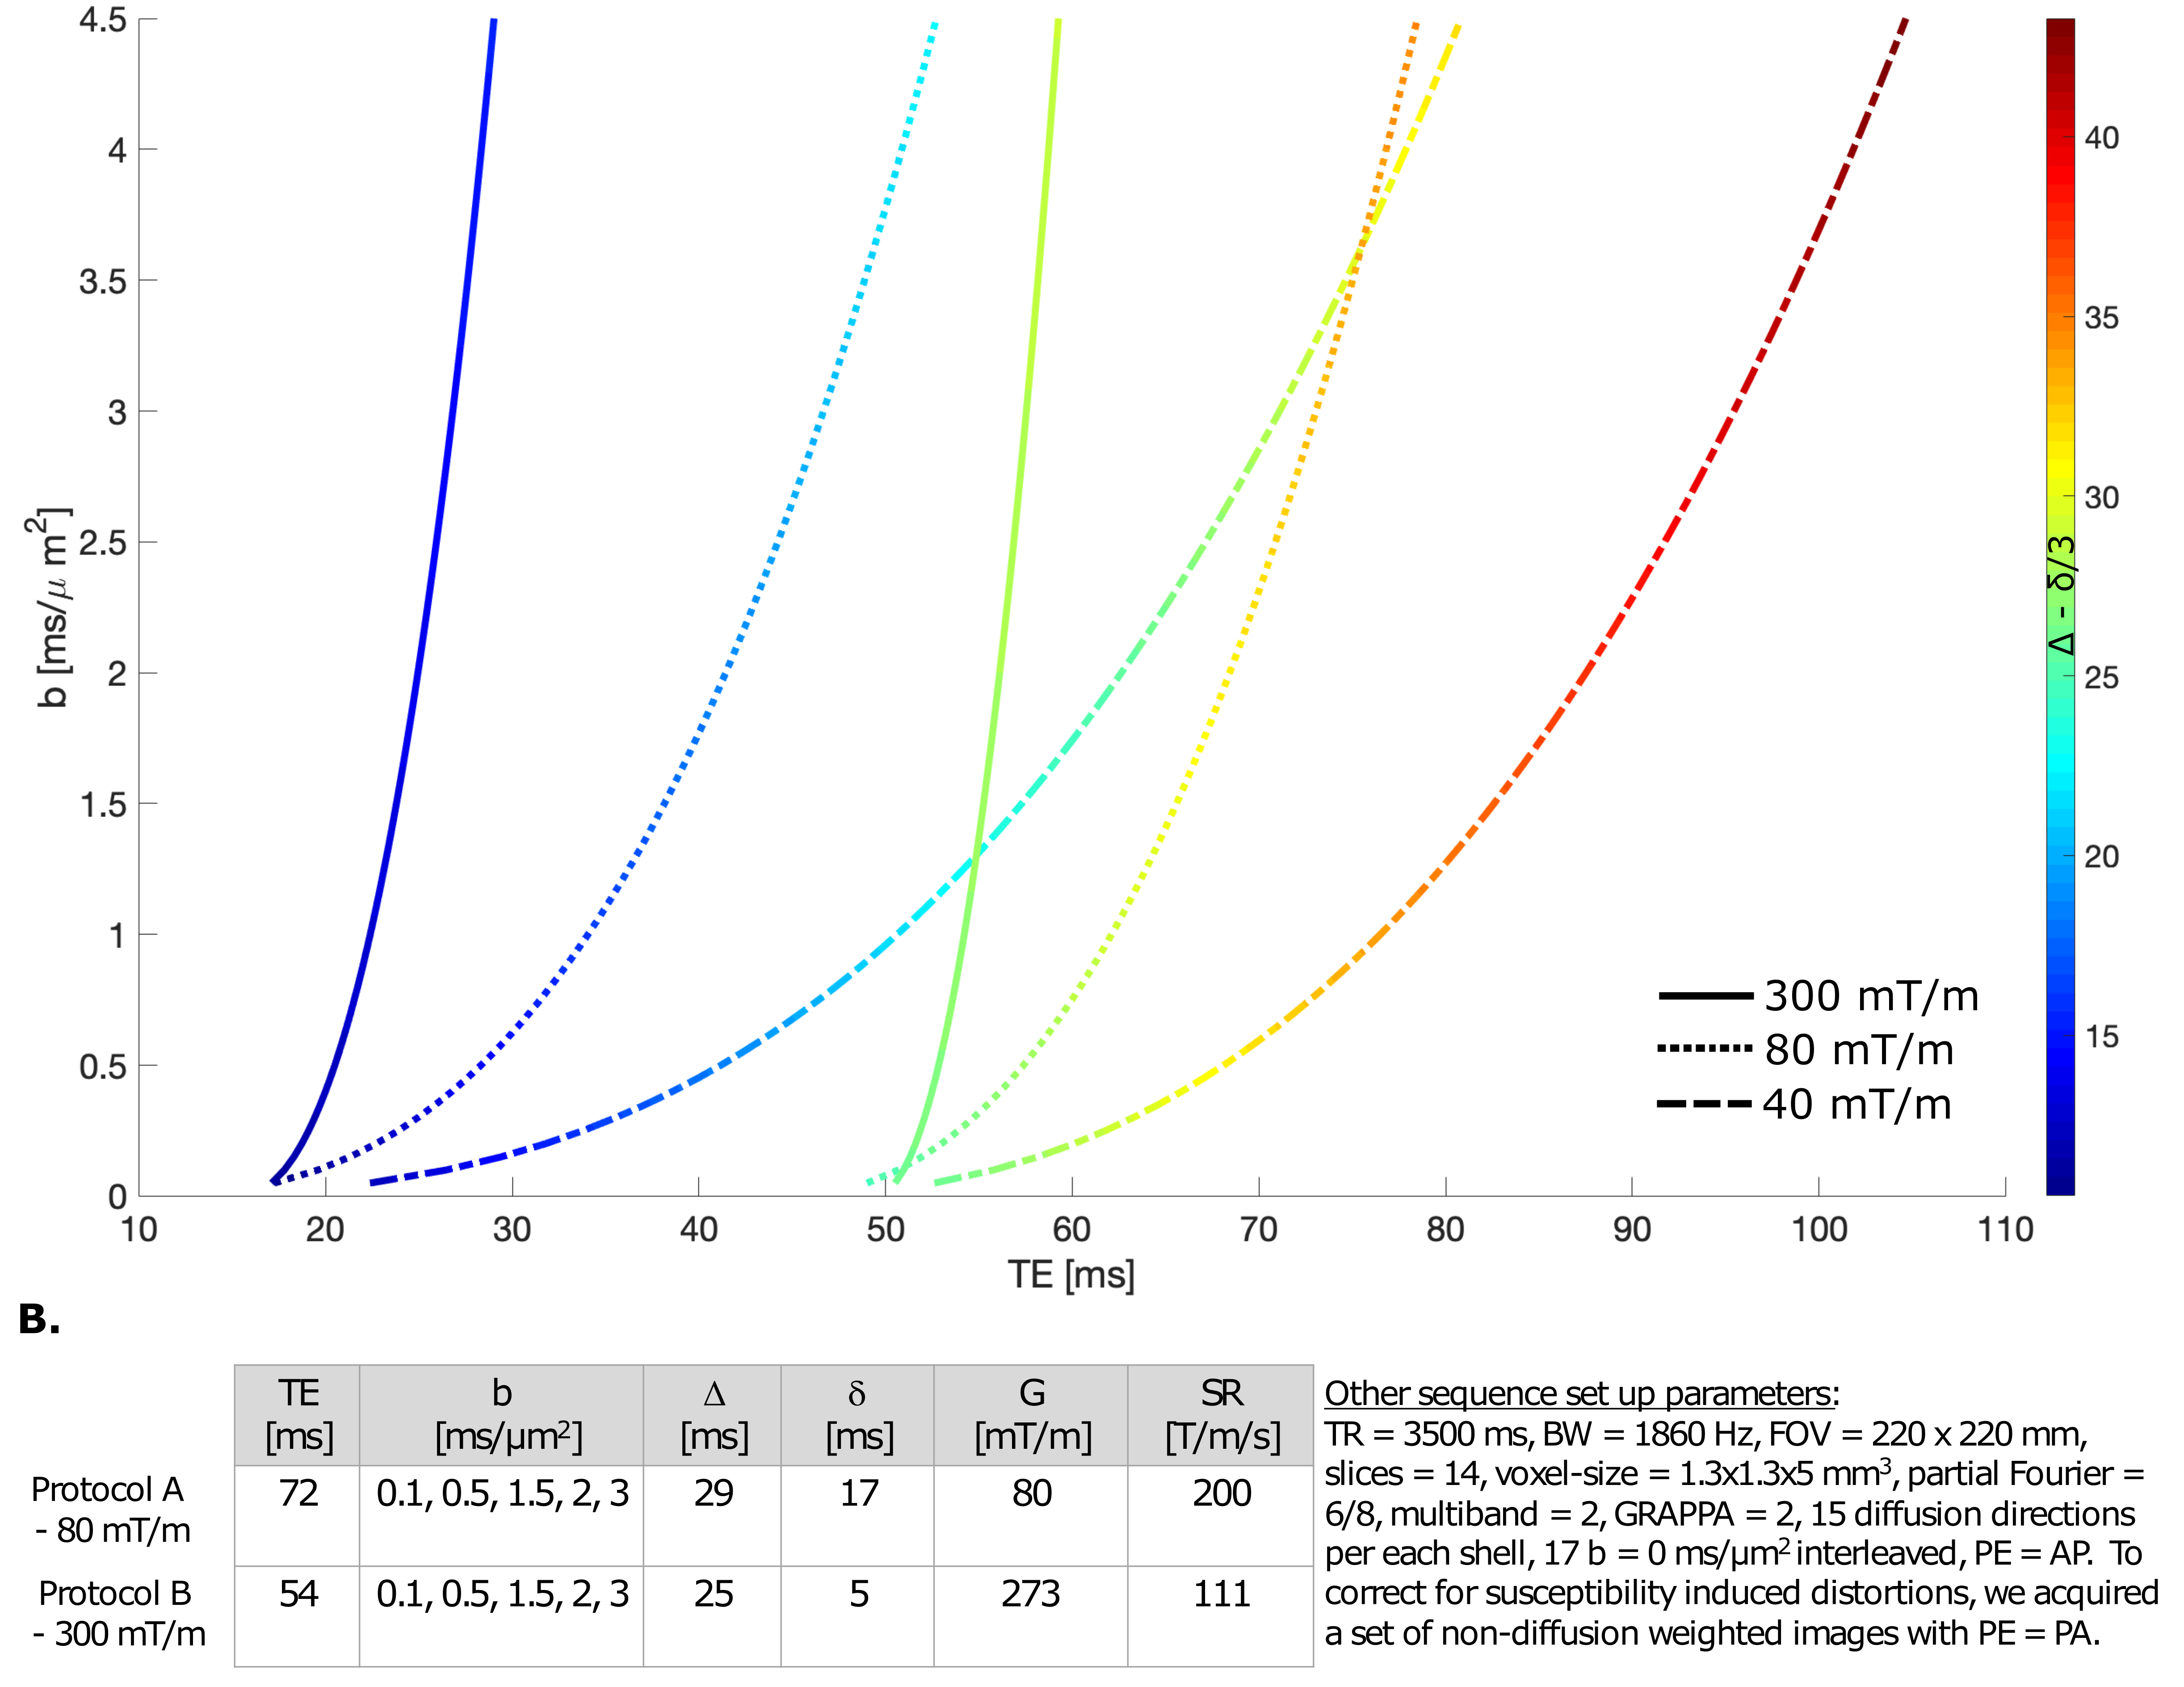
Diffusion MRI (dMRI) experiments can benefit from strong gradients which allow for shorter TE for a given diffusion-encoding (Fig.1A), and hence reducing T2 signal loss. In recent years, various strong-gradient whole body1,2 and head-only3–6 systems have been developed, showing clear benefits for microstructural imaging7–10. These systems were designed for neuroscientific research and so, to date, have only been utilised for brain dMRI. Here we report the first application of a 300 mT/m whole body system for dMRI in the prostate.Methods
Data acquisitiondMRI data were acquired using a PGSE EPI sequence on an ultra-strong gradient (300mT/m) 3T Connectom research-only MRI scanner, equipped with Flex Large 4 andBody 18 coils (Siemens Healthcare, Erlangen, Germany). One 51-year old healthy volunteer was scanned using two protocols: Protocol A, running the scanner with maximum gradient strength of 80 mT/m, achievable on state-of-the-art clinical scanners, and Protocol B, leveraging the ultra-strong Connectom gradients. A detailed overview of the protocols is given in Fig.1B.
Data processsing
Images were denoised11, corrected for Gibbs ringing12, B0 field inhomogeneity distortions13 and gradient nonlinearity distortions14, and spatio-temporal B-matrices were computed15,16.
Data analysis
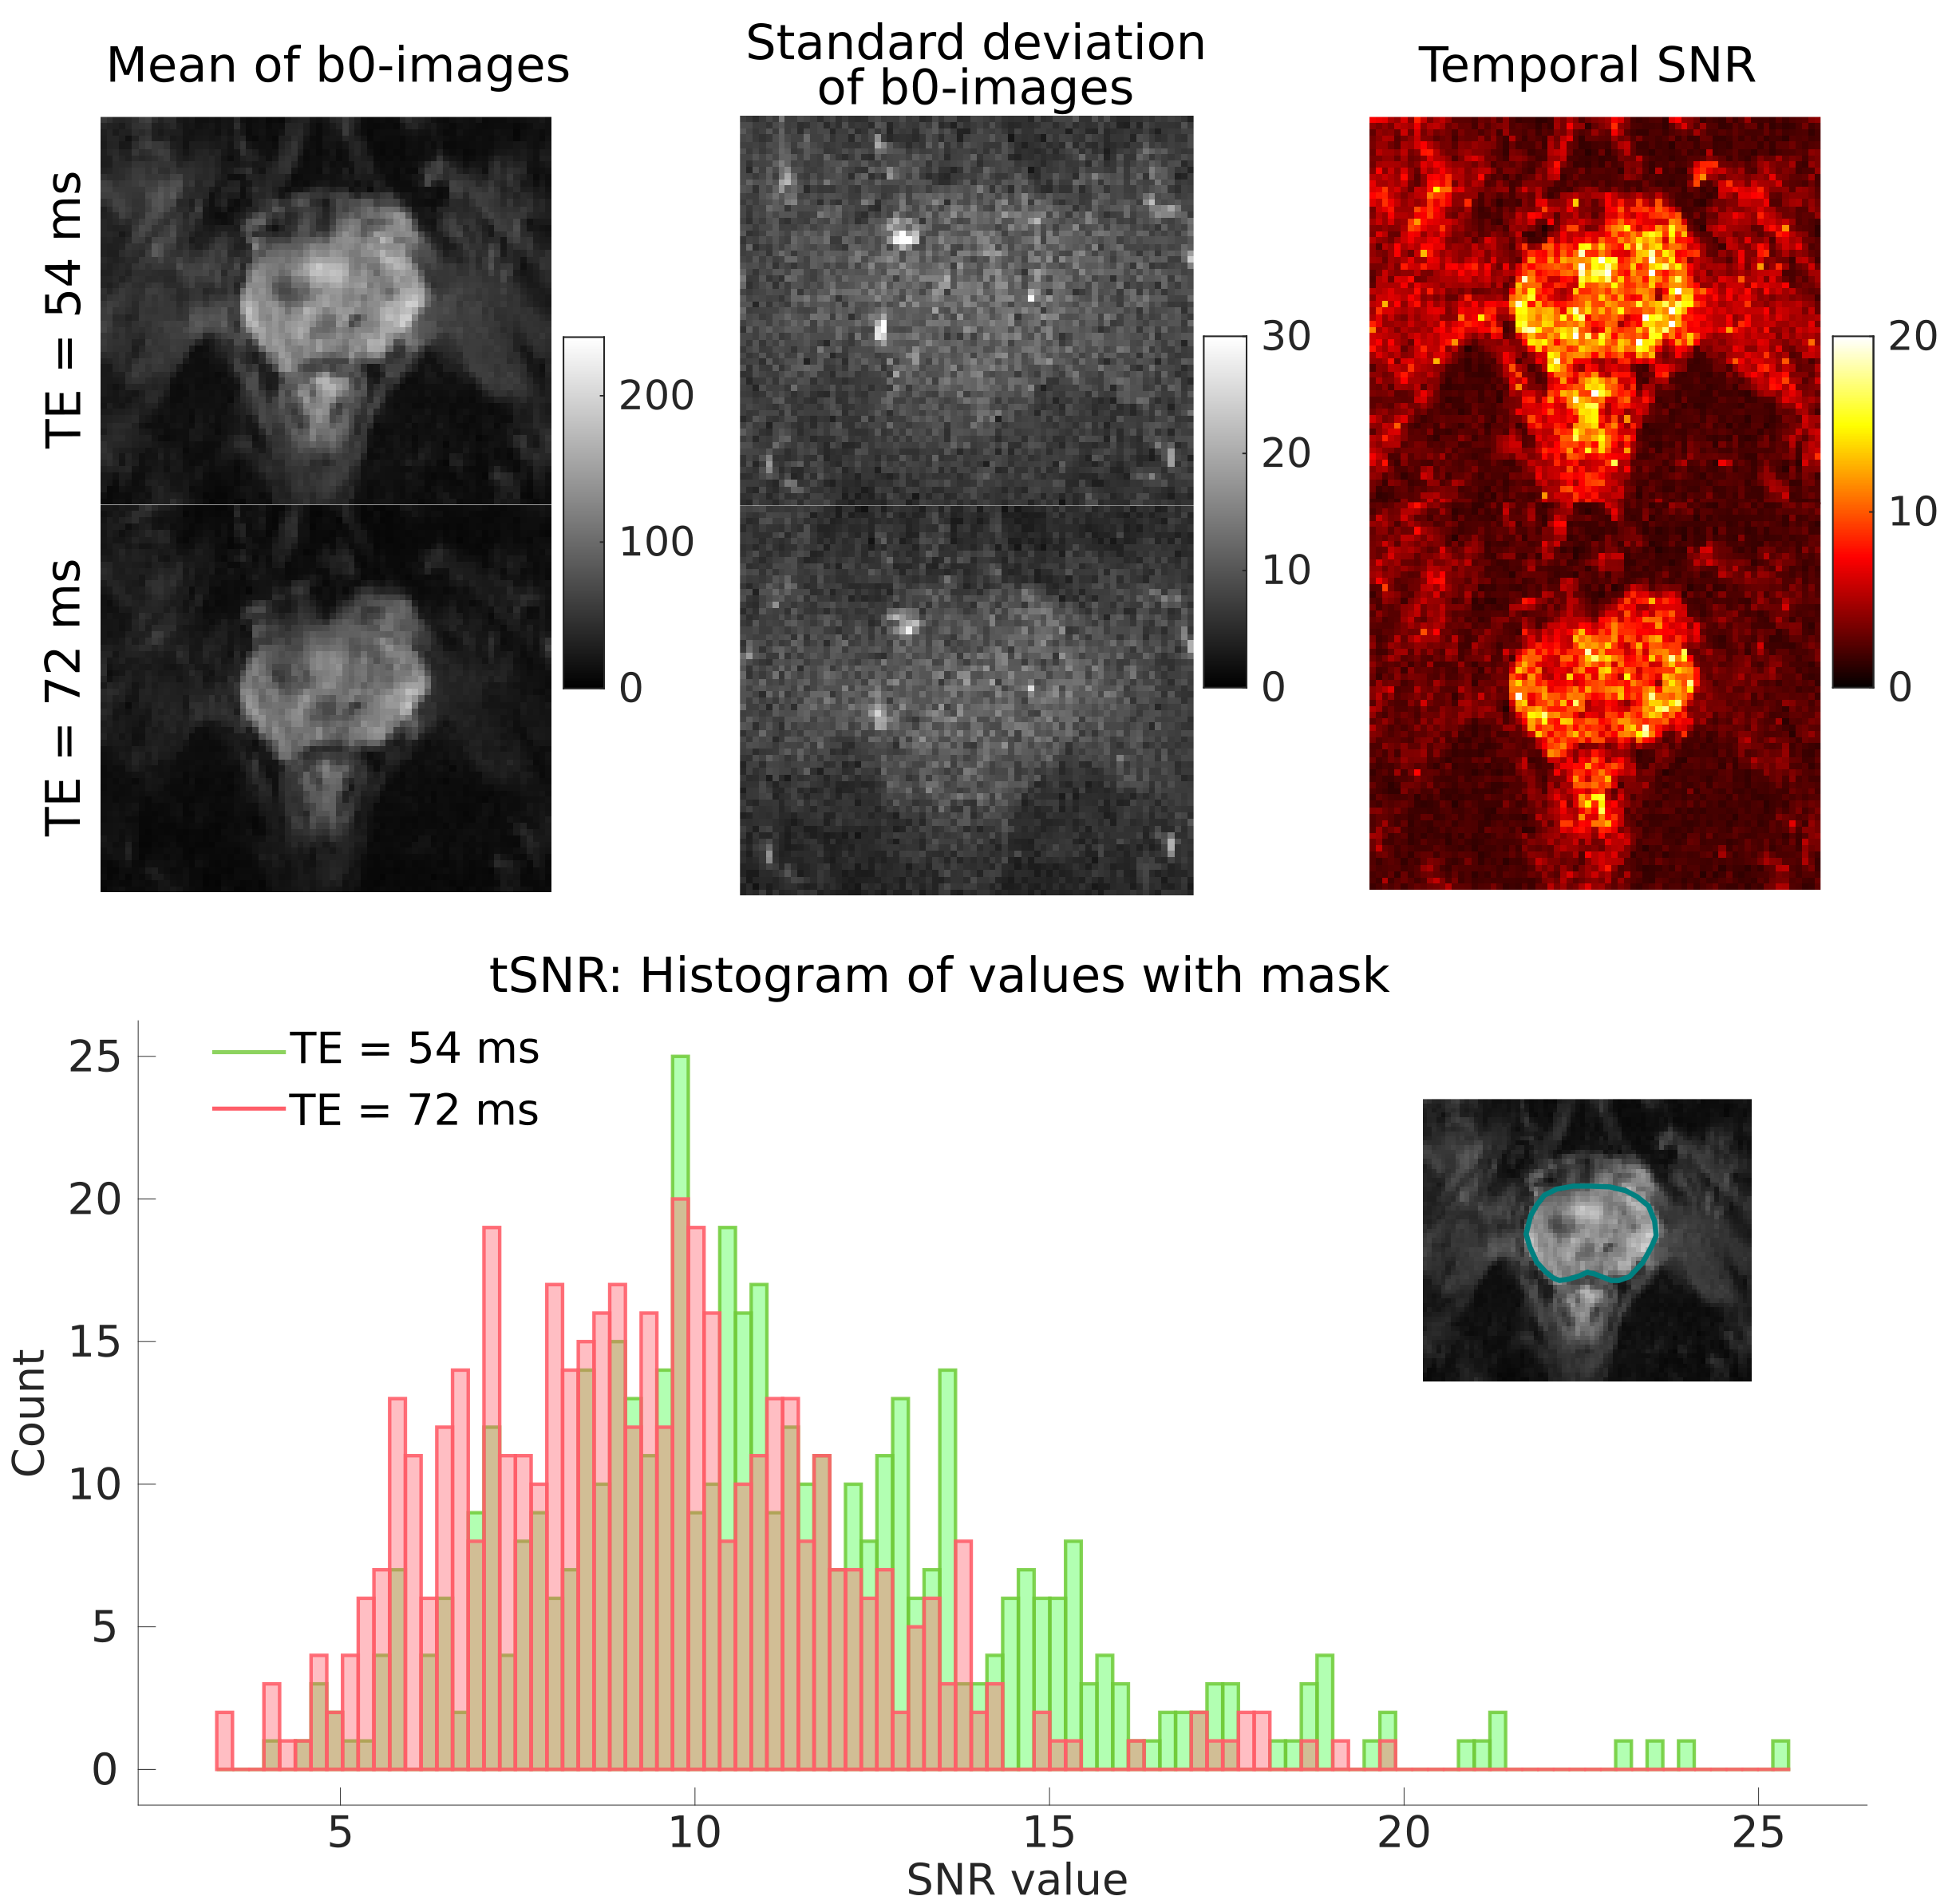
Temporal SNR (tSNR) was assessed for datasets acquired with both protocols using 15 b0-images. The voxelwise tSNR was calculated as the ratio of mean over standard deviation of the signal in the prostate. ROI-based analysis was performed on spherically-averaged data to evaluate signal intensities in different regions of the prostate.
Simulations
A three-pool model17 was used to simulate signals with parameters as depicted in Fig.5. 1000 Rician noise realizations were generated. The achievable TE for a given b-value were obtained by simulating sequence diagrams using EPI and spiral readouts with slew rate and gradient amplitudes (Fig.1).
Results
Fig.1A. shows that strong gradients can achieve shorter TE for a given b-value, for acquisition protocols targeted to prostate imaging: an EPI readout and spiral readout to further shortenTE. The chosen b-value range is of interest for application in prostate cancer MRI; high b-values above 3 ms/μm2 can be advantageous to characterise restrictions18-20.The effect of processing is shown in Fig.2. The gradient nonlinearities associated with ultra-strong gradients caused geometric distortions mostly visible at the edge of the image. The estimated effective b-values inside the prostate deviated from the imposed ones by maximally 3%, but careful positioning is crucial as a -10mm shift (2 slices) along the Z-axis would cause 10% deviation.
Fig.3 highlights the gain in SNR: The mean of the tSNR histogram shifts from 9.35 for an 80 mT/m system to 11.14 for a 300 mT/m system. The squared ratio is 1.42 i.e., to obtain the same tSNR with an 80 mT/m scanner, ∼6 additional repetitions would have to be acquired.
Fig. 4 shows a comparison of diffusion-weighted images obtained with both protocols.From the normalized difference of the signals (A, bottom row), we found that the largest relative gain in signal acquired with shorter TE is in the regime of intermediate b-values (1-2ms/μm2). The median signal value within the prostate mask is shown in Fig.4B (left).Interestingly, in the transitional posterior zone (highlighted by the orange square, Fig.4B, right), the signals acquired with protocols using 80 mT/m and 300 mT/m gradients show the largest difference in the b-value range 1-2 ms/μm2.
To more specifically explore the benefits of ultra-strong gradients in the context of microstructural imaging in healthy and cancerous prostate, Fig.5 shows simulated signals for SNR= 50 of a three pool model17 of stroma, epithelium and lumen with different T2-D properties.Pushing down the TE at a given b-value, in case of benign tissue (Fig.5), significantly increases the signal contribution from the short T2-pool (stroma) with intermediate diffusivity (1-2 μm2/ms). The increased signal in in vivo data (Fig.4B, right) may be attributed to this. For changes associated with cancerous tissue in which diffusion becomes more restricted (Fig.5B), higher b-values are beneficial for accurate characterisation and the shorter TE provided by strong gradients results in a significantly higher signal.
Discussion
This work showcases the feasibility of strong-gradient dMRI ’below-the-neck’, and highlights potential benefits for microstructural imaging of the prostrate. Firstly, shortening the TE (using EPI, and even further using spiral readouts21,22) can help to increase signal contributions from the short T2 compartment (stroma) in vivo17. Current biophysical models do not model this compartment separately, and the TEs achievable with 300 mT/m may enable this in the future. Secondly, high b-value data can give novel insights into cellular restrictions in tissue undergoing cancerous changes19,20. For instance, results achieved by modelling prostate cancer with VERDICT showed discriminating power of cancer grade 3+3 and 3+4 with higher specificity than ADC20. Thus, the characterisation of signal at higher b-values can potentially further improve risk stratification.Conclusions
This work is a first step towards unlocking promising applications of 300 mT/m gradient dMRI for the comprehensive characterization of the prostate gland in health and disease. This may translate to improved detection of prostate cancer and improved tumour characterisation.Acknowledgements
CMWT is supported by a Sir Henry Wellcome Fellowship (215944/Z/19/Z) and a Veni grant(17331) from the Dutch Research Council (NWO). This research was funded in whole, orin part, by a Wellcome Trust Investigator Award (096646/Z/11/Z) and a Wellcome TrustStrategic Award (104943/Z/14/Z). This work was also supported by an EPSRC equipment grant (EP/M029778/1) to DKJ. MM is supported by a Siemens Healthcare Limited grant. EP is supported by EPSRC grant nr. EP/N021967/1. MP is supported by UKRI Future LeadersFellowship (MR/T020296/1).References
1. Kawin Setsompop, R Kimmlingen, E Eberlein, Thomas Witzel, Julien Cohen-Adad, Jennifer A McNab, Boris Keil, M Dylan Tisdall, P Hoecht, P Dietz, et al. Pushing the limits of in vivo diffusion MRI for the human connectome project. Neuroimage, 80:220–233, 2013.
2. Ralph Kimmlingen. Pioneers of Connectome gradients. MAGNETOM Flash (68), 2:122–136,2017.
3. Thomas KF Foo, Ek Tsoon Tan, Mark E Vermilyea, Yihe Hua, Eric W Fiveland, Joseph E Piel, Keith Park, Justin Ricci, Paul S Thompson, Dominic Graziani, et al. Highly efficient head-only magnetic field insert gradient coil for achieving simultaneous high gradient amplitude and slew rate at 3.0 t (magnus) for brain microstructure imaging. Magnetic resonance in medicine, 83(6):2356–2369, 2020.
4. Markus Weiger, Johan Overweg, Manuela Barbara Rösler, Romain Froidevaux, Franciszek Hennel, Bertram Jakob Wilm, Alexander Penn, Urs Sturzenegger, Wout Schuth, Menno Mathlener, et al. A high-performance gradient insert for rapid and short-T2 imaging at full duty cycle. Magnetic resonance in medicine, 79(6):3256–3266, 2018.
5. Edwin Versteeg, Tijl A van der Velden, Carel C van Leeuwen, Martino Borgo, Erik RHuijing, Arjan D Hendriks, Jeroen Hendrikse, Dennis WJ Klomp, and Jeroen CW Siero. A plug-and-play, lightweight, single-axis gradient insert design for increasing spatiotemporal resolution in echo planar imaging-based brain imaging. NMR in Biomedicine, 34(6):e4499,2021.
6. Andrew G Webb. Magnetic resonance technology: hardware and system component design. Royal Society of Chemistry, 2016.
7. Jennifer A McNab, Brian L Edlow, Thomas Witzel, Susie Y Huang, Himanshu Bhat,Keith Heberlein, Thorsten Feiweier, Kecheng Liu, Boris Keil, Julien Cohen-Adad, et al. The human connectome project and beyond: initial applications of 300 mT/m gradients. Neuroimage, 80:234–245, 2013.
8. Derek K Jones, Daniel C Alexander, Richard Bowtell, Mara Cercignani, Flavio Dell’Acqua, Damien J McHugh, Karla L Miller, Marco Palombo, Geoffrey JM Parker, US Rudrapatna, et al. Microstructural imaging of the human brain with a ‘super-scanner’: 10 key advantages of ultra-strong gradients for diffusion MRI. NeuroImage, 182:8–38, 2018.
9. Chantal MW Tax, Filip Szczepankiewicz, Markus Nilsson, and Derek K Jones. The dot-compartment revealed? Diffusion MRI with ultra-strong gradients and spherical tensor encoding in the living human brain. NeuroImage, 210:116534, 2020.
10. Markus Nilsson, Samo Lasič, Ivana Drobnjak, Daniel Topgaard, and Carl-Fredrik Westin. Resolution limit of cylinder diameter estimation by diffusion MRI: The impact of gradient waveform and orientation dispersion.NMR in Biomedicine, 30(7):e3711, 2017.
11. Lucilio Cordero-Grande, Daan Christiaens, Jana Hutter, Anthony N Price, and Jo V Hajnal. Complex diffusion-weighted image estimation via matrix recovery under general noise models. Neuroimage, 200:391–404, 2019.
12. Elias Kellner, Bibek Dhital, Valerij G Kiselev, and Marco Reisert. Gibbs-ringing artifact removal based on local subvoxel-shifts. Magnetic resonance in medicine, 76(5):1574–1581,2016.
13. Jesper LR Andersson, Stefan Skare, and John Ashburner. How to correct susceptibility distortions in spin-echo echo-planar images: application to diffusion tensor imaging. Neuroimage, 20(2):870–888, 2003.
14. Jorge Jovicich, Silvester Czanner, Douglas Greve, Elizabeth Haley, Andre van Der Kouwe,Randy Gollub, David Kennedy, Franz Schmitt, Gregory Brown, James MacFall, et al. Reliability in multi-site structural MRI studies: effects of gradient non-linearity correction on phantom and human data. Neuroimage, 30(2):436–443, 2006.
15. Roland Bammer, M Markl, A Barnett, B Acar, MT Alley, NJ Pelc, GH Glover, and ME Moseley. Analysis and generalized correction of the effect of spatial gradient field istortions in diffusion-weighted imaging. Magnetic Resonance in Medicine: An Official Journal of the International Society for Magnetic Resonance in Medicine, 50(3):560–569,2003.
16. Umesh Rudrapatna, Greg D Parker, Jamie Roberts, and Derek K Jones. A comparative study of gradient nonlinearity correction strategies for processing diffusion data obtained with ultra-strong gradient MRI scanners. Magnetic resonance in medicine, 85(2):1104–1113,2021.
17. Zhaohuan Zhang, Holden H Wu, Alan Priester, Clara Magyar, Sohrab Afshari Mirak, Sepideh Shakeri, Amirhossein Mohammadian Bajgiran, Melina Hosseiny, Afshin Azadikhah, Kyunghyun Sung, et al. Prostate microstructure in prostate cancer using 3-T MRI with diffusion-relaxation correlation spectrum imaging: validation with whole-mount digital histopathology. Radiology, 296(2):348–355, 2020.
18. Lei Tang and Xiaohong Joe Zhou. Diffusion MRI of cancer: From low to high b-values. Journal of Magnetic Resonance Imaging, 49(1):23–40, 2019.
19. Eleftheria Panagiotaki, Rachel W Chan, Nikolaos Dikaios, Hashim U Ahmed, JamesO’Callaghan, Alex Freeman, David Atkinson, Shonit Punwani, David J Hawkes, and Daniel C Alexander. Microstructural characterization of normal and malignant human prostate tissue with vascular, extracellular, and restricted diffusion for cytometry in tumours magnetic resonance imaging. Investigative radiology, 50(4):218–227, 2015.
20. Edward W Johnston, Elisenda Bonet-Carne, Uran Ferizi, Ben Yvernault, Hayley Pye,Dominic Patel, Joey Clemente, Wivijin Piga, Susan Heavey, Harbir S Sidhu, et al. VERDICT MRI for prostate cancer: intracellular volume fraction versus apparent diffusion coefficient. Radiology, 291(2):391–397, 2019.
21. Bertram Jakob Wilm, Franciszek Hennel, Manuela Barbara Roesler, Markus Weiger, andKlaas Paul Pruessmann. Minimizing the echo time in diffusion imaging using spiral readouts and a head gradient system. Magnetic Resonance in Medicine, 84(6):3117–3127, 2020.
22. Lars Mueller, Maryam Afzali, Malwina Molendowska, Chantal M.W. Tax, Elena Kleban, Fabrizio Fasano, Suryanarayana Umesh Rudrapatna, and Derek K Jones. Boosting the SNR-efficiency of free gradient waveform diffusion MRI using spiral readouts and ultra-strong gradients. Society Mag. Res. Medicine, Proceedings of the 29th Annual Meeting. Paris: Soc Mag Res in Medicine, 2021.
Figures