0221
Mapping of Metabolite Profile of Urine of Patients with Chronic Prostatitis, Prostate Cancer and Healthy Controls: A Pilot NMR Metabolomic Study
Naranamangalam R Jagannathan1,2,3, R Ravikanth Reddy1, Arun Kumar Shirshetty4, Samsudeen Marwan5, Deepak Masanam4, and Ananathakrishanan Sivaraman5
1Dept. of Radiology, Chettinad Hospital & Research Institute, Kelambakkam, India, 2Dept. of Electrical Engineering, Indian Institute of Technology, Chennai, India, 3Radiology, Sri Ramachandra Inst. of Higher Education and Research, Chennai, India, 4Dept. of Urology, Chettinad Hospital & Research Institute, Kelambakkam, India, 5Chennai Urology and Robotics Institute Hospital, Chennai, India
1Dept. of Radiology, Chettinad Hospital & Research Institute, Kelambakkam, India, 2Dept. of Electrical Engineering, Indian Institute of Technology, Chennai, India, 3Radiology, Sri Ramachandra Inst. of Higher Education and Research, Chennai, India, 4Dept. of Urology, Chettinad Hospital & Research Institute, Kelambakkam, India, 5Chennai Urology and Robotics Institute Hospital, Chennai, India
Synopsis
The present study aims to evaluate a comprehensive metabolic profiling of patients with chronic prostatitis (PT) by investigating their urine samples and compare it with the prostate cancer (PCa) patients and healthy controls (HC) using 1H nuclear magnetic resonance (NMR) metabolomics. The metabolic profile of chronic prostatitis patients falls between that seen for PCa and HC. This pilot study showed that NMR metabolomics may be useful to differentiate patients with PT from PCa and HC.
Purpose:
To compare the levels of metabolites in the urine
samples of chronic prostatitis patients with that of PCa and HC by using 1H
NMR spectroscopy.
Introduction:
Prostate cancer (PCa) is the second most
common malignancy in men older than 50 years and it is fifth cause of mortality
among the elderly men worldwide. Diagnosis of PCa is challenging due to limitation
in both the sensitivity and the specificity using conventional methods like digital
rectum examination (DRE), prostate specific antigen (PSA) test and trans-rectal
ultrasound (TRUS). Further, it is difficult to differentiate PCa from chronic prostatitis (PT), as PSA shows an increase in both the
cases. In this direction, NMR metabolomic provides both the identification and
the quantification of metabolites and their concentration and thus may help identification
of biomarkers in a non-invasive way with high specificity. This study aims to
investigate the NMR metabolomics of urine samples of PT patients and compare it
with patients suffering from PCa and HC.
Methods: Pre-prandial urine samples of normal volunteer (HC; n=12; Age = 30.5 ± 2.72 yrs), patients with chronic prostatitis (PT; n=17; Age = 64 ± 11 yrs; PSA= 6.57 ± 3.81 ng/mL) and PCa (n=20; Age = 69.68 ± 9.6 yrs; PSA= 29.58 ± 31.86 ng/mL) were collected in a sterile vial followed by immediate freezing below -20˚C. The 1H NMR experiments of urine samples was carried out at 400 MHz (Bruker, Switzerland) by using solvent suppression sequence namely exciting sculpting. Typical 1D 1H NMR acquisition parameters used were: spectral width 16 ppm, relaxation delay 5 s, number of transients 128 with 32K data points at 25 ̊C. Two-dimensional (2D) total correlation spectroscopy (TOCSY) was carried out with the following parameters: data points = 2K, spectral width = 11 ppm, relaxation delay = 1 s, 256 number of experiments (time-domain points) in t1 dimension using a number of scans = 16 with an 90 ms mixing time. NMR spectra were processed by using Topspin and Amix software. For referencing the chemical shifts, 5 mM of trimethylsilyl propanoic acid (TSP) was added. Statistical analysis was performed by using Metaboanalyst (v3.0). Principal component analysis (PCA), multivariate (partial least squares–discriminant analysis (PLS-DA) and Orthogonal projections to latent structures–discriminant analysis (OPLS-DA) were employed for analysis of urine samples of PCa patients, PT and HC for better discrimination. Institute ethics committee approved the study and informed consent was obtained from all individuals.
Results: Figure 1 shows the stack plot of the aliphatic region of 1H NMR spectra of urine samples from (A) PCa, (B) PT, and (C) HC. Assignment of metabolites was carried out by using 1D and 2D NMR experiments and also based on previous literature data and databases. A total of 12 metabolites were uniquely identified in PCa, 13 metabolites in PT and in HC. The following metabolites isoleucine, leucine, valine, lactate, alanine, glutamine, glycine, hippurate, citrate, dimethyl amine, dimethylglycine, and creatine were common in all the three categories of subjects studied, while in 7/17 PT patients who were on acetaminophen treatment showed resonances due to acetaminophen and its derivatives. Figure 2 shows (A) OPLS-DA model-based discriminatory analysis that shows distinction between three groups and (B) the VIP score.
Discussion: The key observation is the significantly reduced concentration of citrate and creatine in PCa compared to patients with chronic prostatitis (PT) and HC that are closely linked to the biochemical changes associated with the zinc levels1-3. The urine metabolites such as creatine, glycine and urea have high VIP score facilitating differentiation of PCa from PT and HC. PLS-DA score plot indicated the separation between PCa from prostatitis and HC. Conclusions: This pilot study showed that it is possible to use NMR metabolomics for differentiating HC and patients with PCa from chronic prostatitis (PT) patients.
Conclusion: This pilot study showed that it is possible to use NMR metabolomics for differentiating HC and patients with PCa from chronic prostatitis (PT) patients.
Acknowledgements
NRJ acknowledge the Science and Engineering Research Board, Department of Science and Technology, Government of India for the award of J. C. Bose Fellowship. We also acknowledge the use of 400 MHz NMR facility available at the CSIR- Central Leather Research Institute, Chennai.References
(1). Pérez RC, Puchades CL, García FM et al. Metabolomics. 2017;13:52; (2). Struck-Lewicka W, Kordalewska M, Bujak R et al. J Pharm Biomed Anal. 2015;111:351-361; (3) Dereziński P, Klupczynska A, Sawicki W et al. Int J Med Sci. 2017;14:1-122.Figures
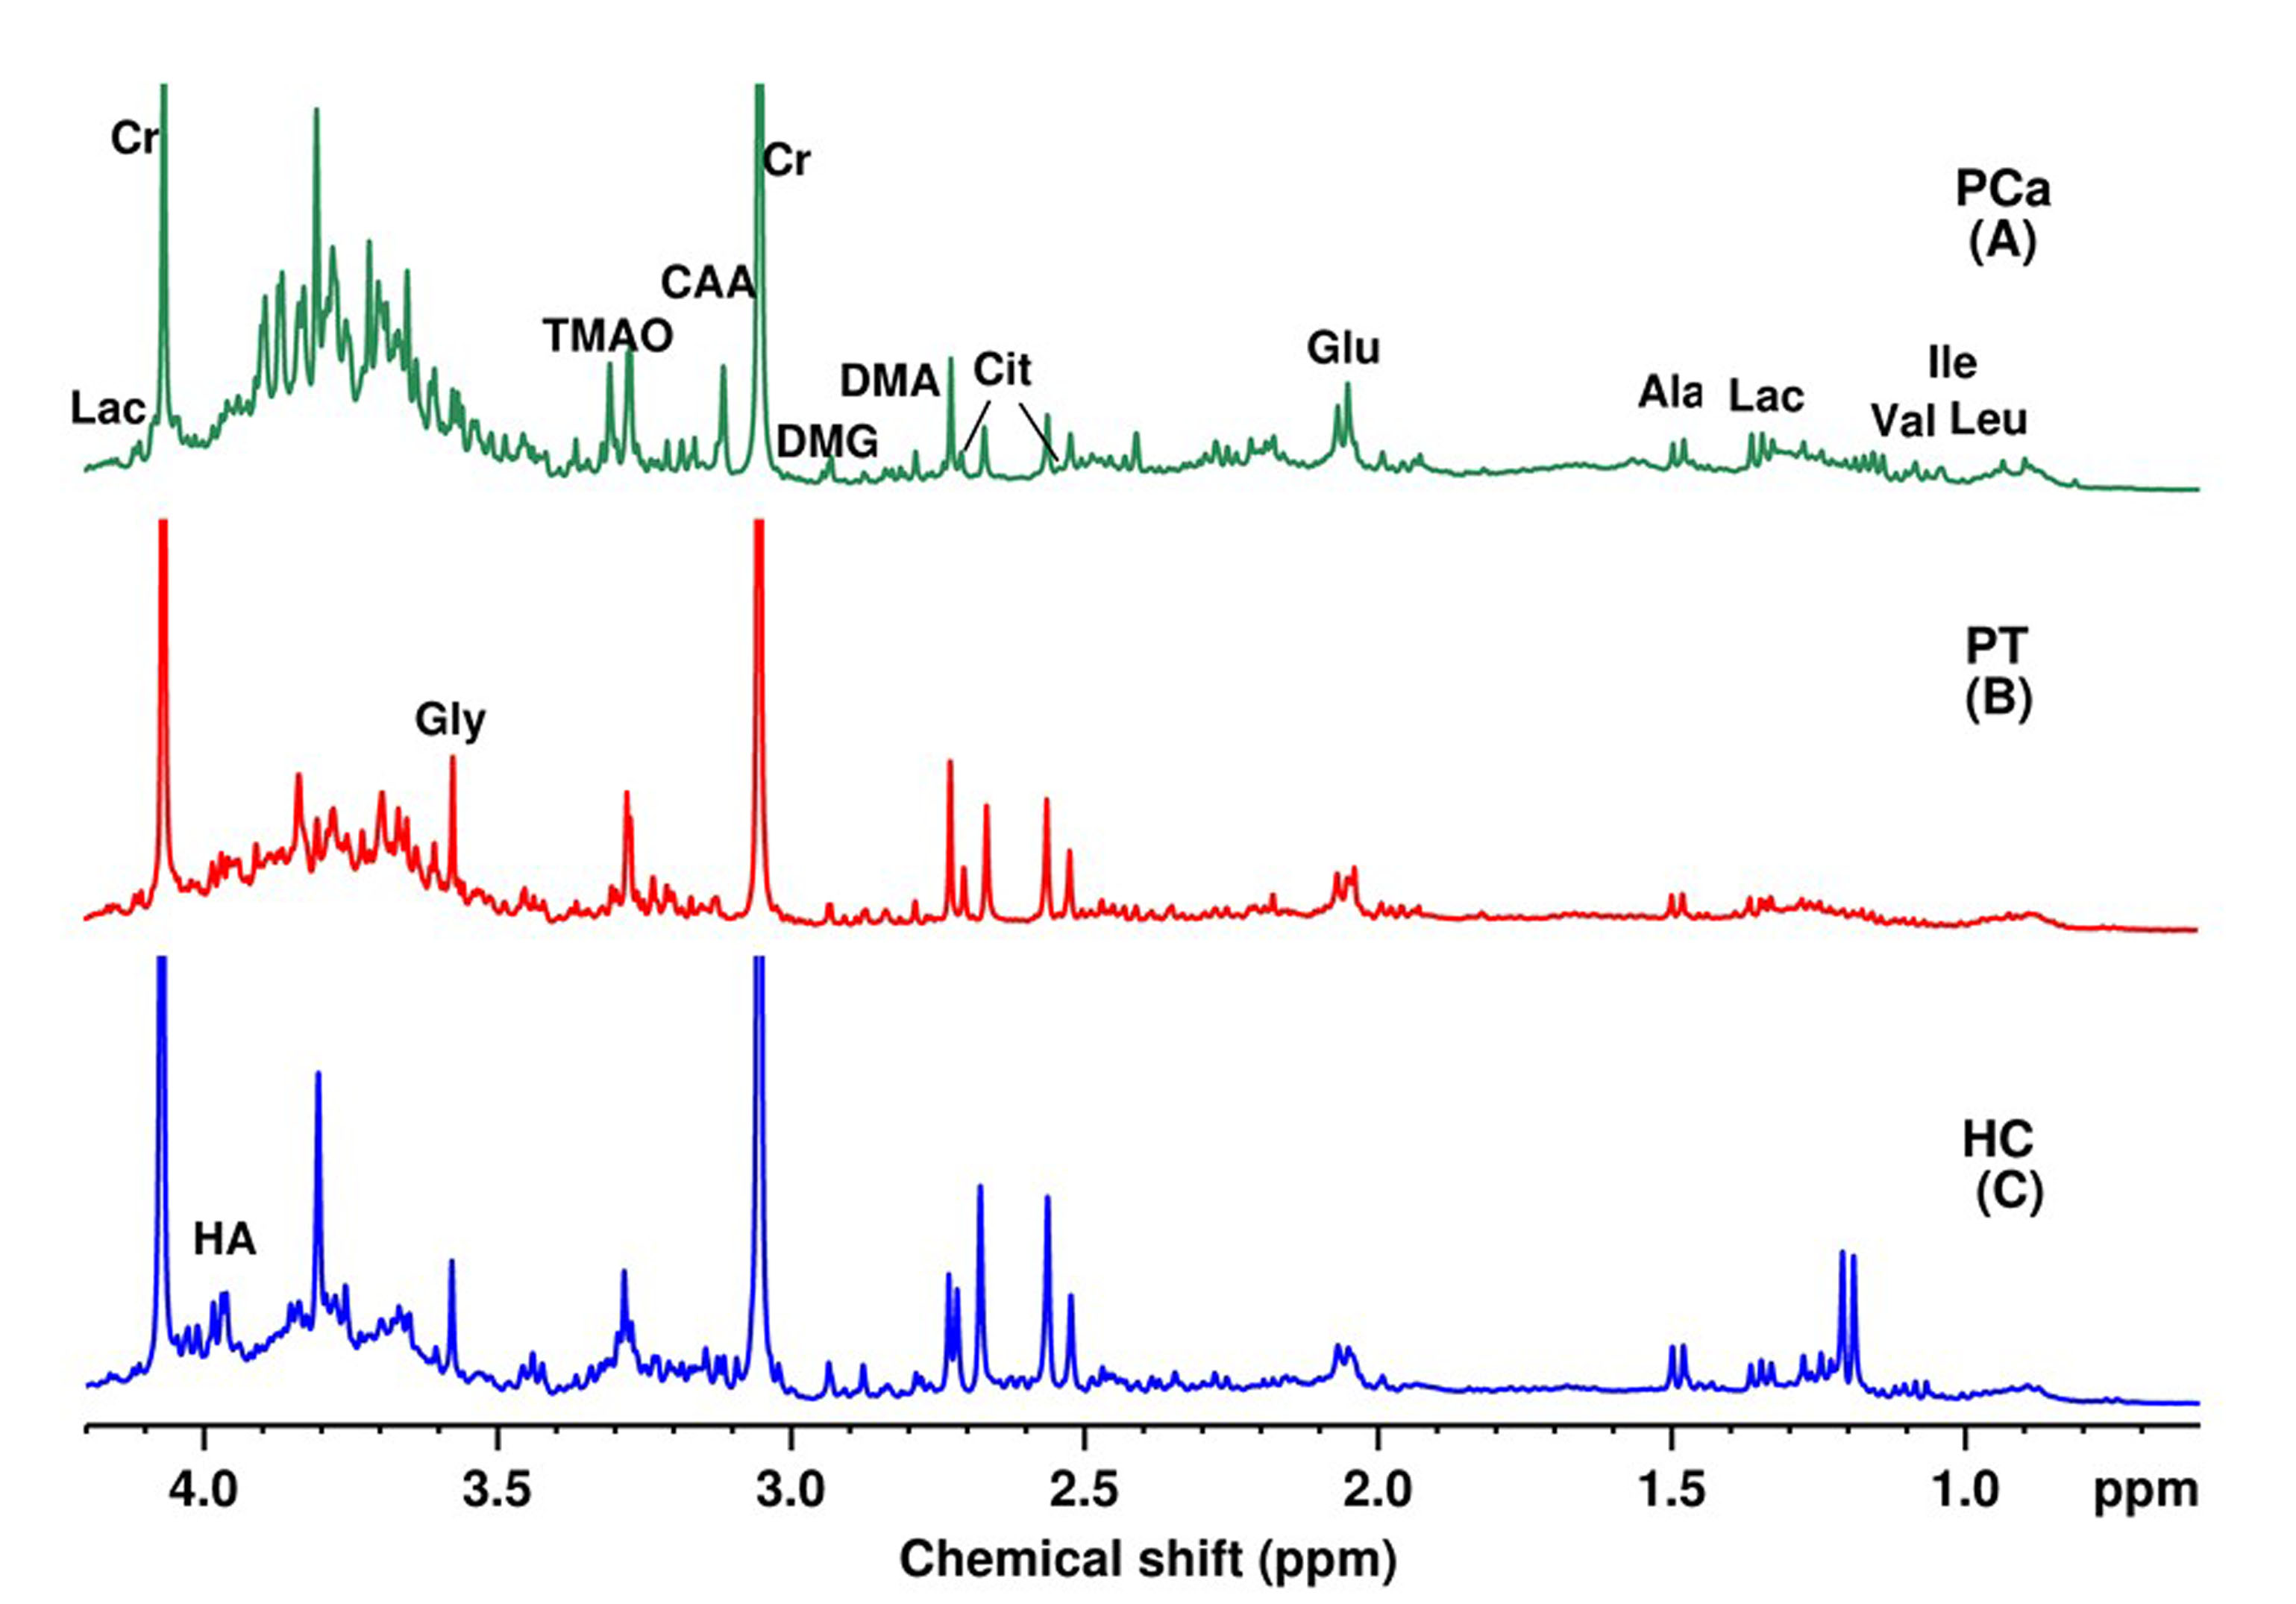
Figure 1. Aliphatic region of 1H
NMR spectra of urine acquired at 400 MHz from: (A) cancer, (B) Prostatitis (PT),
and (C) control. Assignment of metabolites: Ile: Isoleucine, Leu: Leucine, Val: Valine, Lac:
Lactate, Ala: Alanine, Glu: Glutamine, Cit: Citrate, DMA: dimethyl amine, DMG: Dimethylglycine,
Cr: Creatine, CAA: Cis-aconitic acid, TMAO:Trimethylamine-N-oxide Gly: Glycine;
HA: Hippuric acid.
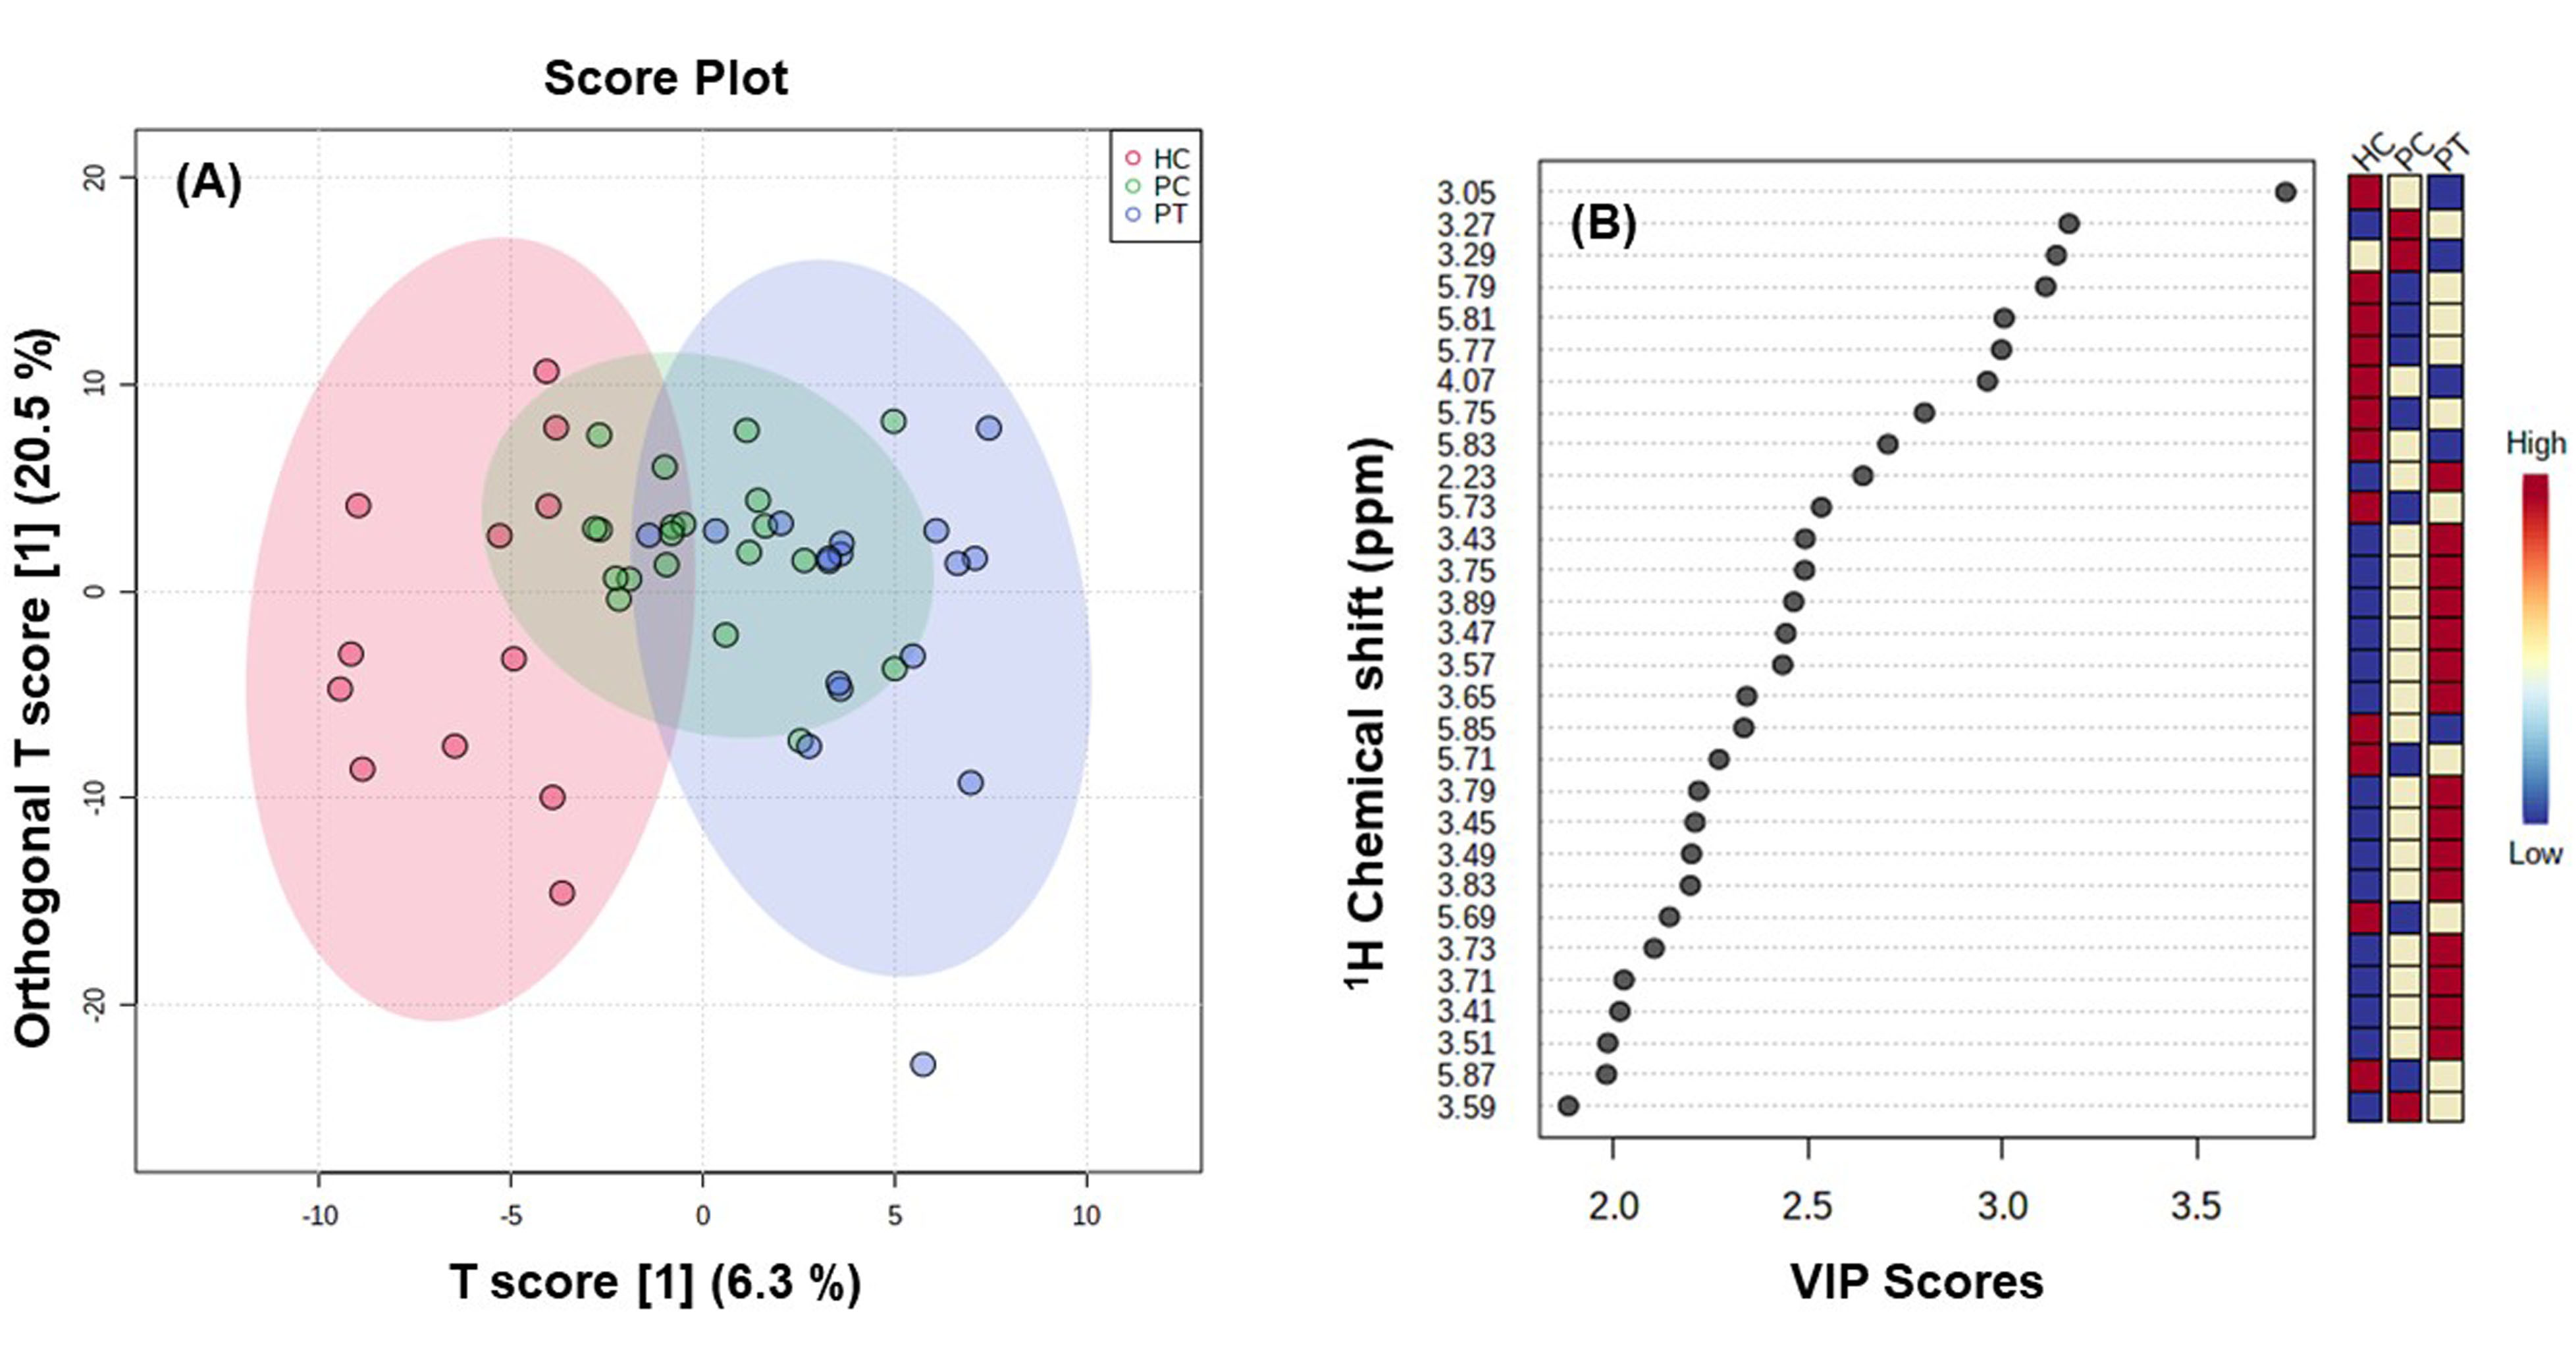
Figure 2. 2D (A) PLS-DA showing notable separation
between PCa patients (green), PT (blue) patients and HC (red). (B) VIP score
plot obtained for 1st component of PLS-DA model.
DOI: https://doi.org/10.58530/2022/0221