0218
Synthesis of 4D Flow Tensor MRI of Patient-Specific Turbulent Flow1Institute for Biomedical Engineering, University and ETH Zürich, Zürich, Switzerland
Synopsis
We present a pipeline to synthesize patient-specific pulsatile turbulent 4D flow MRI datasets of the aorta. Aortic motion and inflow are extracted from in-vivo 2D cine and time-resolved 2D phase-contrast data. Computational fluid dynamics is used to obtain 4D velocity and turbulence fields to simulate MR signals using multipoint 4D flow tensor MRI protocols, which are reconstructed into velocity and turbulence maps with a Bayesian approach. As a result, realistic paired data of ground truth and their projection into MR images enable assessing accuracy and precision of encoding and inference, training of inference machines and, ultimately, deriving optimal experimental designs.
Introduction
4D flow MRI1 holds significant potential for assessing the hemodynamic burden of aortic stenosis in-vivo2,3,4. However, given the lack of ground truth, the intrinsic accuracy and precision of the method for any patient-specific configuration cannot be assessed and only approximate metrics can be derived using in-situ and in-vitro experiments2. Moreover, the training of inference machines to derive flow and turbulence metrics from in-vivo data is significantly compromised by the lack of paired ground truth and imaging data. The development of suitable neural network frameworks, which have shown potential for post-processing tasks, is limited by the scarce availability of annotated clinical datasets5. While previous work has demonstrated that synthetic 4D flow data can be used to augment clinical datasets6, turbulent conditions, which are a hallmark of aortic stenotic flow, have not been included so far.Here we propose a method to synthesize time-resolved patient-specific 4D flow tensor MRI data to enable the assessment of accuracy and precision of encoding and inference, training of inference machines and to ultimately derive optimal experimental designs of 4D flow MRI of mean and turbulent aortic flows in-vivo.
Methods
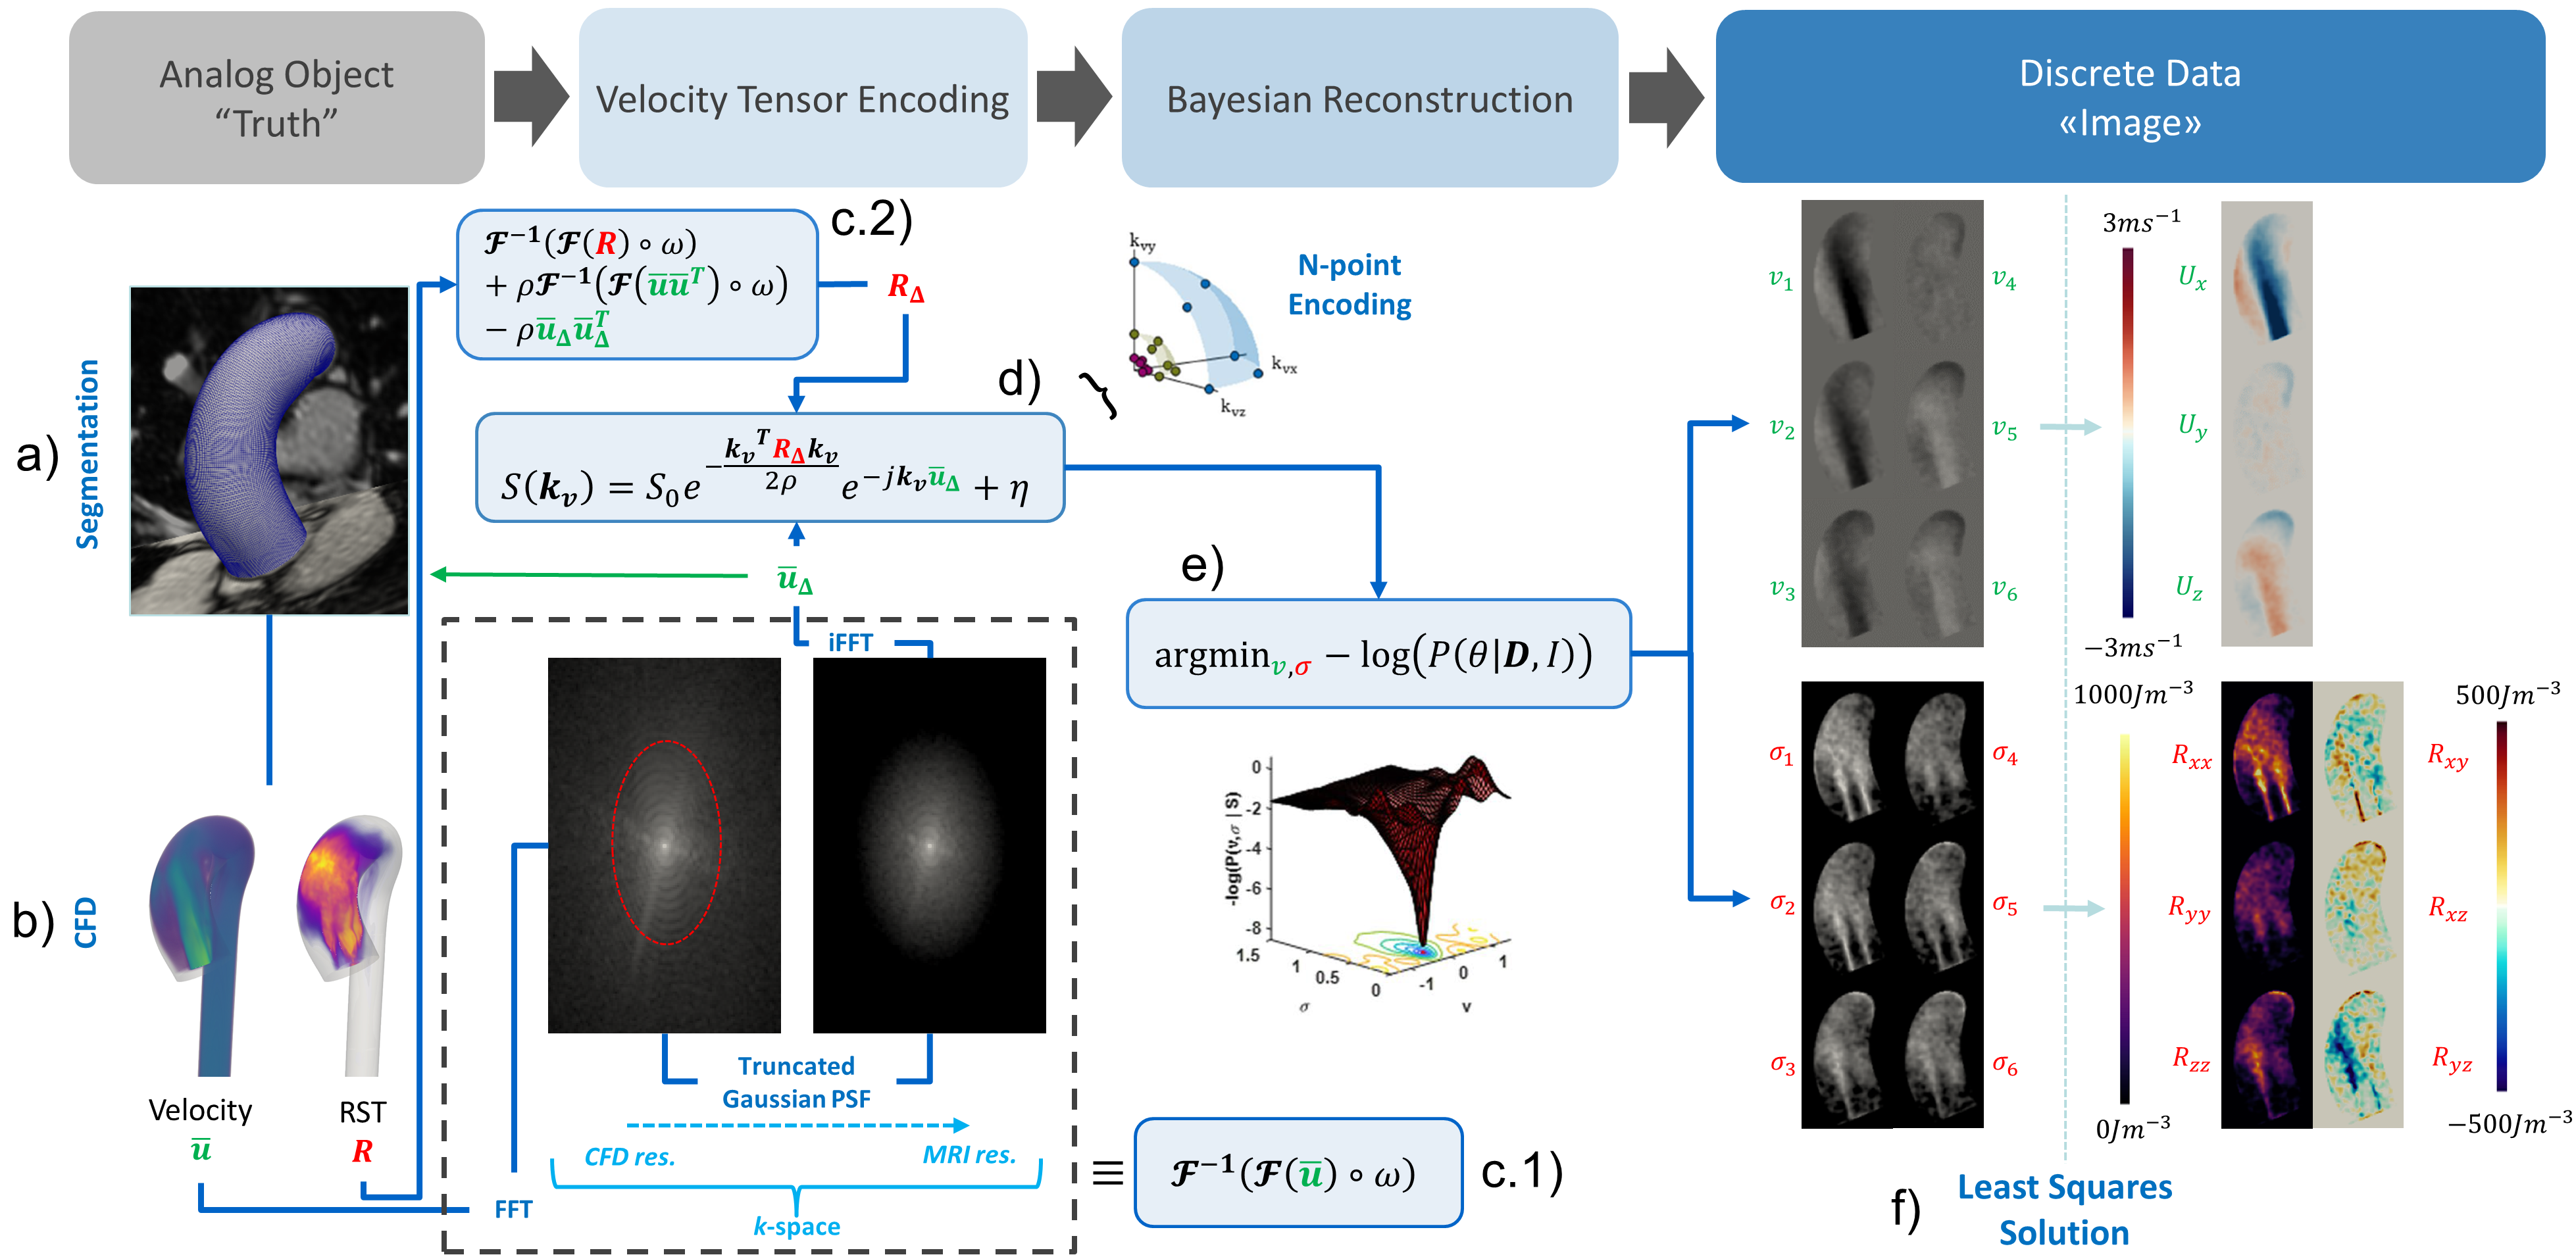
Cine 2D images of the ascending aorta were acquired using balanced SSFP protocols (1$$$\times$$$1$$$\times$$$5mm3) perpendicular to the aortic axis (Figure 1a), segmented using in-house Python code and subsequently used to construct volumetric meshes of the aortic lumen including deformations and displacements over the cardiac cycle. Time-resolved 2D velocity vector data were measured downstream of the aortic valve using phase-contrast (PC) spoiled gradient-echo protocols (1$$$\times$$$1$$$\times$$$8mm3). Different stenosis degrees were simulated by artificially reducing the inlet orifice area. Area reductions of 50%, 75% and 90% were modeled. All in-vivo measurements were performed in accordance to ethical and institutional guidelines on clinical MR systems and upon written informed consent of the subjects.Using the subject-specific aortic meshes and inflow boundary conditions, reference time-resolved velocity fields were obtained from solving the Navier-Stokes equations in OpenFoam® v1806 using a Large eddy simulation (LES) model with moving boundaries and a wall-adapting local-eddy viscosity (WALE) subgrid-scale turbulence model7 (Figure 1b). Time and phase averaging of instantaneous velocities was used to directly compute mean velocities and Reynolds stress tensors (RST) during the simulation (Figure 1b). Subsequently, the velocity and RST data were projected onto 3D Cartesian grids with 0.65mm isotropic voxels. Apodization in k-space with a truncated Gaussian transfer function was used to simulate bandwidth-limited encoding (Figure 1c.1 and 1c.2). The mean velocities and RST were utilized to synthesize multipoint tensor PC-MRI signals including complex-valued white Gaussian noise8 (Figure 1d). A 19-point acquisition was assumed and Bayesian reconstruction9 was used to combine signals acquired with different encoding strengths (Figure 1e). Finally, a least-squares approach was deployed to project the six reconstructed directional velocities and intra-voxel standard deviations (IVSD) onto a 3D Cartesian grid (Figure 1f).
Results
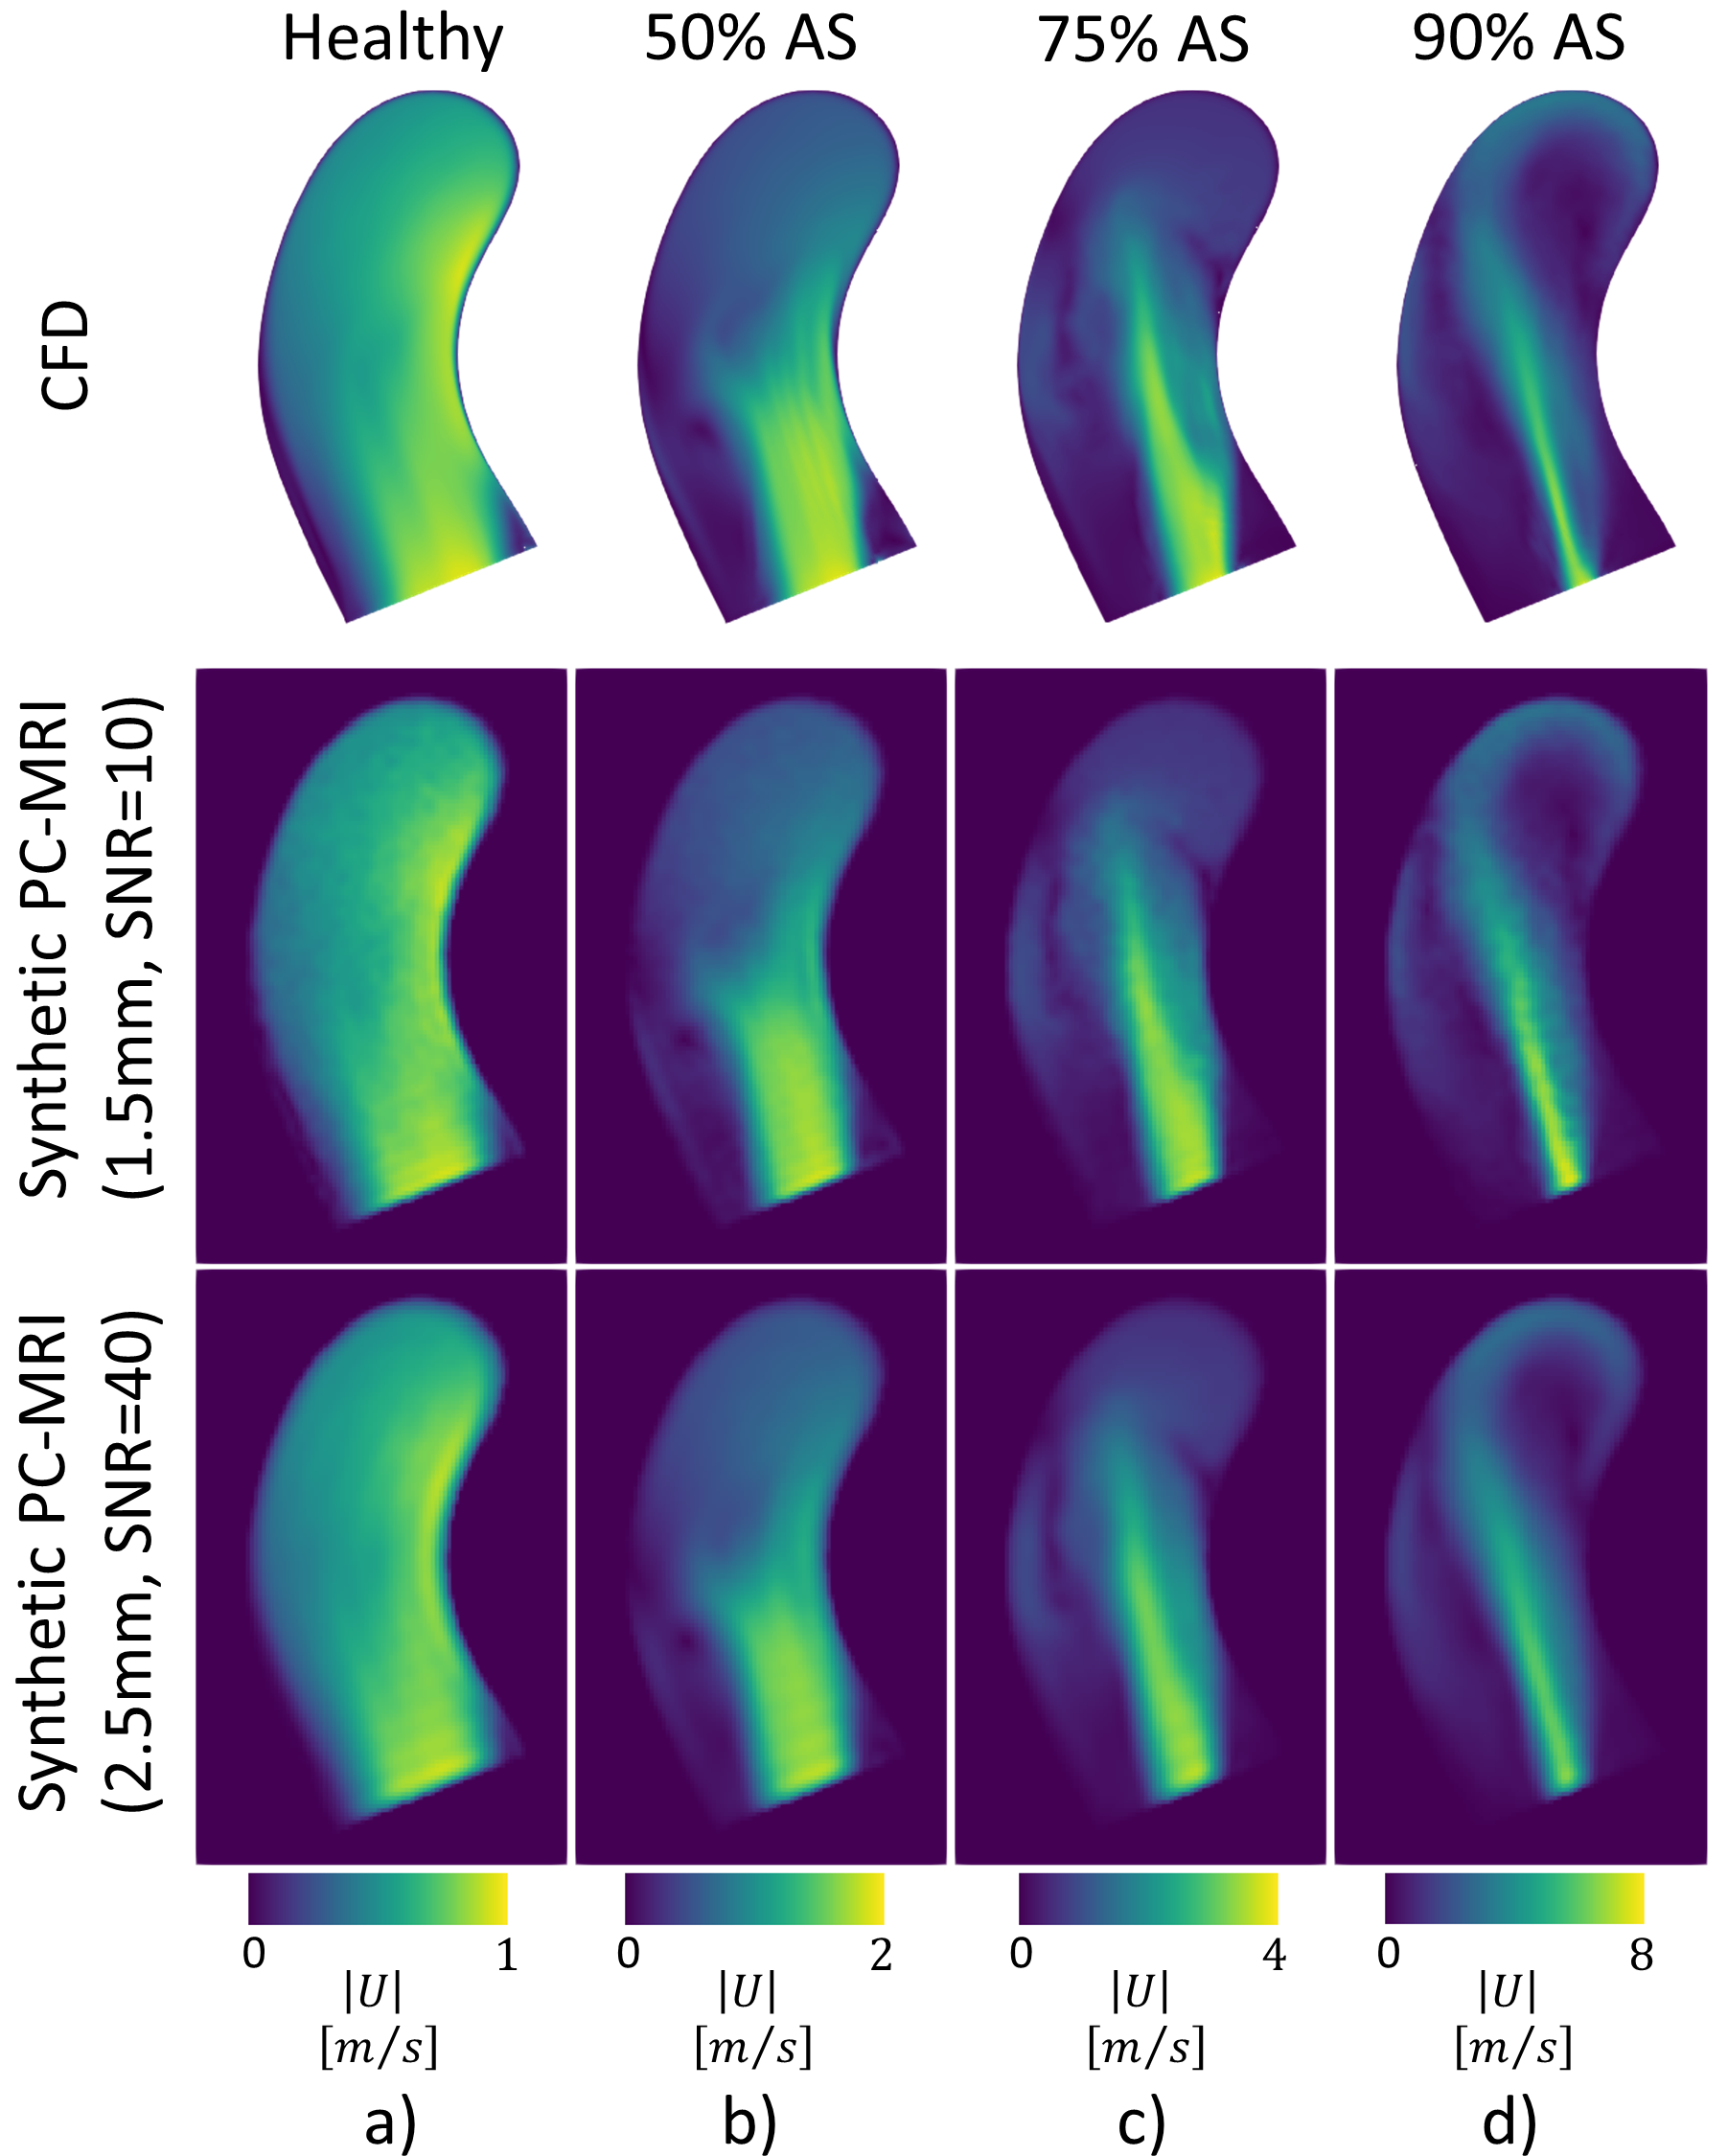
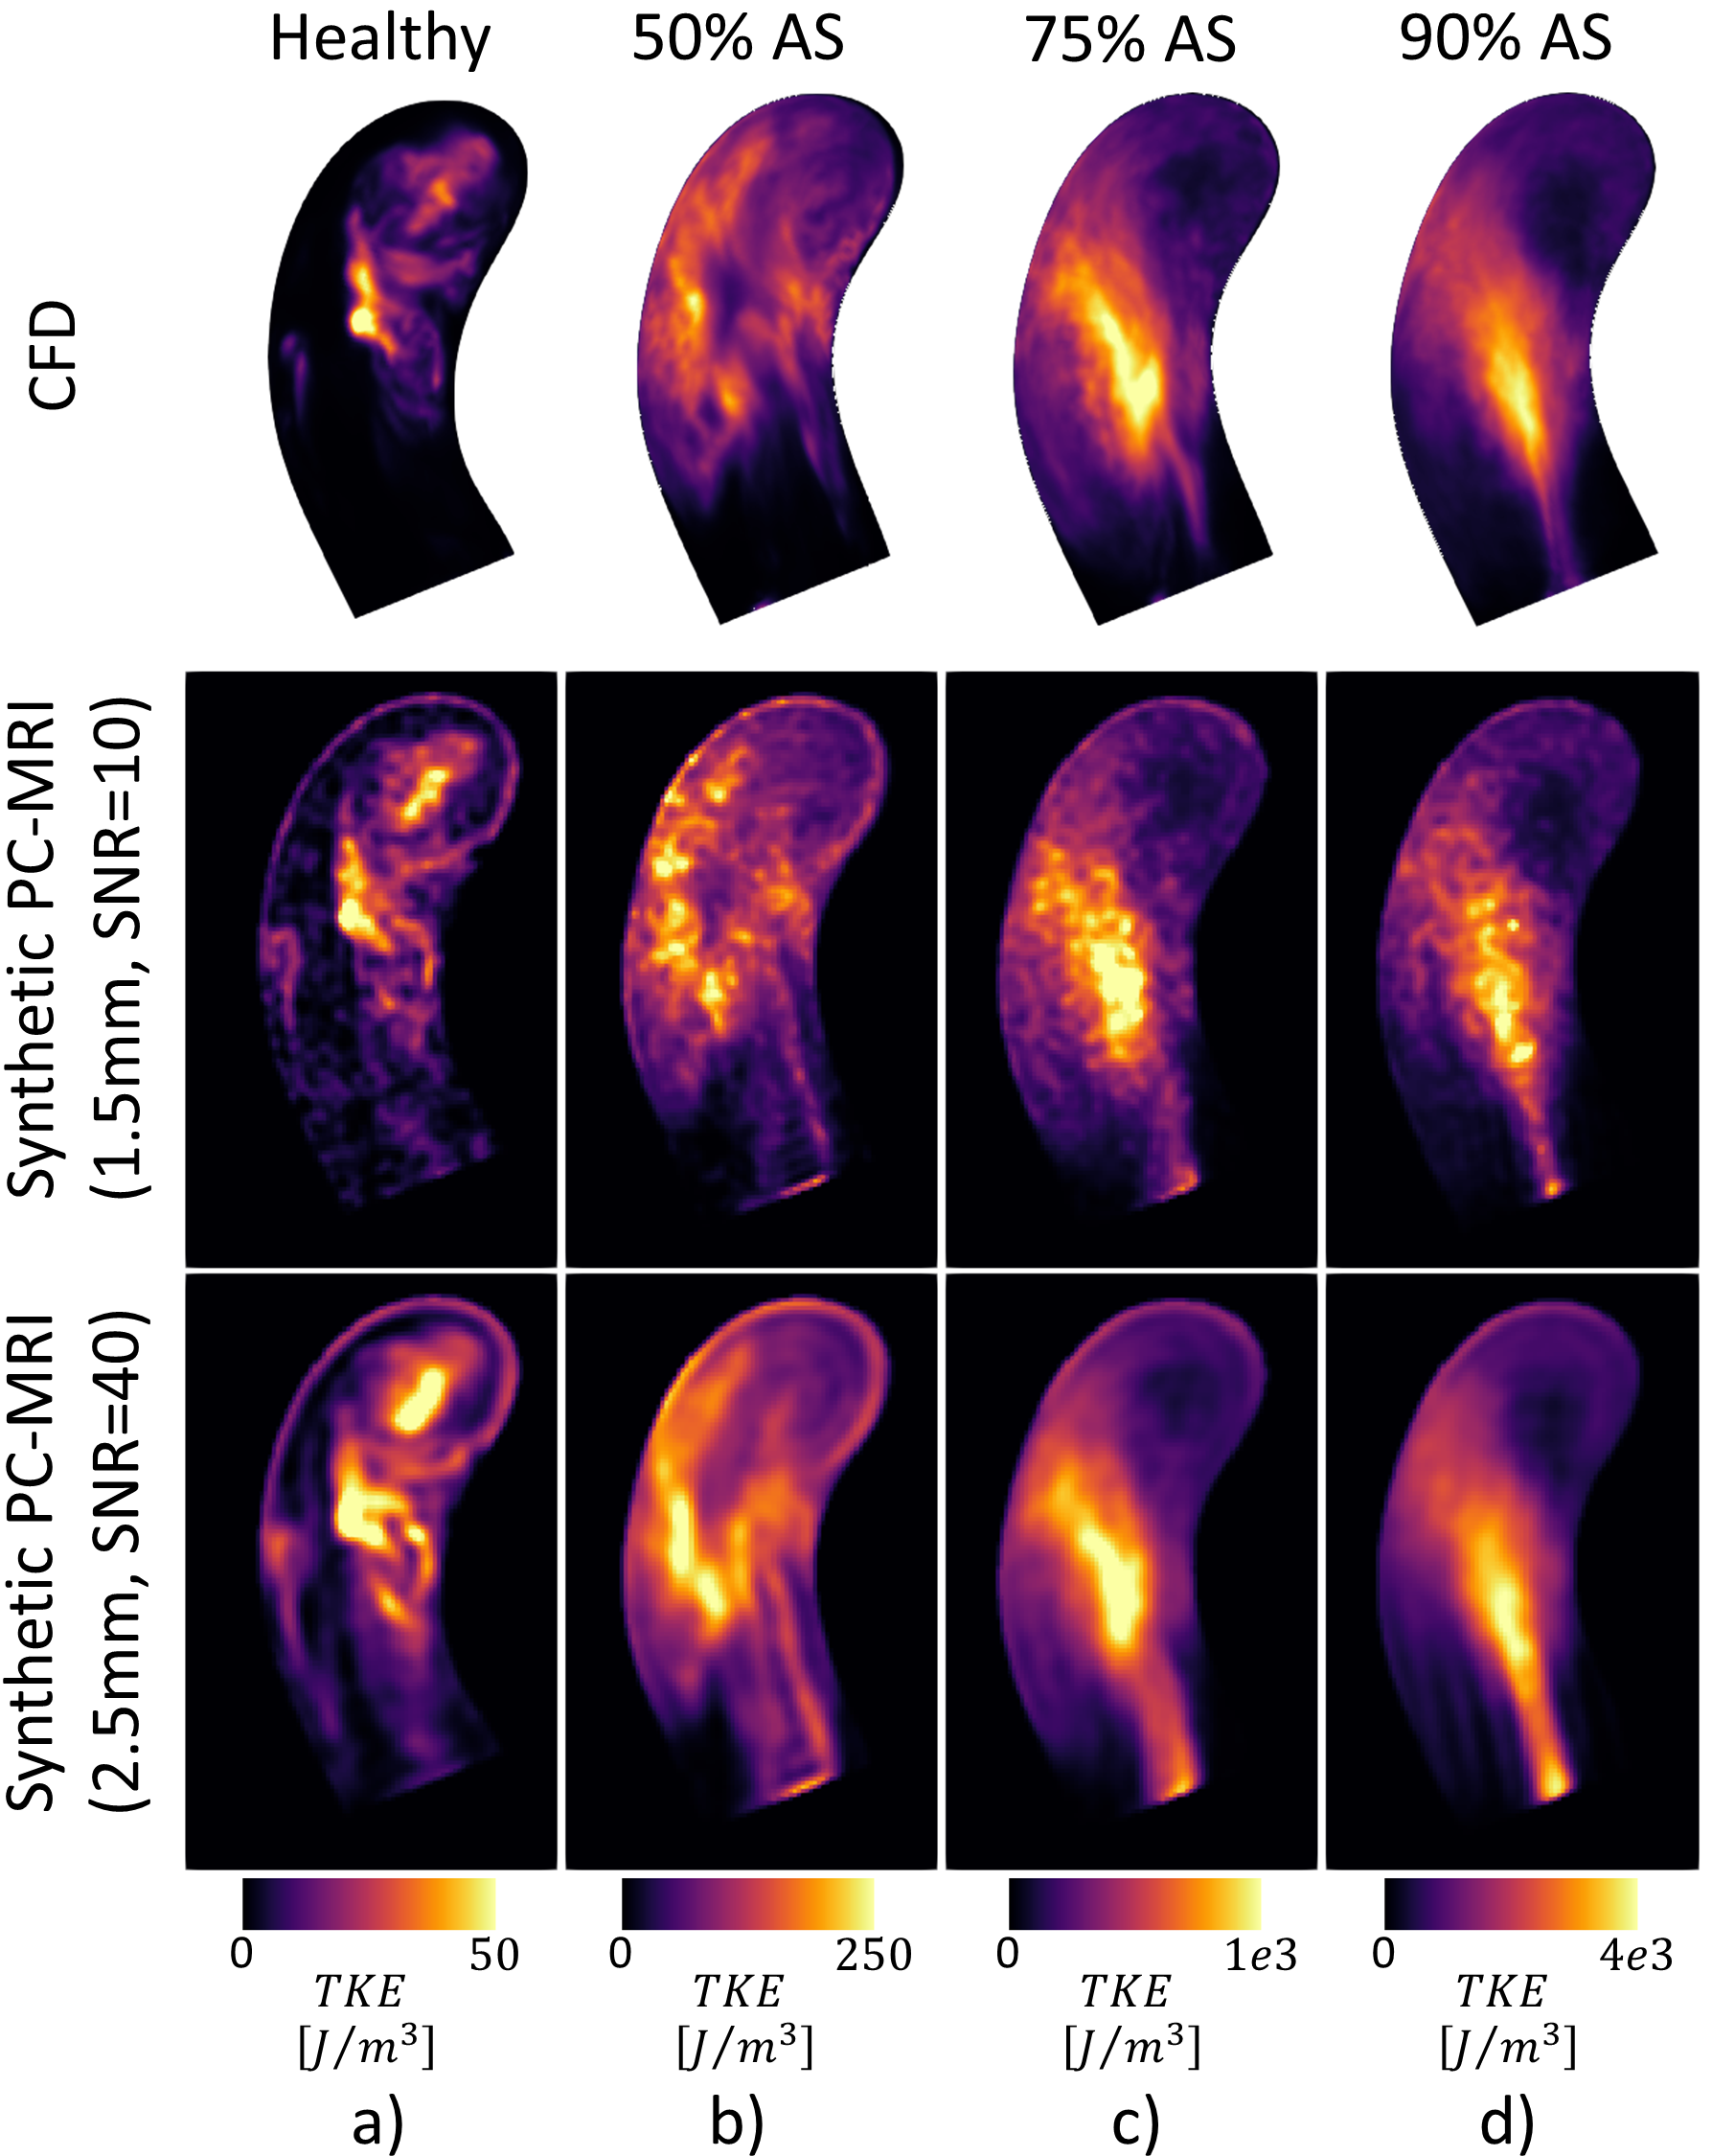
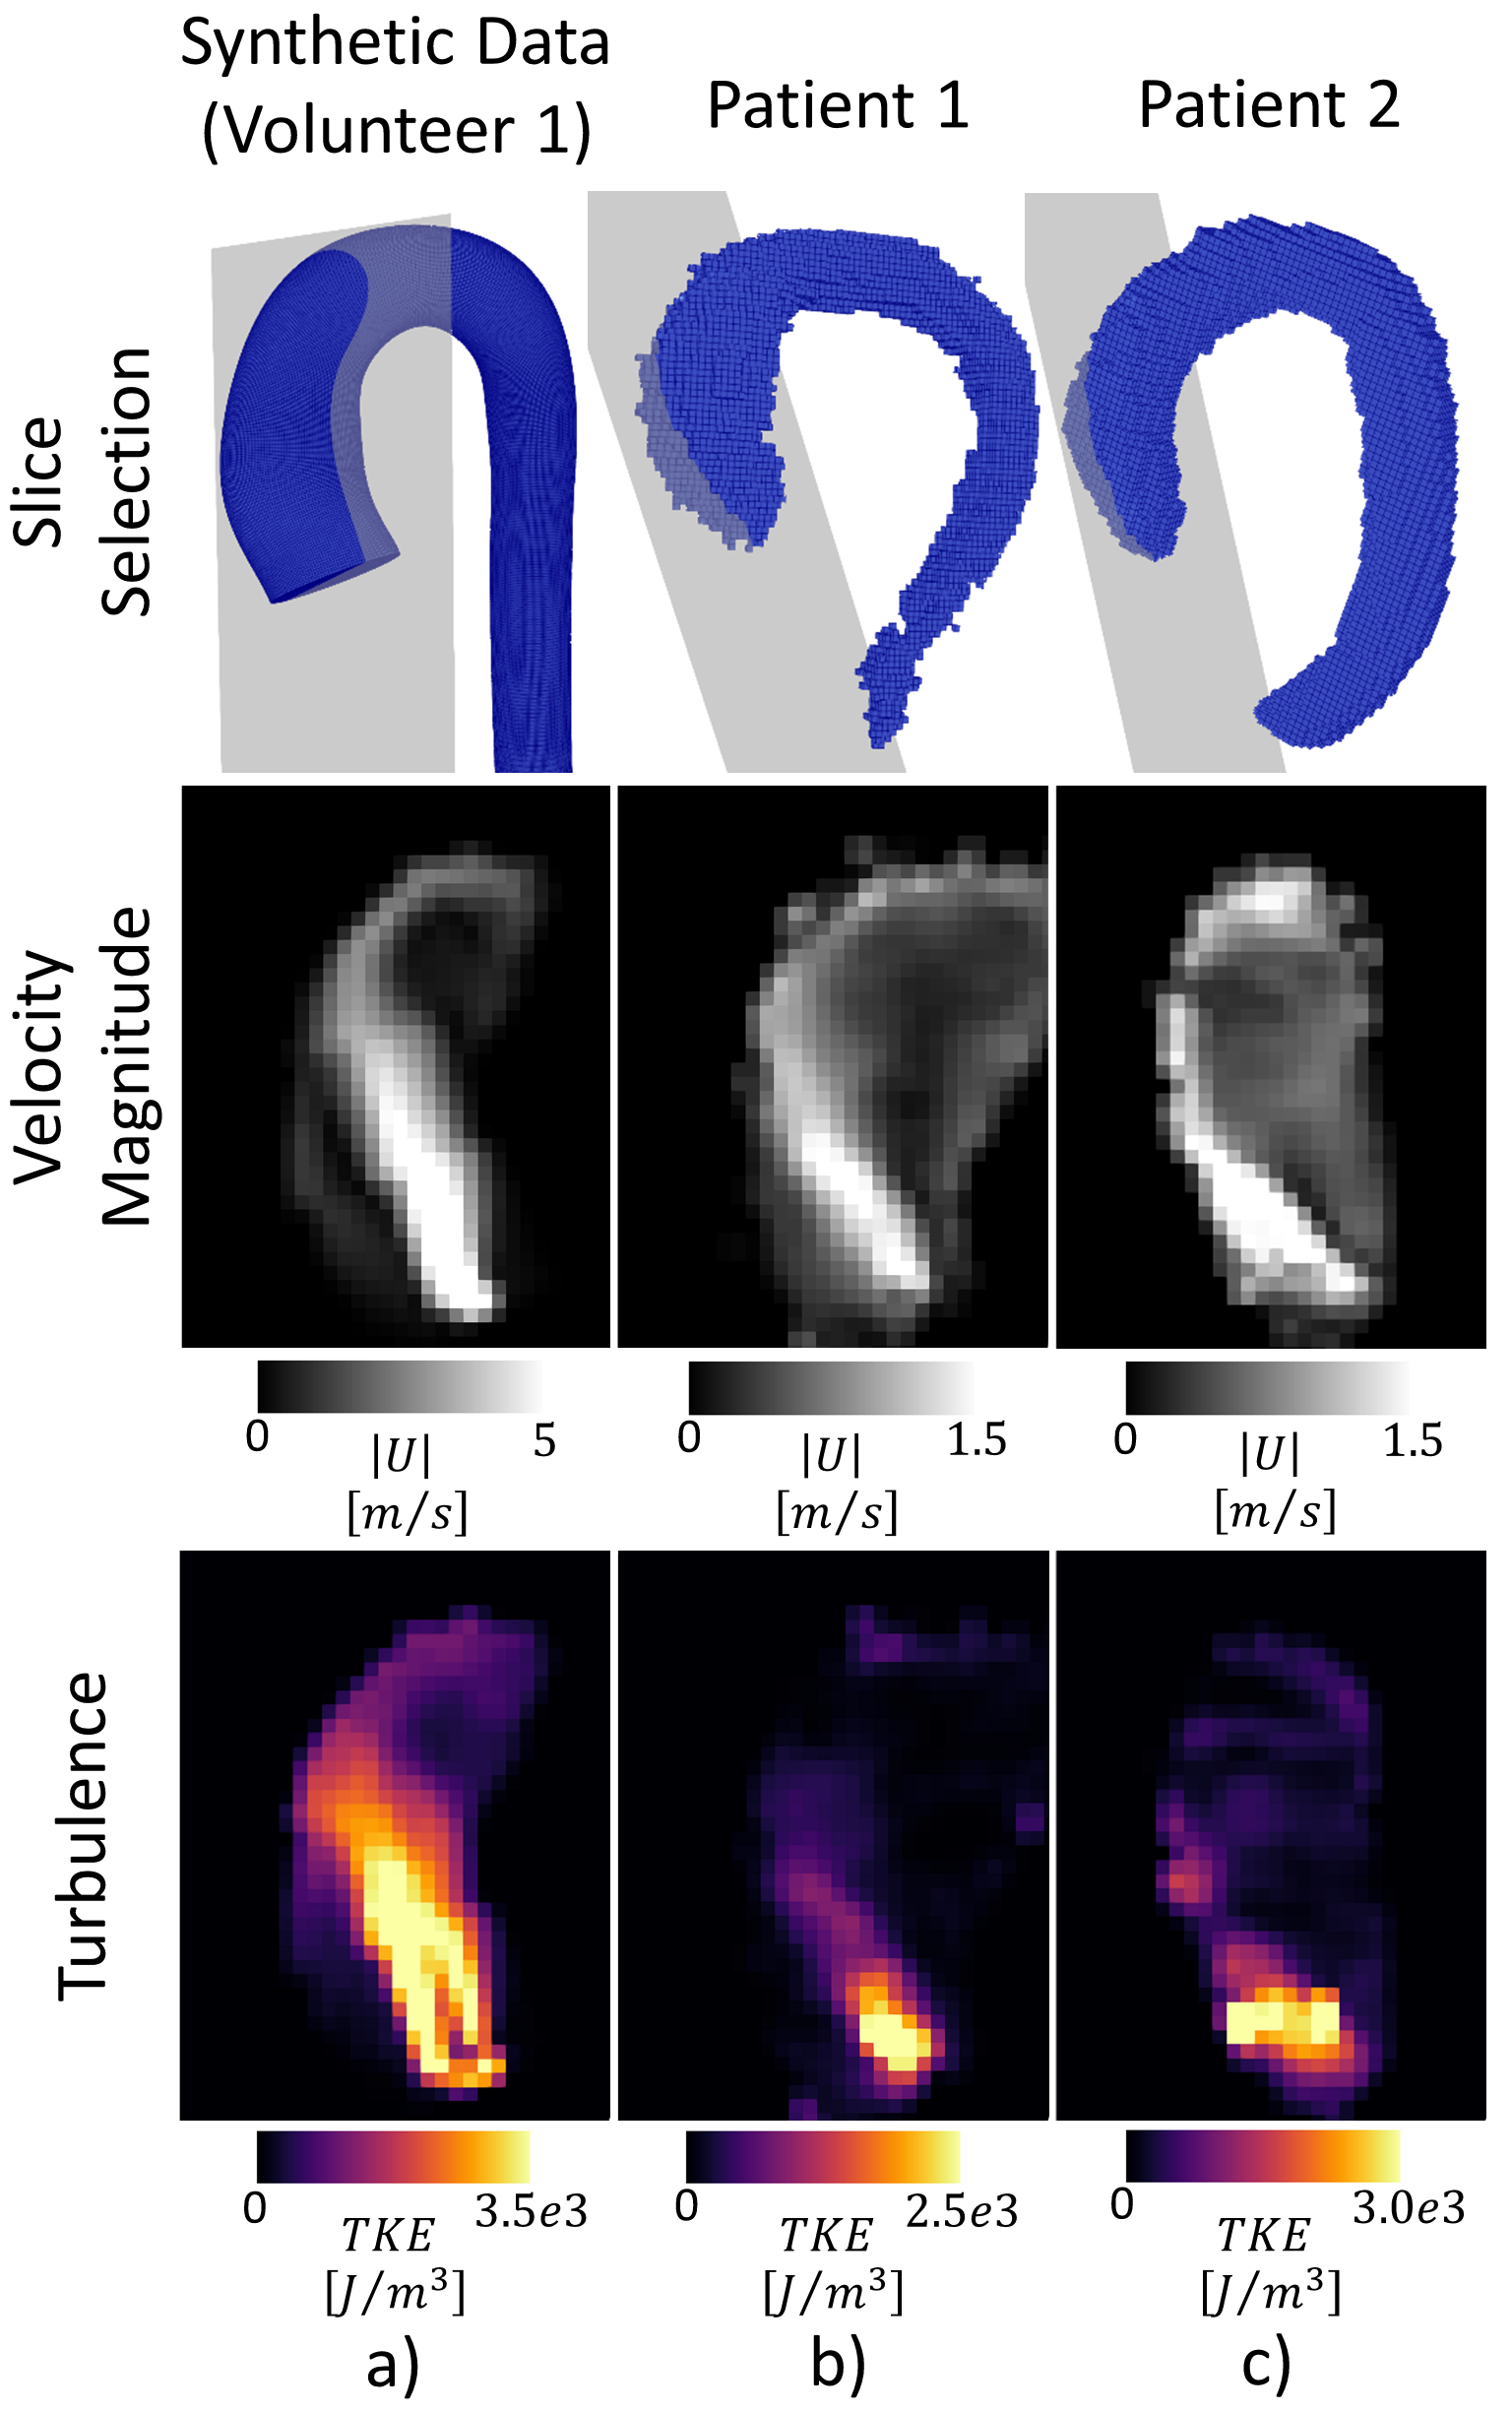
Convergence of LES simulations was achieved after the simulation of 10 cardiac cycles. On average, 6 hours per cardiac cycle were required using 48 CPU cores (Euler Cluster, Swiss National Center for Supercomputing) for the simulation of moderate aortic stenosis. Figure 2 shows exemplary data of peak systolic velocity magnitude of the reference CFD and two synthesized PC-MRI datasets with isotropic voxel sizes of 1.5mm (SNR = 10) and 2.5mm (SNR = 40). Similarly, in Figure 3, turbulence kinetic energy (TKE) is shown at peak TKE production. In Figure 4, synthetic 4D flow tensor MRI datasets are compared to 4D flow tensor scans of two patients with stenosis severity of 91% (Patient 1) and 85% (Patient 2). In-vivo 4D flow tensor scans were acquired at an isotropic resolution of 2.5mm with an estimated SNR of 30. Slices for each case were planned in order to be aligned with the stenotic jet core (Figure 4, first row).Discussion
A framework to synthesize time-resolved patient-specific 4D flow tensor MRI data of pulsatile turbulent aortic flows has been presented. Based on the synthetic data, peak velocity was found to be underestimated with increasing voxel sizes, while peak TKE was overestimated in agreement with previous findings8,10. Partial volume effects are visible as resolution decreases and small geometrical or flow features are no longer resolved.The synthesis of 4D and 5D flow tensor MRI data provides paired sets of realistic ground truth and actual MRI data to allow training of deep learning algorithms to improve image reconstruction11 and inference6 without bias as introduced by manually labeled imaging data. Here we have demonstrated that patient-specific synthetic 4D flow tensor MRI data of pathological aortic flows can be synthesized. Further improvements can be achieved using pathological geometries as well as implementing tilted inflow stenotic jets. Segmentations from various healthy volunteers and patients could be used to generate shape and displacement models12 and scalable cloud resources are available to further reduce computational times of high fidelity CFD simulations. This would allow to use the pipeline presented in this work to produce synthetic datasets for a large variety of shapes and inflow profiles. Although this work has focused on TKE, the ground truth contains accurate information about pressure drop, wall shear stresses (WSS) and pulse wave velocity (PWV), suggesting the pipeline could be extended with other hemodynamic pathological biomarkers.
Acknowledgements
The author acknowledges funding of the Swiss National Science Foundation, grant CR23I3_166485.References
1. Markl, M., Frydrychowicz, A., Kozerke, S., Hope, M. & Wieben, O. 4D flow MRI. J. Magn. Reson. Imaging 36, 1015–1036 (2012).
2. Garcia, J., Barker, A. J. & Markl, M. The Role of Imaging of Flow Patterns by 4D Flow MRI in Aortic Stenosis. JACC Cardiovasc. Imaging 12, 252–266 (2019).
3. Ha, H. et al. Estimating the irreversible pressure drop across a stenosis by quantifying turbulence production using 4D Flow MRI. Sci. Rep. 7, 1–14 (2017).
4. Binter, C. et al. Turbulent Kinetic Energy Assessed by Multipoint 4-Dimensional Flow Magnetic Resonance Imaging Provides Additional Information Relative to Echocardiography for the Determination of Aortic Stenosis Severity. Circ. Cardiovasc. Imaging 10, (2017).
5. Ravi, D. et al. Deep Learning for Health Informatics. IEEE J. Biomed. Heal. Informatics 21, 4–21 (2017).
6. Ferdian, E. et al. 4DFlowNet: Super-Resolution 4D Flow MRI Using Deep Learning and Computational Fluid Dynamics. Front. Phys. 8, 1–14 (2020).
7. Andersson, M., Lantz, J., Ebbers, T. & Karlsson, M. Quantitative Assessment of Turbulence and Flow Eccentricity in an Aortic Coarctation: Impact of Virtual Interventions. Cardiovasc. Eng. Technol. 6, 281–293 (2015).
8. Walheim, J., Dillinger, H., Gotschy, A. & Kozerke, S. 5D Flow Tensor MRI to Efficiently Map Reynolds Stresses of Aortic Blood Flow In-Vivo. Sci. Rep. 9, 1–12 (2019).
9. Binter, C., Knobloch, V., Manka, R., Sigfridsson, A. & Kozerke, S. Bayesian multipoint velocity encoding for concurrent flow and turbulence mapping. Magn. Reson. Med. 69, 1337–1345 (2013).
10. Binter, C., Gülan, U., Holzner, M. & Kozerke, S. On the accuracy of viscous and turbulent loss quantification in stenotic aortic flow using phase-contrast MRI. Magn. Reson. Med. 76, 191–196 (2016).
11. Vishnevskiy, V., Walheim, J. & Kozerke, S. Deep variational network for rapid 4D flow MRI reconstruction. Nat. Mach. Intell. 2, 228–235 (2020).
12. Buoso, S., Joyce, T. & Kozerke, S. Personalising left-ventricular biophysical models of the heart using parametric physics-informed neural networks. Med. Image Anal. 71, 102066 (2021).
Figures