0217
Impact of 4D-flow MRI spatial resolution on quantitative hemodynamics in 3D-printed aortic dissection models with varying tear size1Department of Radiology, Stanford University, Stanford, CA, United States, 2Department of Computer Science, Technical University of Munich, Garching, Germany, 3Department of Bioengineering, Stanford University, Stanford, CA, United States, 4Division of Radiology, Veterans Affairs Health Care System, Palo Alto, CA, United States, 5Department of Pediatrics, Stanford University, Stanford, CA, United States
Synopsis
Understanding flow dynamics in type-B aortic dissection (TBAD) is of high clinical interest to predict complications and individualize treatment. Here, we sought to evaluate 4D-flow MRI at high and low spatial image resolution, in comparison to high resolution, high signal-to-noise 2D phase contrast MRI. Further, we compare TBAD hemodynamics and flow alterations owing to changes in tear size. We leverage novel 3D printing technology to manufacture three compliant TBAD models with altered tear morphology and perform pressure- and flow-controlled MRI with an advanced in vitro flow setup.
Introduction
The mid and long-term prognosis of patients with type-B aortic dissection (TBAD)1 is closely linked to morphologic (size, growth) and hemodynamic (pressure, true-to-false lumen flow splits) features of the dissected aorta. 4D-flow MRI can be performed to retrieve quantitative hemodynamic parameters in TBAD2–4, but careful consideration should be made regarding 4D-flow MRI acquisition settings and the trade-offs that balance flow measurement accuracy and precision against exam time.The objective of this work was to compare 4D-flow MRI at high and low spatial image resolution, as well as high resolution, high signal-to-noise 2D phase-contrast (PC) MRI. Specifically, we sought to perform this analysis in TBAD models that exhibit flow alterations owing to changes in tear size. To this end, we leverage novel 3D printing technology to manufacture three compliant TBAD models and perform pressure- and flow-controlled MRI with an advanced in vitro flow setup.
Methods
A patient-specific TBAD model (“model A”) with a proximal primary intimal tear (PIT) and a distal re-entry tear (Fig. 1) was constructed and 3D-printed using a compliant photopolymer material with wall elasticity similar to the human aortic wall (~1.2 MPa)5. In addition, this baseline model was altered to generate two additional models: one with reduced PIT (“Model B”), and one with reduced re-entry tear (“Model C”). Each model was embedded into a pulsatile flow loop5,6 (Fig. 2) with HR = 60 bpm, stroke volume = 74.1 ml, peak flow rate = 300 ml/s, and systolic/diastolic pressure levels (in mmHg) of 124/68, 138/70, and 142/74 for models A, B, and C, respectively. Experiments were all performed within a one-day session, and pressure mapping (with SPR-350S, Millar) was done at the scanner table prior to imaging.Image data were acquired on a 3T system (Skyra, Siemens) with flow sequences as follows:
(1) 2D-PC: two-dimensional through-plane encoded phase contrast MRI at 13 cross-sections (Fig. 1): FOV=220x123 mm2; pixel size=1.1 mm2; slice thickness=6 mm; TE/TR=3/5.25 ms; averages=2; flip angle=25 deg; VENC=100-170 cm/s; retrospective binning with 40 frames/cycle; scan time = 72 seconds/slice.
We also obtained 4D-flow MRI with a Cartesian k-space trajectory at high (HR) and low (LR) spatial resolutions and acceleration approaches, resulting in significant scan time reduction:
(2a) 4D-flowHR: FOV=340x236x90mm3; matrix=220x156x156; voxel size=1.5 mm3; TE/TR=2.7/5.6 ms; k-lines/segment=2; parallel imaging (GRAPPA) with R=2; VENC=120-170 cm/s; retrospective binning with 20 frames/cycle; scan time = 45 minutes); and
(2b) 4D-flowLR: FOV=340x236x90mm3; matrix=112x78x30; voxel size=3 mm3; TE/TR=2.7/5.6 ms; k-lines/segment=3; GRAPPA R=2; 6/8 partial Fourier; VENC=120-170 cm/s; retrospective binning with 20 frames/cycle; scan time=7 minutes).
All data were corrected for Maxwell terms, gradient non-linearity7, and eddy-current phase offsets via static gel polynomial fitting. Moving lumen contours were generated using a deformable registration approach8 applied to high resolution cine GRE image data that were additionally acquired for all cross-sections. All quantitative flow analyses between sequences were based on identical lumen boundary contours, with zero phantom movement to be assumed in between sequences. Inter-model comparisons at identical cross-sections were made possible via fiducial markers in the surrounding static gel. Data analyses were done using MevisLab (v3.4a)9 and ParaView (v5.7).
Results
4D-flowHR vector renderings (Fig. 3) revealed swirling flow close to tear regions that were not captured with 4D-flowLR. Further, 4D-flowHR showed substantial differences in velocity patterns where tears were altered.2D-PC inlet net flow volume was within <5% of programmed flow, whereas 4D-flow acquisitions underestimated programmed inflow by up to -11.5% (high res) and -13% (low res) (Fig. 4). As per flow mass conservation, the sum of net flow at all model outlets versus net flow at model inlet differed by up to 3.4%, 6.4%, and 26% for 2D-PC, 4D-flowHR, and 4D-flowLR data, respectively.
False lumen (FL) flow fraction (=100 x QFL/(QFL+QTL))—averaged over locations 1-5 along dissected region—was 74.1% in model A, and was reduced down to 55.3% and 56.4% for model B and C (here: values based on 4D-flowHR). Averaged FL flow fraction differed by <5% when computed based on 2D-PC or 4D-flowLR data. But, 4D-flowLR resulted in greatest FL flow fraction deviations between cross-section location.
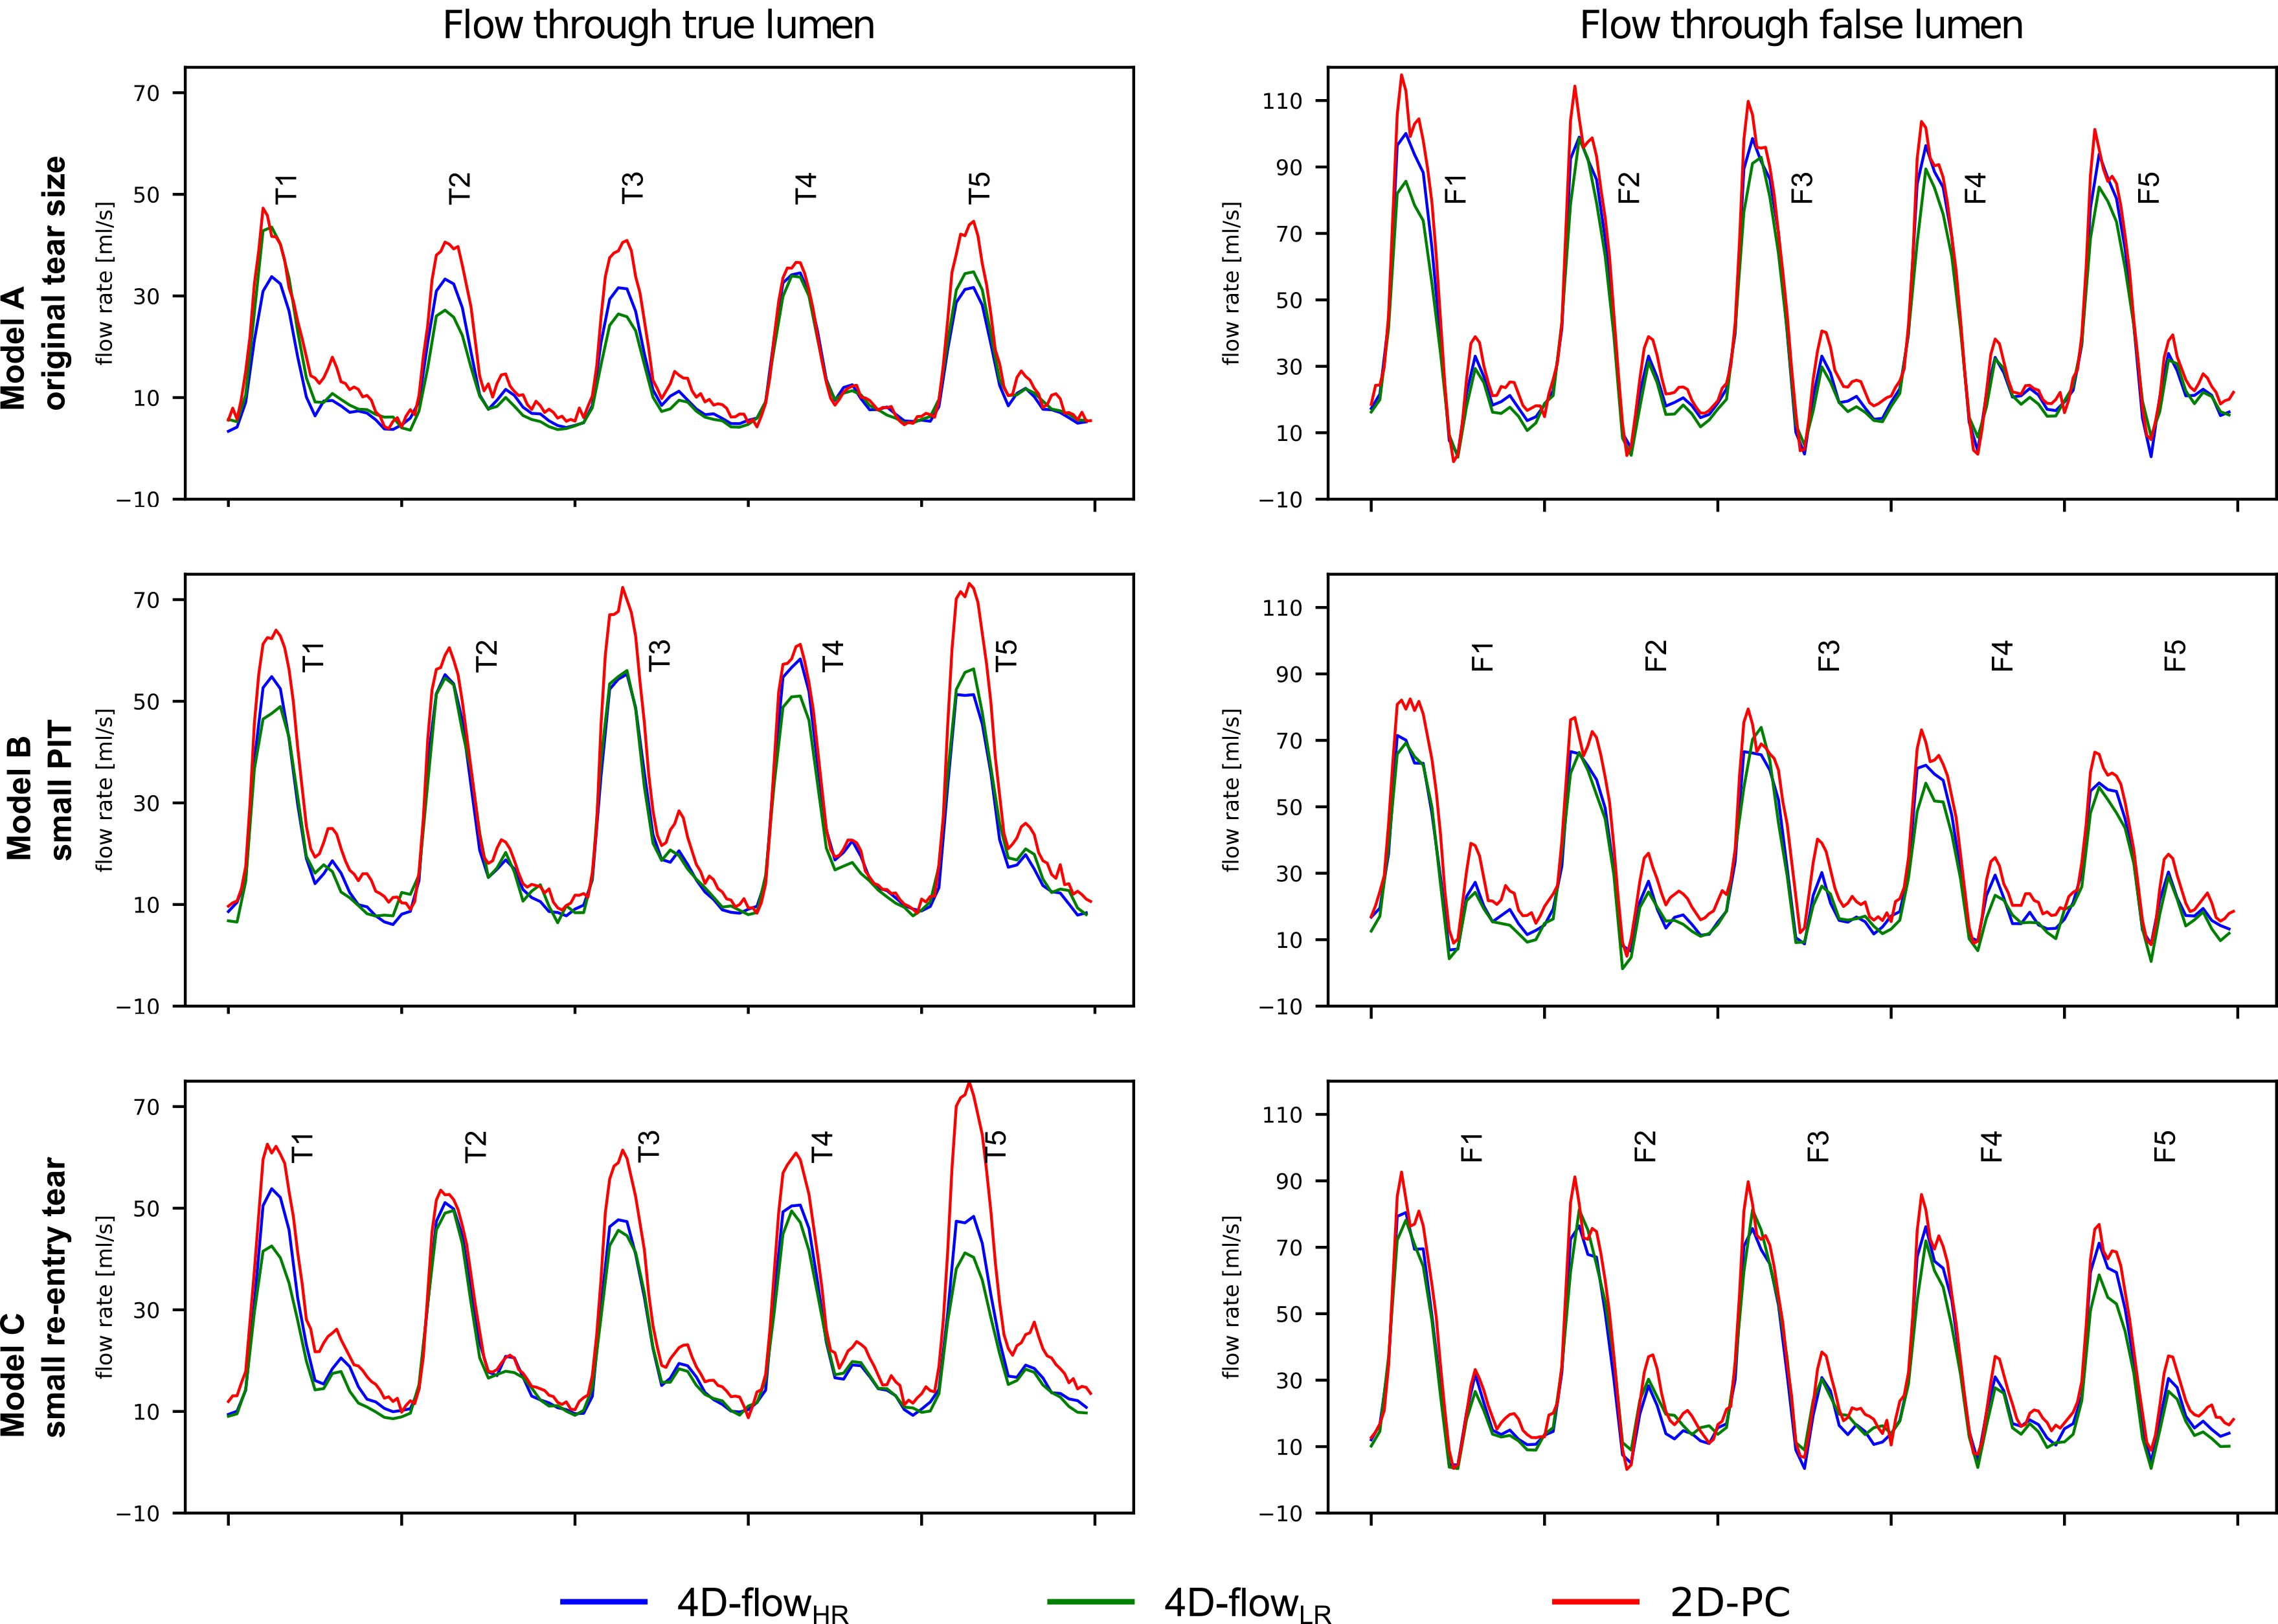
2D-PC measured the highest peak flow rates at all locations in the TL and FL (Fig. 5). 4D-flowHR and 4D-flowLR flow rate waveforms showed very similar dynamics along FL sections, but differed along TL sections.
Discussion and Conclusion
We compared low and high resolution 4D-flow MRI and 2D-PC regarding their applicability to visualize complex flow patterns in aortic dissection and to reliably quantify net flow and false lumen flow fraction. 4D-flowHR scans were superior for qualitative display of TBAD flow complexity and suitable to study the influence of tear size on TBAD flow dynamics.Net flow was underestimated by both 4D-flowHR and 4D-flowLR acquisitions, when compared to 2D-PC data as well as the known programmed pump value. Absolute net flow and relative measurements such as FL flow fraction may be derived from 4D-flowLR with the same level of uncertainty as when derived from 4D-flowHR. Additional phantom based studies are warranted for more advanced flow parameters (e.g. pressure gradients, wall shear stress).
More broadly, we developed a novel setup for flow assessment and demonstrated its suitability for performing quality assurance studies under highly-controlled conditions.
Acknowledgements
JZ received a scholarship from German Academic Exchange Service (DAAD). DBE receives funding through NIH R01 HL131823.References
1. Nienaber CA, Clough RE, Sakalihasan N, et al. Aortic dissection. Nat Rev Dis Prim 2016;2.
2. Dillon-Murphy D, Noorani A, Nordsletten D, Figueroa CA. Multi-modality image-based computational analysis of haemodynamics in aortic dissection. Biomech Model Mechanobiol 2016;15:857-876.
3. de Beaufort HW, Shah DJ, Patel AP, et al. Four-dimensional flow cardiovascular magnetic resonance in aortic dissection: Assessment in an ex vivo model and preliminary clinical experience. J Thorac Cardiovasc Surg 2019;157:467-476.
4. Liu D, Fan Z, Li Y, et al. Quantitative Study of Abdominal Blood Flow Patterns in Patients with Aortic Dissection by 4-Dimensional Flow MRI. Sci Rep 2018;8:9111.
5. Zimmermann J, Bäumler K, Loecher M, et al. Quantitative Hemodynamics in Aortic Dissection: Comparing in Vitro MRI with FSI Simulation in a Compliant Model. In: Func Imaging Model Heart. FIMH 2021. Lect Notes Comp Science. Vol 12738. Springer, Cham; 2021:575-586.
6. Zimmermann J, Loecher M, Kolawole FO, et al. On the impact of vessel wall stiffness on quantitative flow dynamics in a synthetic model of the thoracic aorta. Sci Rep 2021;11:6703.
7. Markl M, Bammer R, Alley MT, et al. Generalized reconstruction of phase contrast MRI: Analysis and correction of the effect of gradient field distortions. Magn Reson Med 2003;50:791-801.
8. Tautz L, Hennemuth A, Peitgen H-O. Motion Analysis with Quadrature Filter Based Registration of Tagged MRI Sequences. In: Stat. Atlases Comput. Model. Heart. STACOM 2011. Lect. Notes Comput. Science. Vol 7085. Springer, Berlin, Heidelberg; 2012:78-87.
9. Ritter F, Boskamp T, Homeyer A, et al. Medical image analysis. IEEE Pulse 2011;2:60-70.
Figures
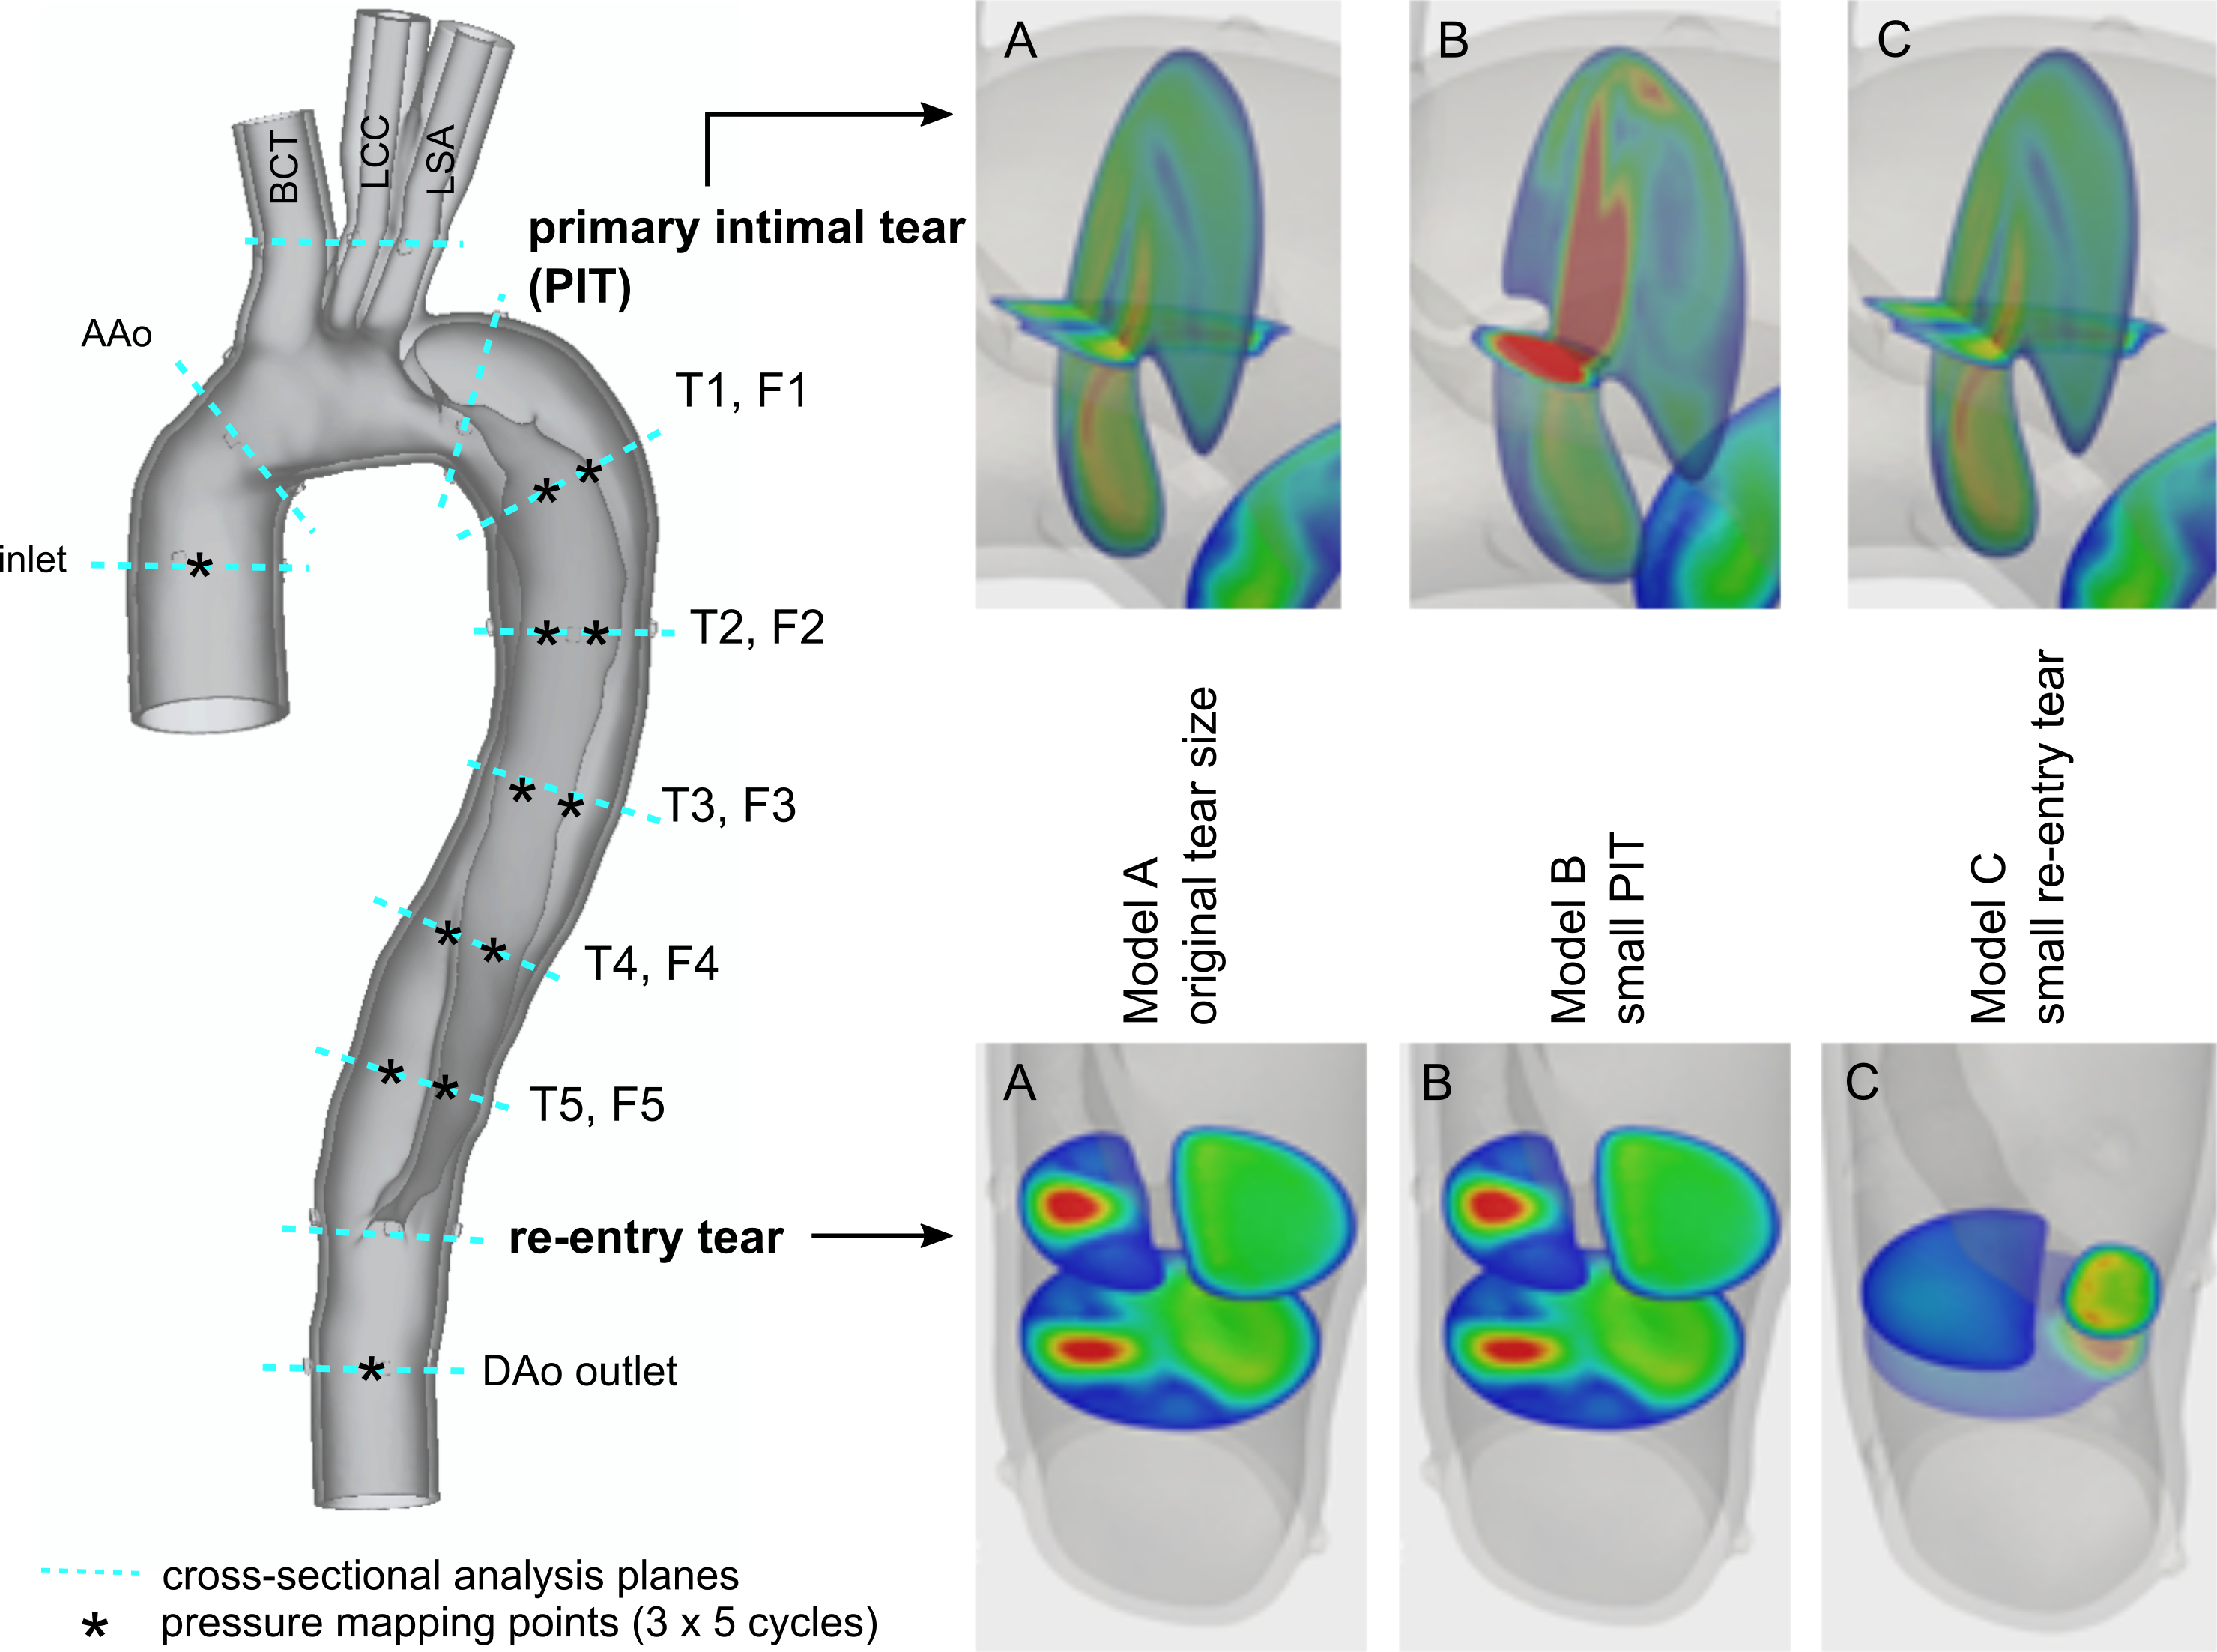
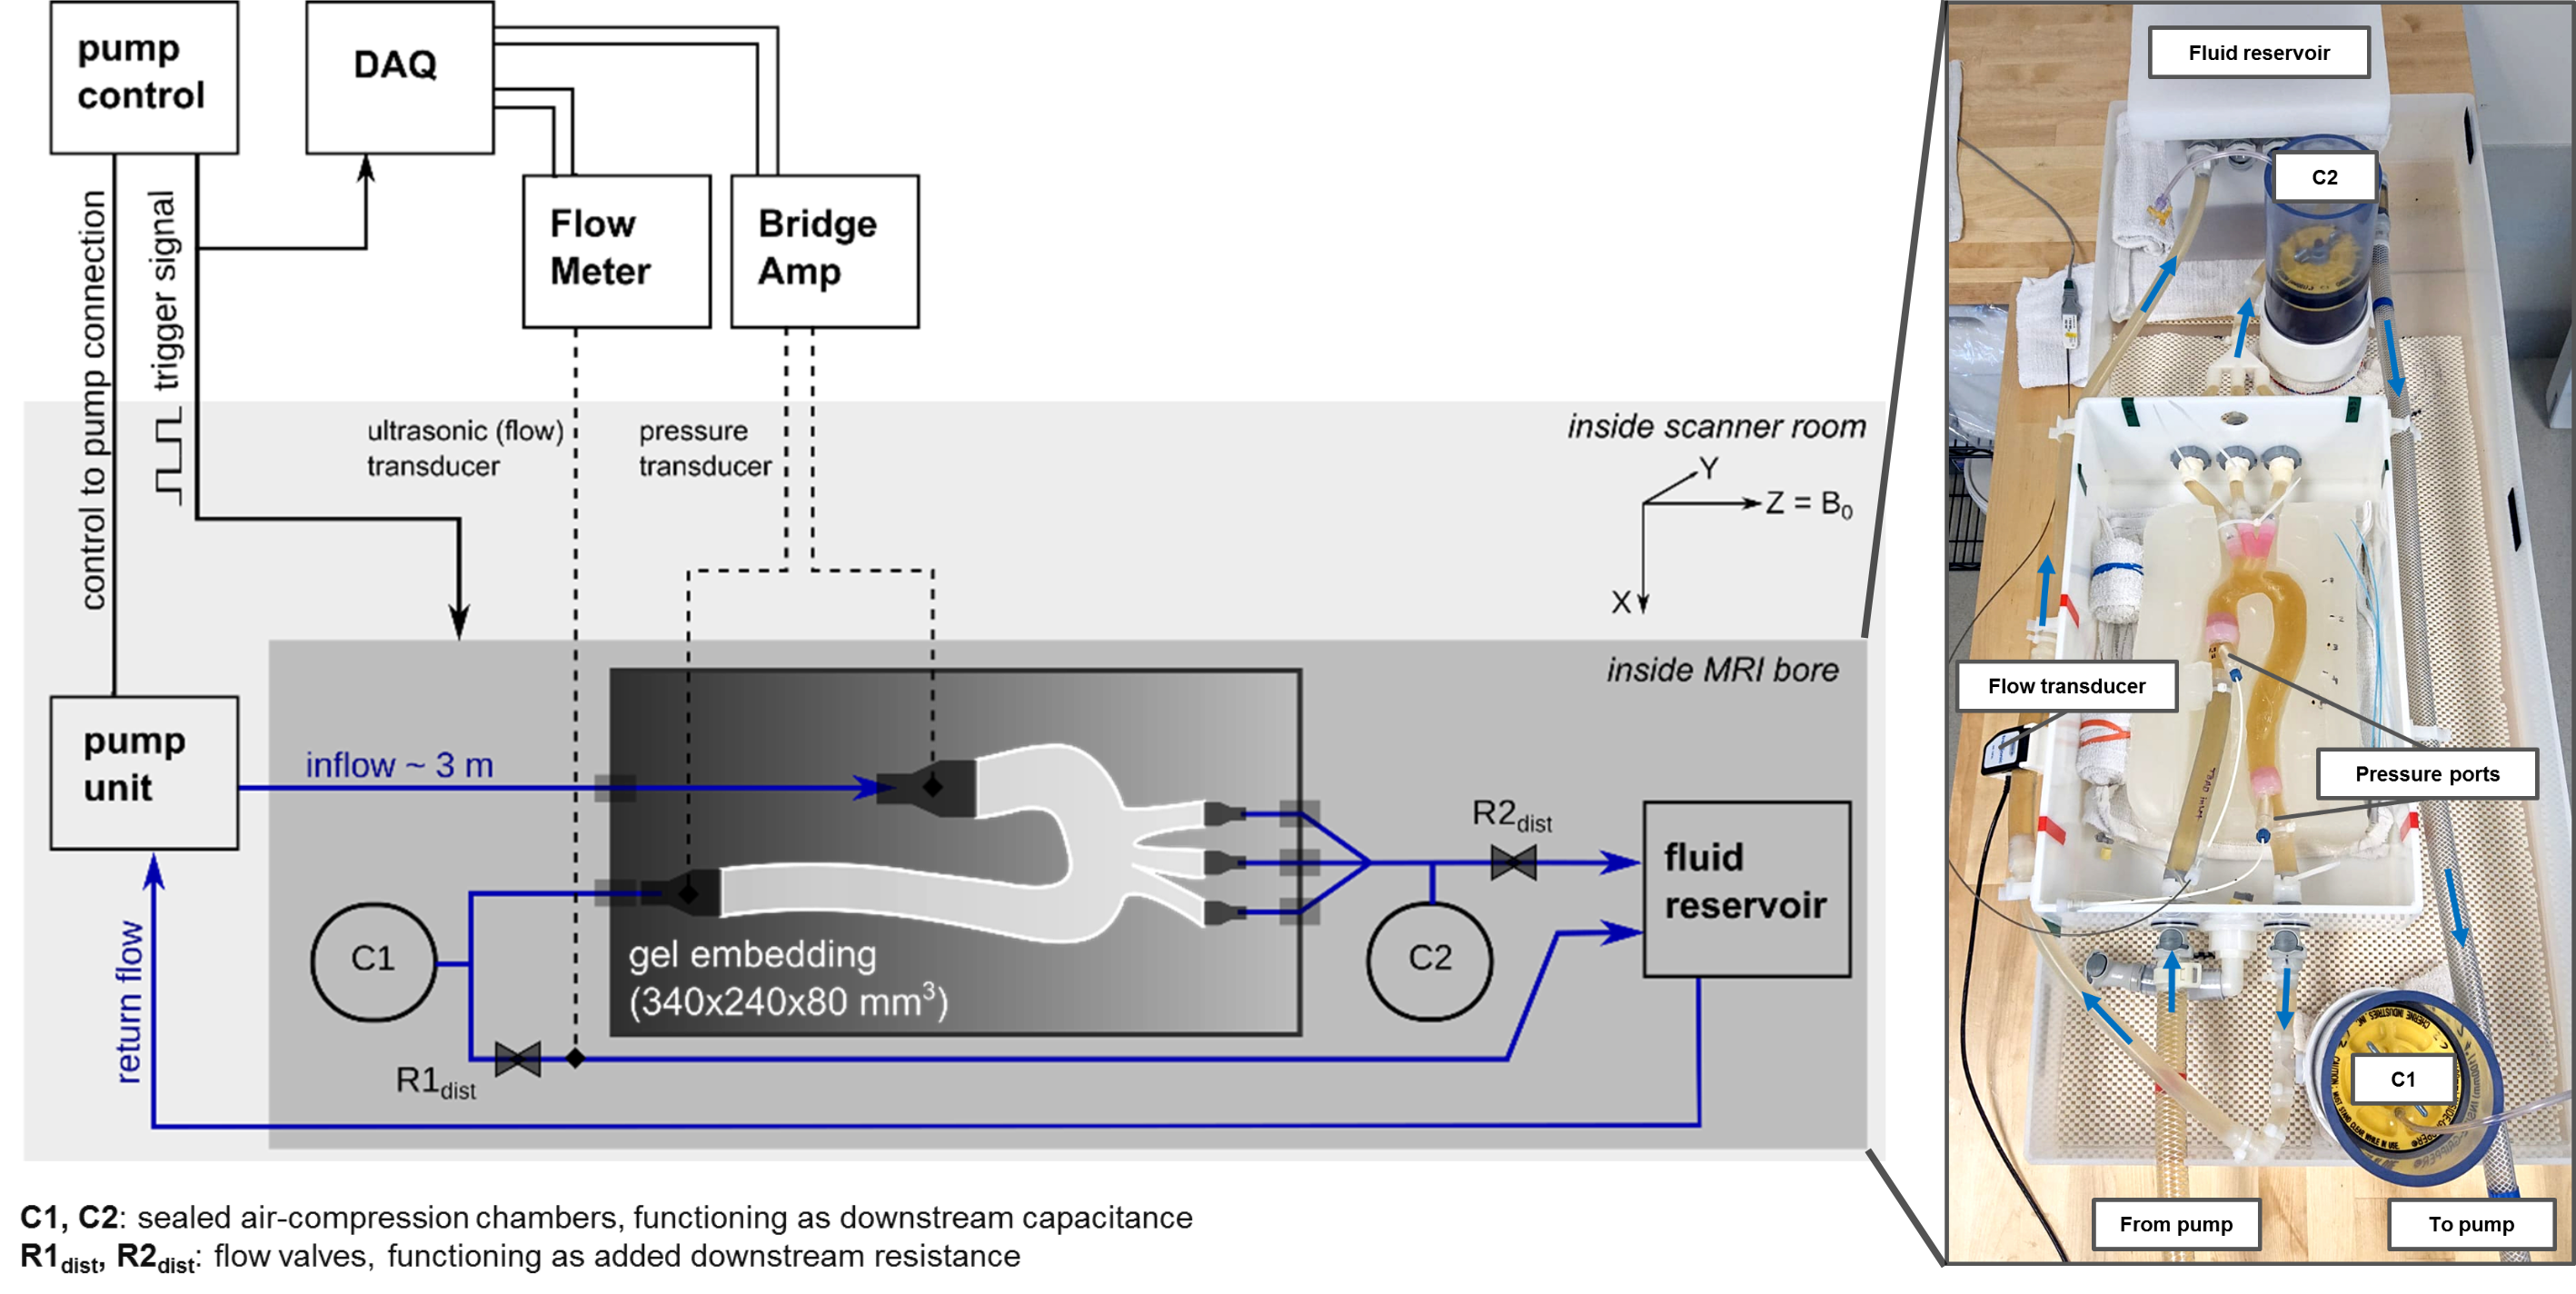
Fig. 2 Schematic diagram (left) and photograph (right) of the engineered MRI-compatible flow circuit setup. The pump unit is positioned at the end of the patient table. The pump control provides an external trigger for triggering image acquisition and data acquisition system. Ultrasonic flow transducers and pressure transducers are disconnected prior to image acquisition amid their lacking MRI compatibility. The gel embedding defines the 3D imaging volume and includes fixed fiducial markers to reproducibly prescribe cross-sectional image acquisition and analysis planes.
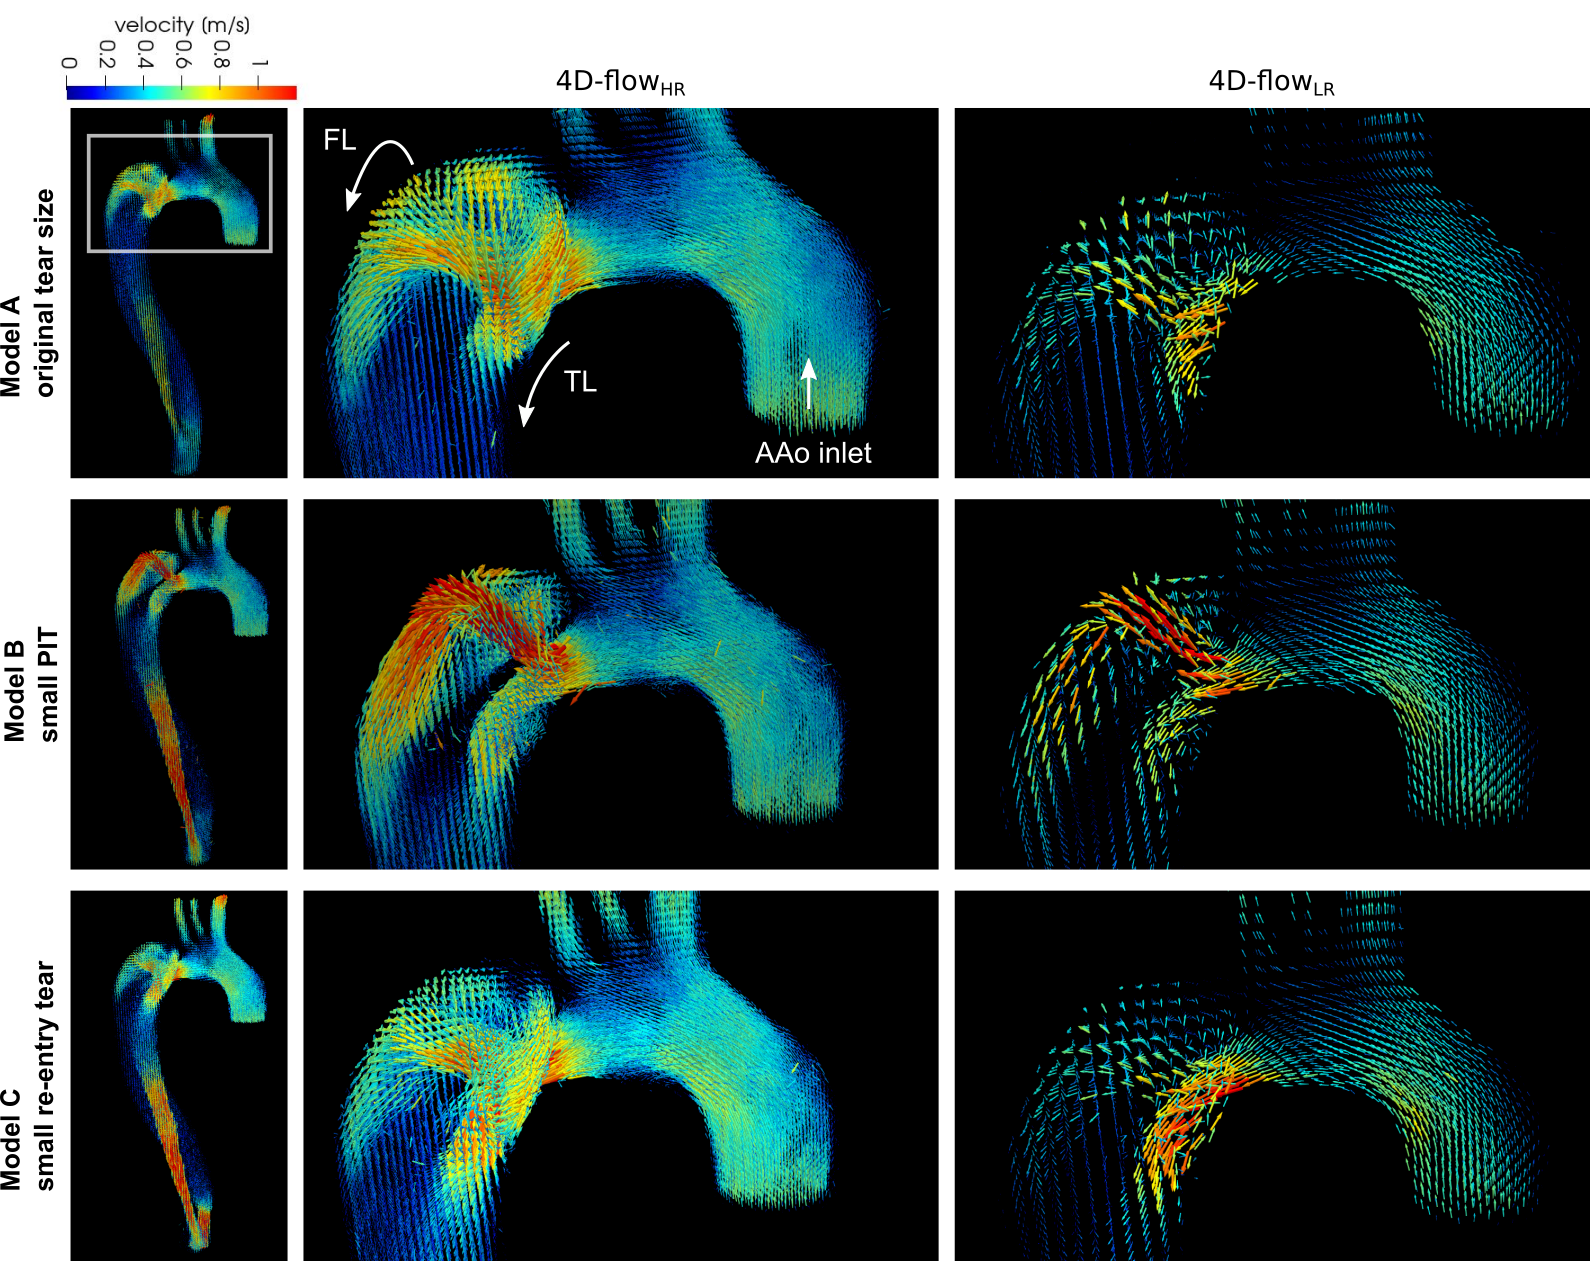
Fig. 3 Instantaneous velocity vector patterns at peak systole (t = 200 ms) for three TBAD models, measured with high (1.5x1.5x1,5 mm3, middle column) and low (3x3x3 mm3, right column) spatial image resolution resolution. Renderings based on high spatial resolution data reveal local complex flow patterns through PIT that are not captured with low spatial resolution scans.
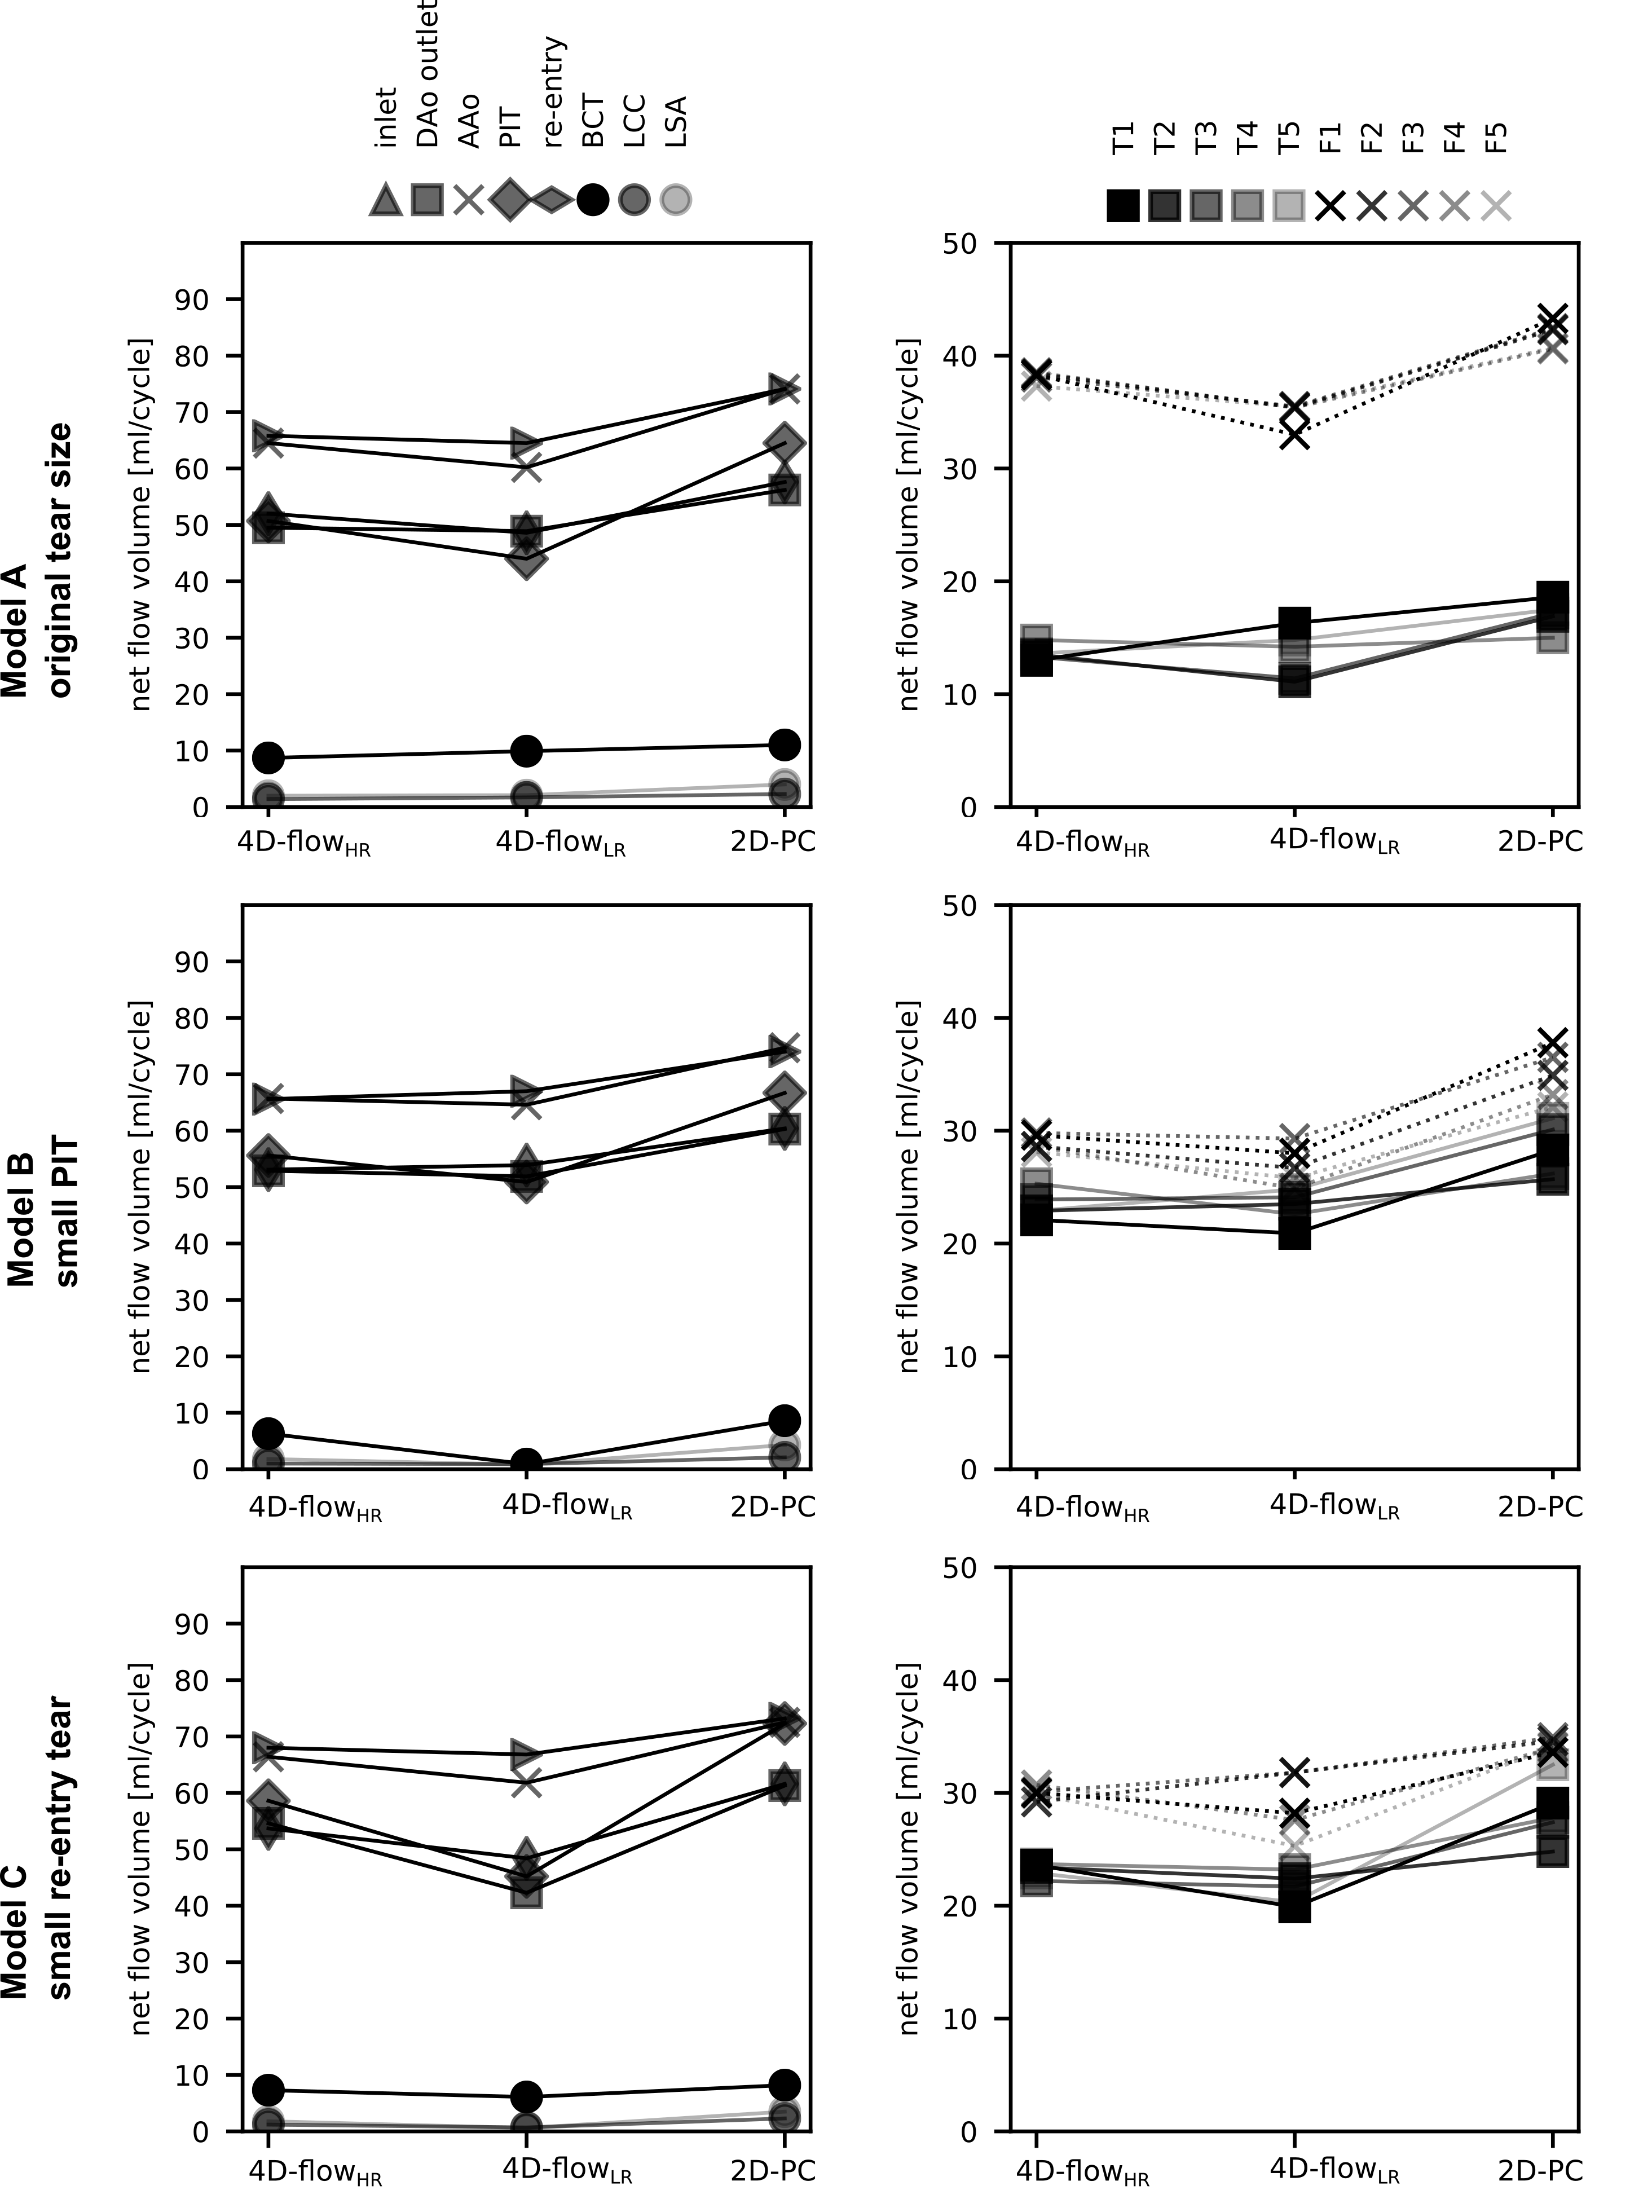
Fig. 4 Calculated net flow numbers (in ml/cycle) for models A, B, and C at 18 cross-sections. Labels as defined in Fig. 1.