0216
RR-Resolved 5D flow for Decoding the Impact of Cardiac Rhythm on Left Atrial Flow Dynamics in Atrial Fibrillation and Stroke1Northwestern University, Chicago, IL, United States, 2University of Lausanne, Lausanne, Switzerland
Synopsis
RR-resolved 5D flow is a novel MRI technique that can acquire time-resolved 3D hemodynamics for varying RR-interval durations during atrial fibrillation (AF) (5D = 3D+cardiac time+RR-interval duration). The purpose of this study was to apply RR-resolved 5D flow MRI in a cohort of AF patients with and without a prior history of stroke. We saw significantly lowered left atrial peak velocities and trends toward higher atrial blood stasis in AF patients with previous stroke history vs no previous stroke history who underwent arrhythmia during MRI acquisition. RR-resolved 5D flow may be a promising approach for cardiovascular imaging in arrhythmic patients.
Introduction
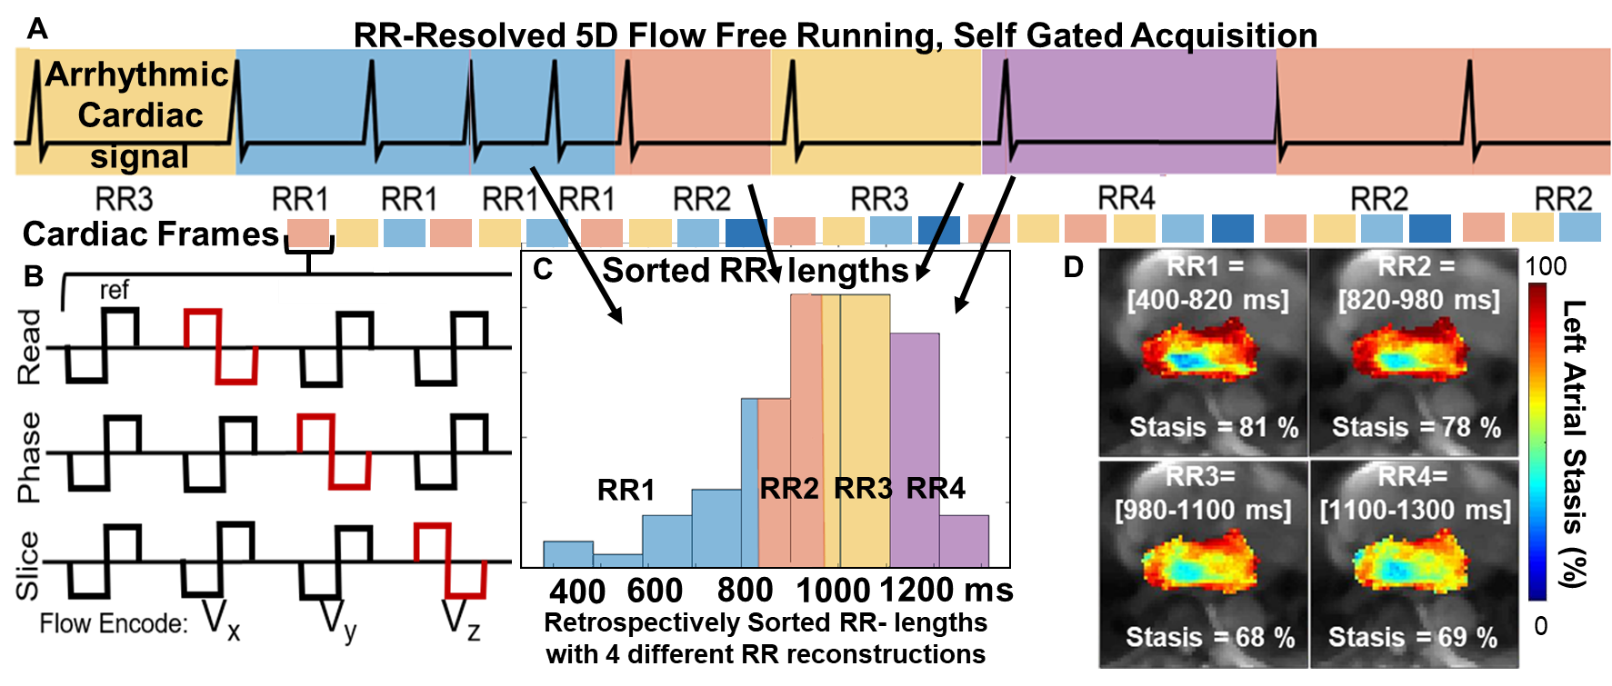
Atrial fibrillation (AF) is the most common sustained cardiac arrhythmia.1 Impaired left atrial (LA) hemodynamics, slow blood flow velocities and blood stasis, are implicated in increased risk of thrombus formation and cardioembolic stroke in AF patients.2,3 Echocardiographic and 4D-flow MRI have shown atrial velocities in AF patients with cardiac arrhythmia are lower compared to AF patients maintaining sinus rhythm. However, each modality has limitations: echocardiography lacks 3D volumetric coverage to fully capture complex LA flow dynamics; atrial 4D-flow MRI is ill-suited to study beat-to-beat flow changes during arrhythmia.4,5 RR-resolved 5D flow6 is a novel MRI technique with inherent self-gating that can acquire time-resolved 3D hemodynamics for varying RR-interval durations during cardiac arrhythmia (5D = 3D+cardiac time+RR-interval duration, fig 1). Peak velocities and blood flow stasis are measured across a range of RR intervals, assessing the impact of varying heart rates on atrial 3D hemodynamics. The purpose of this study was to apply RR-resolved 5D flow MRI in a cohort of AF patients with and without a prior history of stroke. We hypothesize that 1) variable RR-interval duration during arrhythmia will impact atrial flow measures and 2) AF patients with prior stroke will have impaired RR-resolved LA hemodynamics (lowered peak velocities, higher LA stasis).Methods
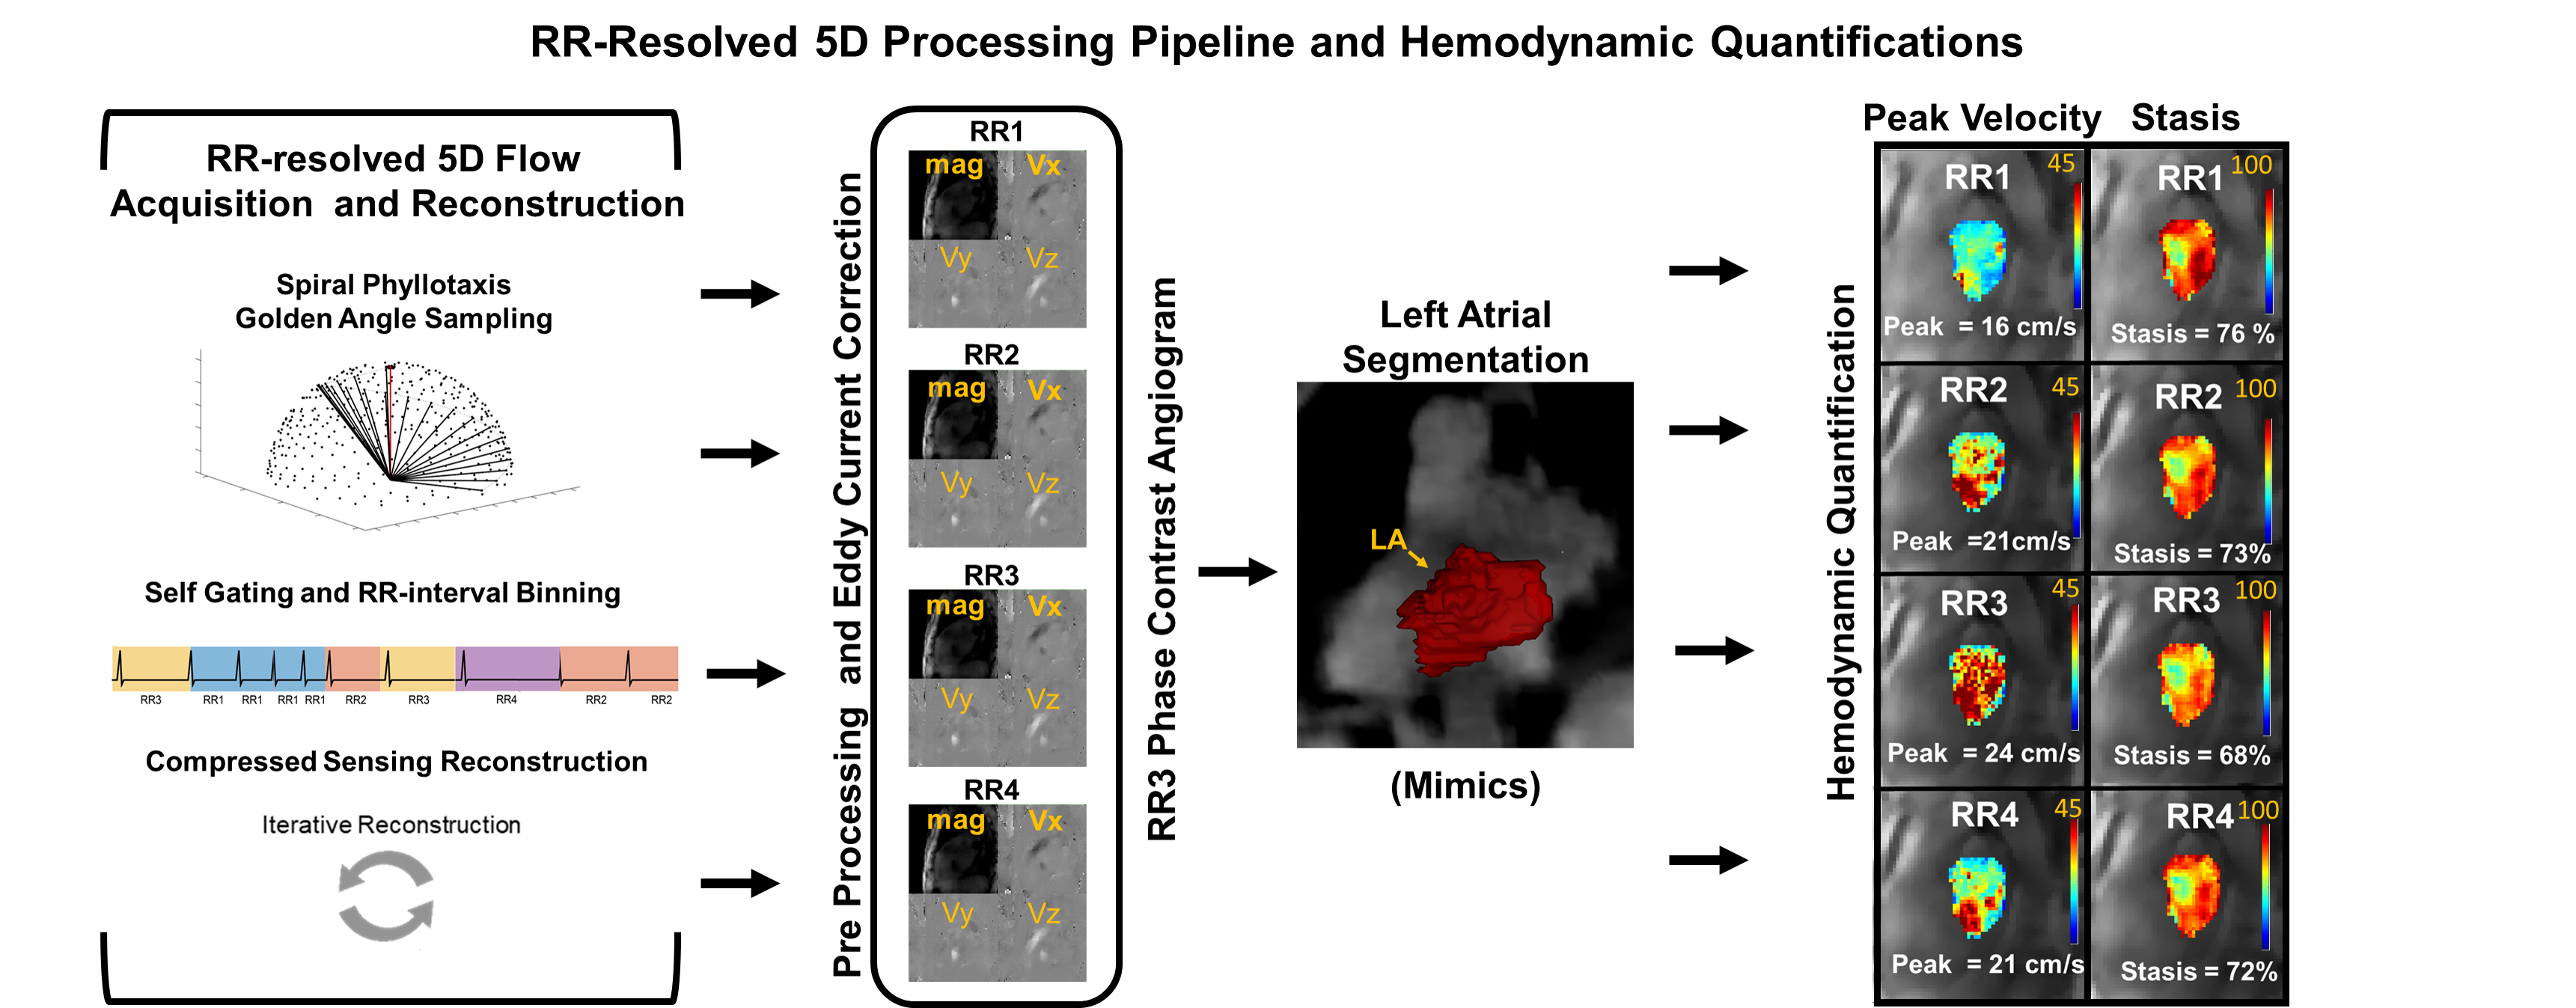
32 AF patients (table 1) undergoing cardiac MRI with RR-resolved 5D Flow were retrospectively enrolled (1.5T, venc=100 cm/s, FOV=250×250×250 mm3, TE/TR =2.93/4.70ms, flip angle=7°, temporal resolution=40ms, spatial resolution= 2.5x2.5x2.5 mm3). 16 AF patients had a history of prior stroke (stroke+) and 16 had no previous stroke history (stroke-).RR-resolved 5D flow reconstruction used a self-gating algorithm to retrospectively identify RR-interval duration and cardiac state (Fig1,A) for each k-space line. A RR-interval duration histogram (Fig 1,C) was constructed where all unique RR-interval lengths were sorted from shortest to longest. Four non-overlapping RR-interval bins, where each bin had the same number of RR-intervals, were reconstructed using compressed sensing. Image reconstruction resulted in four sets of 5D flow MRI data sets representing four RR-intervals durations (RR1 to RR4, Fig 1,D).6
To quantify heart rate variability during acquisition, the RR-interval histogram (Fig 1,C) was used to calculate the RR-interval duration coefficient of variation (RR-std/RR-mean, CoV) for each patient. To account for heart rate variability differences, patients were classified as high heart rate variability (HRV-high) or low heart rate variability (HRV-low). From previous results for detecting AF via RR histograms and CoV,7 HRV-high was defined as a CoV of 0.15-0.32, and HRV-low was defined as CoV less than 0.15. Two patients were excluded due to elevated CoV (> 0.40, possibly linked to non-AF arrhythmias ) and one patient for poor image and data quality.
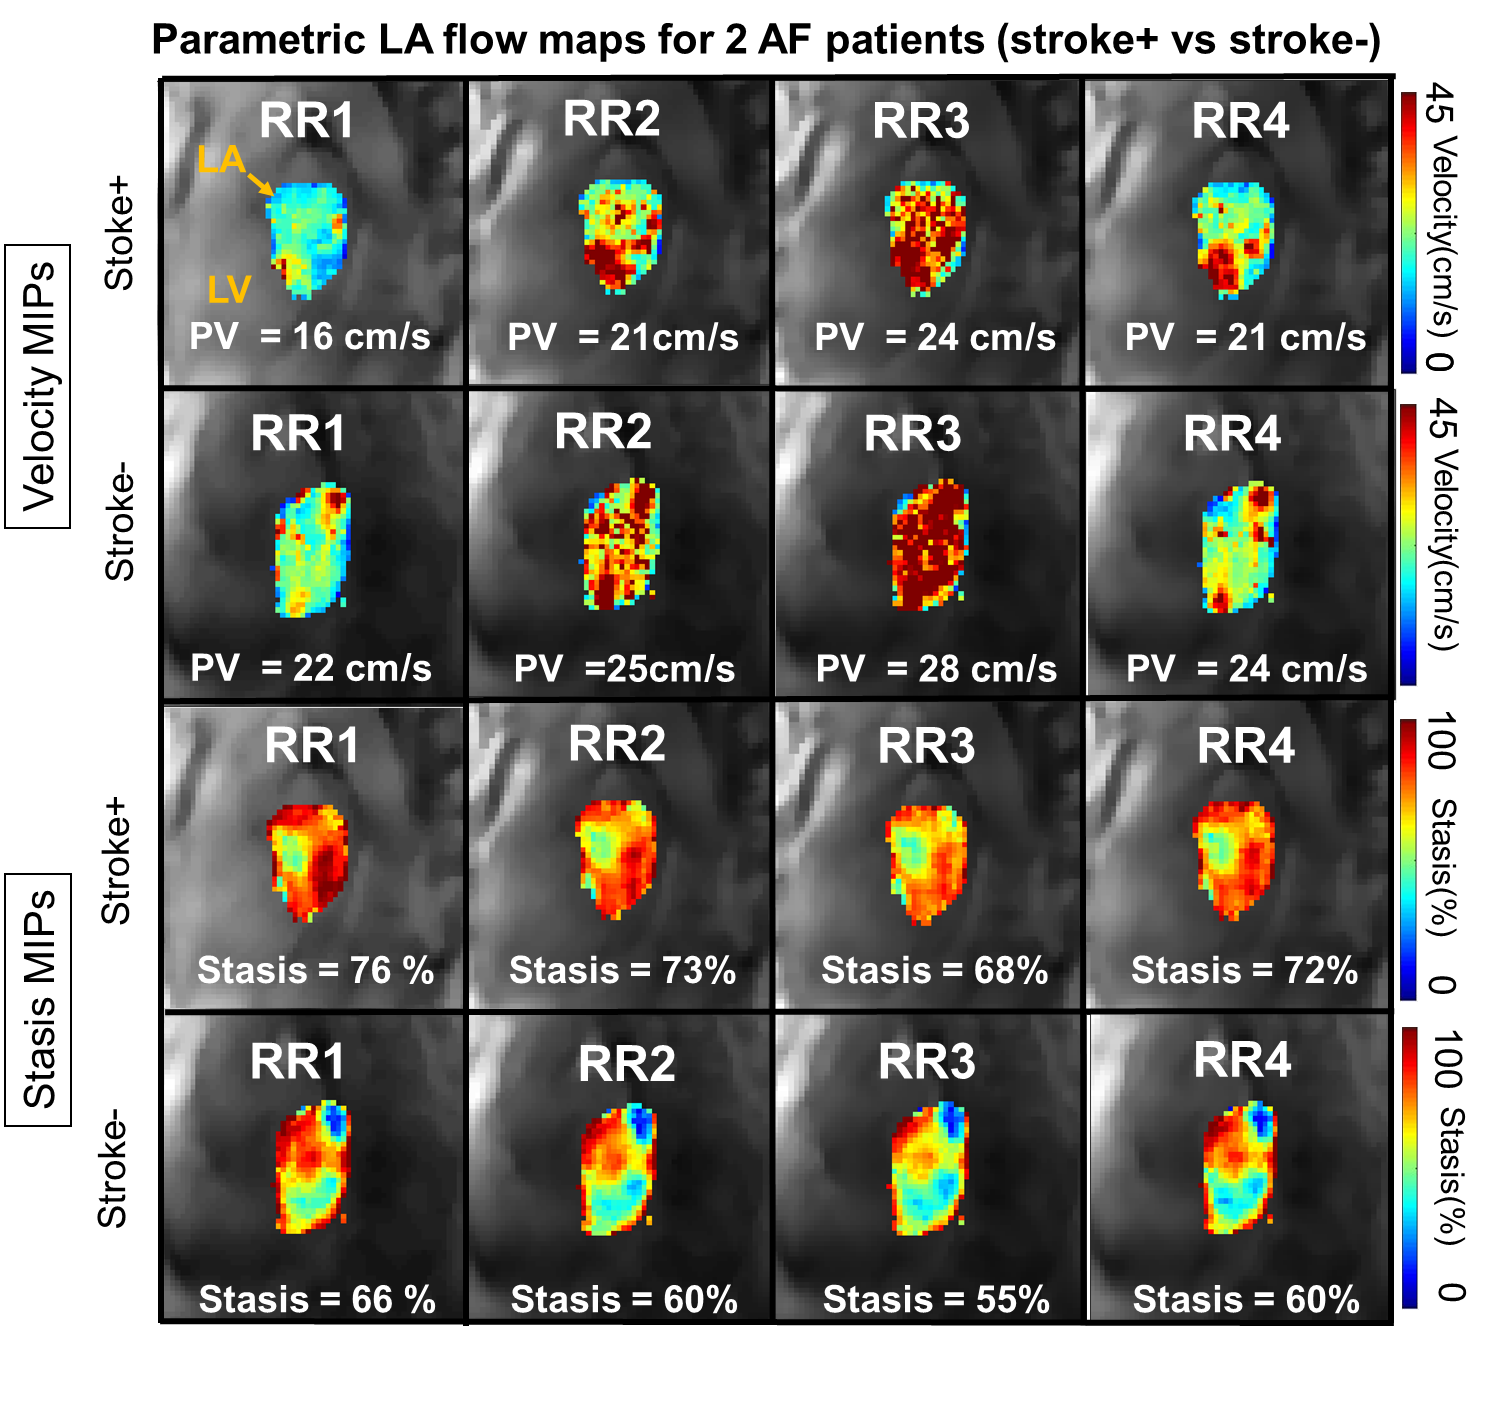
RR-resolved 5D flow data analysis included pre-processing of each RR bins data set (Fig 2). The LA was manually segmented from a derived phase contrast angiogram from RR3 bin (Mimics, Materialise, Belgium) and used for each RR bin. Blood stasis was calculated per voxel (percentage of cardiac time velocity < 10 cm/s) and mean stasis over the entire LA was calculated for each RR bin. Peak velocities were calculated as the mean of the top 5% of velocities to mitigate noise. Stasis and peak velocities were visualized by mean and maximum intensity projections (MIPs) and were compared between stroke+ and stroke- cohorts for high and low heart rate variability (Fig 3). Mean absolute percent differences between RR1 stasis and peak velocities and RR3 and RR4 were calculated within each patient for HRV-high and HRV-low stroke+ and stroke- groups.
Results
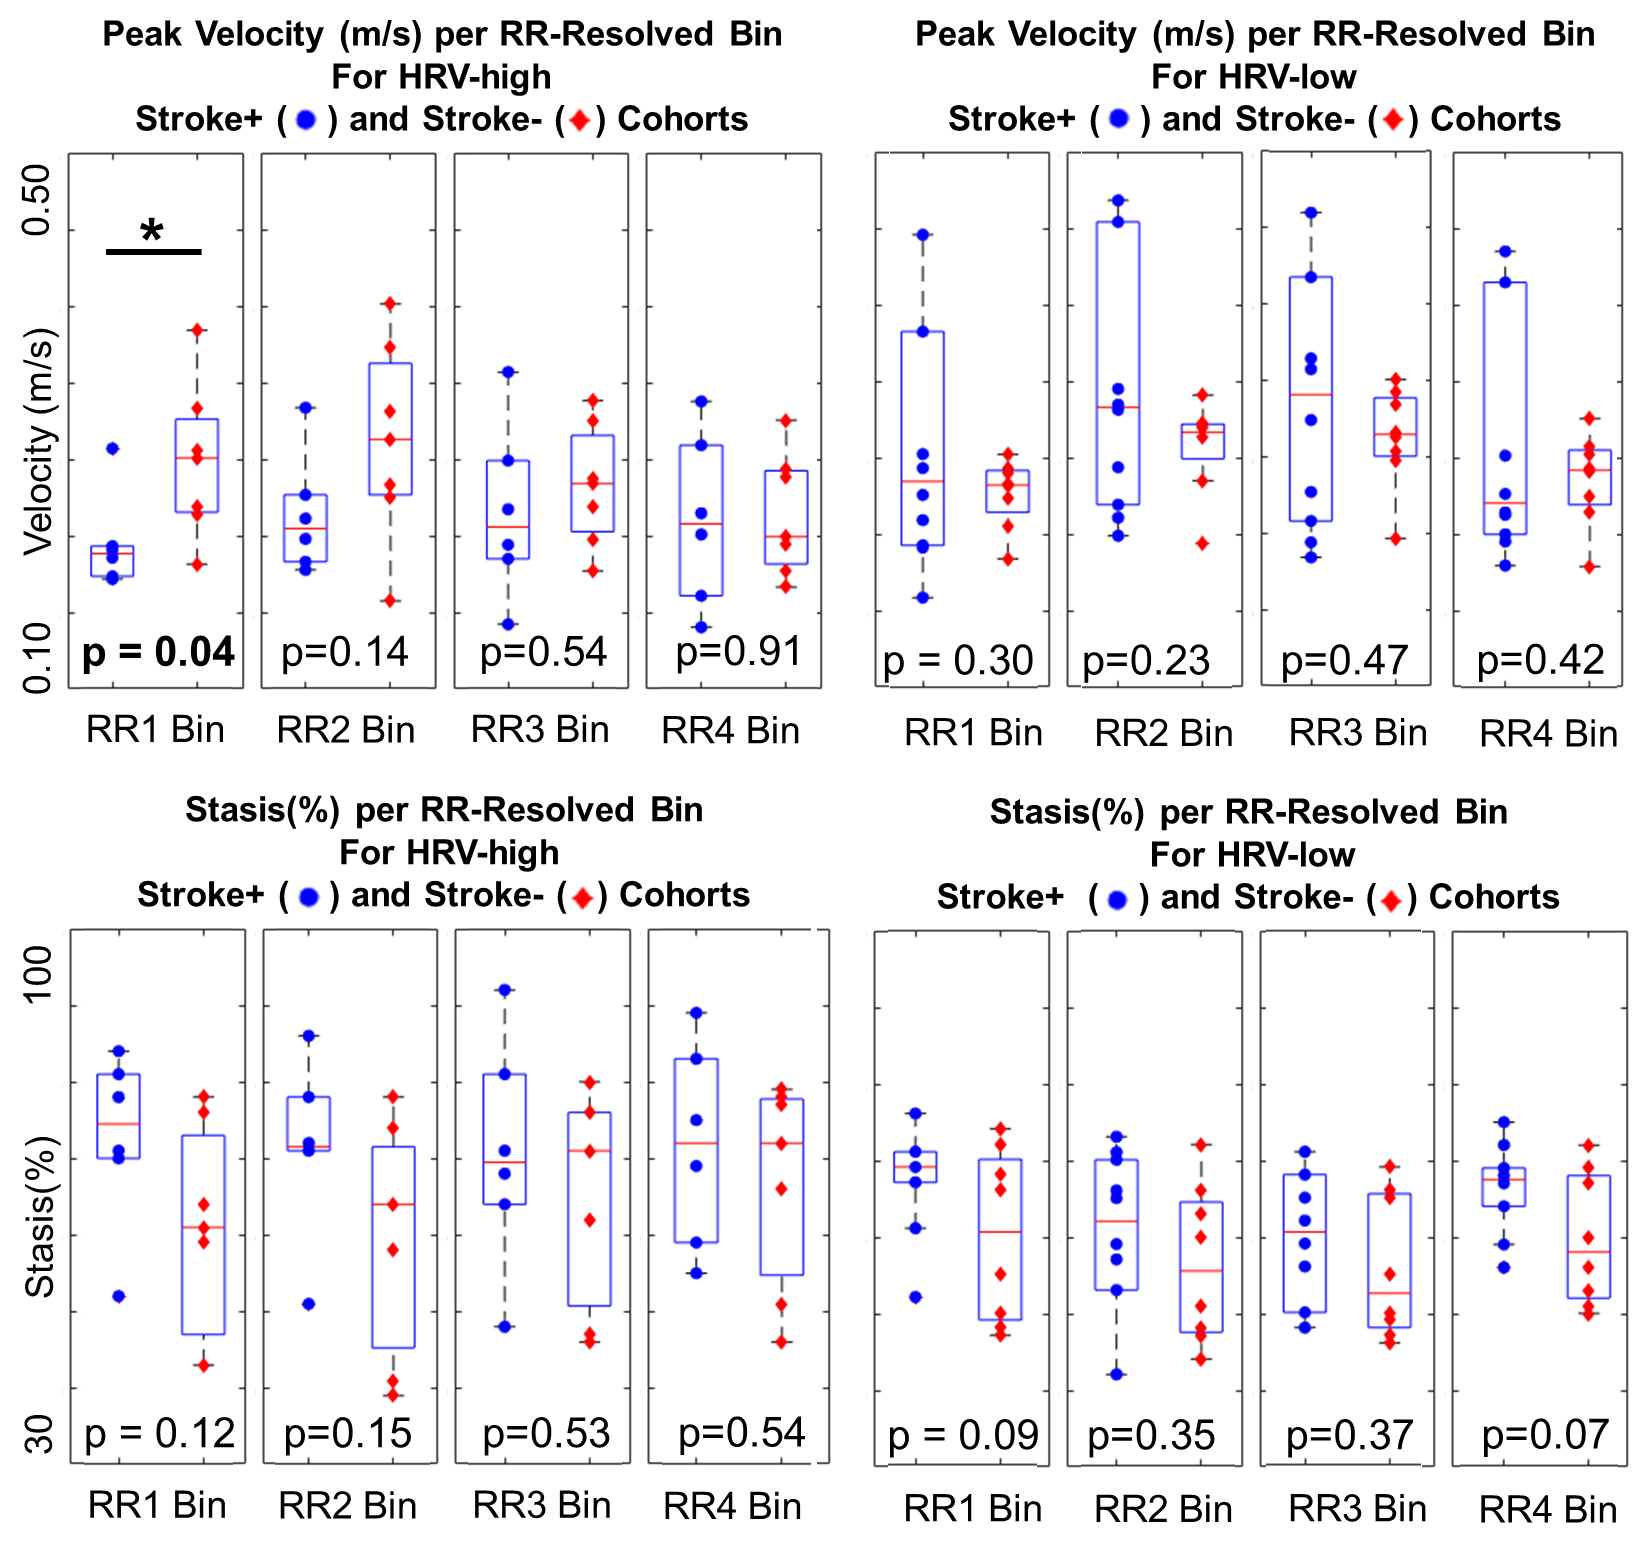
CoV analysis identified 13 patients with marked cardiac arrhythmia (HRV-high: 6 stroke+ and 7 stroke-) and 16 patients with low heart rate variability (HRV-low: 8 stroke+ and 8 stroke-). HRV-high had larger RR-variable differences (RR1 vs RR3/4) ranging from 9-18% mean absolute percent differences for peak velocity and stasis vs HRV-low RR (5-14% mean absolute percent differences). RR-resolved 5D flow demonstrated, overall, trends for lowered peak velocities and higher stasis per each RR bin in HRV-high and HRV-low for stroke+ and stroke- cohorts. More pronounced differences in LA flow measures were seen for shorter RR-interval bins (RR1,RR2) with significantly reduced peak velocities for HRV-high stroke+ vs. stroke- AF patients (0.21±0.04 m/s vs. 0.27±0.05 m/s, p<0.05). Stasis and peak velocity differences ranged from 8%-16% for stasis and 9-33% for peak velocity in the HRV-high cohort and 11-18% for stasis and 2-10% for peak velocity in the HRV-low cohort.Discussion
The findings of this study demonstrate that RR-resolved 5D Flow MRI was sensitive to detect changes in RR-interval dependent LA hemodynamics which may yield important information for understanding risks for atrial thrombus formation in patients with varying heart rates. Largest differences in peak velocity and stasis were observed between stroke history groups in the HRV-high cohort, potentially signaling an effect of arrhythmia, itself, on atrial hemodynamics and thus thromboembolic risk.Conclusion
RR-resolved 5D flow detected differences in LA flow for different RR-interval durations where most pronounced stroke vs no stroke differences for peak velocity and stasis were observed for RR1 bins. These RR-resolved difference cannot be detected by conventional 4D-flow imaging. RR-resolved 5D flow may thus be a promising novel approach for cardiovascular imaging in arrhythmic patients with potential to improve stroke risk.Acknowledgements
Research reported in this publication was supported by the National Institute Of Biomedical Imaging And Bioengineering of the National Institutes of Health under Award Number T32EB025766 and R21AG055954-02References
1)AHA/ACC/HRS Guideline for the Management of Patients With Atrial Fibrillation: A Report of the American College of Cardiology/American Heart Association Task Force on Clinical Practice Guidelines and the Heart Rhythm Society in Collaboration With the Society of Thoracic Surgeons. Circulation. 2019;140(2):e125-e151. doi:10.1161/CIR.00000000000006652.
2)Shen MJ, Arora R, Jalife J. Atrial Myopathy. JACC Basic to Transl Sci. 2019;4(5):640-654. doi:10.1016/J.JACBTS.2019.05.0053.
3)Markl M, Hennig J. Phase contrast MRI with improved temporal resolution by view sharing: K-space related velocity mapping properties. Magn Reson Imaging. 2001;19(5):669-676. doi:10.1016/S0730-725X(01)00386-14.
4)Markl M, Lee DC, Furiasse N, et al. Left Atrial and Left Atrial Appendage 4D Blood Flow Dynamics in Atrial Fibrillation. Circ Cardiovasc Imaging. 2016;9(9):e004984. doi:10.1161/CIRCIMAGING.116.0049845.
5)Handke M, Harloff A, Hetzel A, Olschewski M, Bode C, Geibel A. Left Atrial Appendage Flow Velocity as a Quantitative Surrogate Parameter for Thromboembolic Risk: Determinants and Relationship to Spontaneous Echocontrast and Thrombus Formation–A Transesophageal Echocardiographic Study in 500 Patients with Cerebral Ischemia. J Am Soc Echocardiogr. 2005;18(12):1366-1372. doi:10.1016/J.ECHO.2005.05.0066.
6)Ma L, Yerly J, Sopra L Di, et al. Using 5D flow MRI to decode the effects of rhythm on left atrial 3D flow dynamics in patients with atrial fibrillation. Magn Reson Med. 2021;85(6):3125-3139. doi:10.1002/MRM.286427.
7)Tateno K, Glass L. Automatic detection of atrial fibrillation using the coefficient of variation and density histograms of RR and ΔRR intervals. Med Biol Eng Comput. 2001;39(6):664-671. doi:10.1007/BF02345439
Figures