0212
BBB water exchange rate and permeability mapping with multi-delay diffusion weighted pseudo-continuous arterial spin labeling1Laboratory of FMRI Technology (LOFT), Mark & Mary Stevens Neuroimaging and Informatics Institute, Keck School of Medicine, University of Southern California, Los Angeles, CA, United States
Synopsis
We proposed a new sequence which improves the SNR of diffusion weighted ASL signals, and simultaneously estimates kw, water extraction ratio (Ew) and PSw using a multi-delay approach with PLDs ranging from 1500 to 2700 msec. Whole brain average CBF = 67.8±6.7 ml/100g/min, kw = 103.7±16.6 min-1, Ew = 94.8±1.3% and PSw = 202.2±41.3 ml/100g/min. These results match the recent literatures on kw and PSw studies. Ew ~95% suggests two long PLDs of 2400 and 2700 msec are sufficient to allow complete water extraction.
Background
Measuring water exchange rate (kw) across the blood-brain barrier (BBB) and permeability surface product of water (PSw) could assess different aspects of BBB function at the early stage of disease progression. A non-invasive single-shot diffusion-prepared pseudo-continuous arterial spin labeling (DP-pCASL) technique has been proposed to quantify kw without the use of gadolinium-based contrast agents (GBCAs)1. However, T2 decay and non-CPMG de-phasing of the diffusion preparation module leads to more than half signal loss. The goal of this study is to introduce a sequence which improves the SNR of diffusion weighted ASL signals, and simultaneously estimates kw, water extraction ratio (Ew) and PSw using a multi-delay approach with PLDs ranging from 1500 to 2700 msec2.Methods
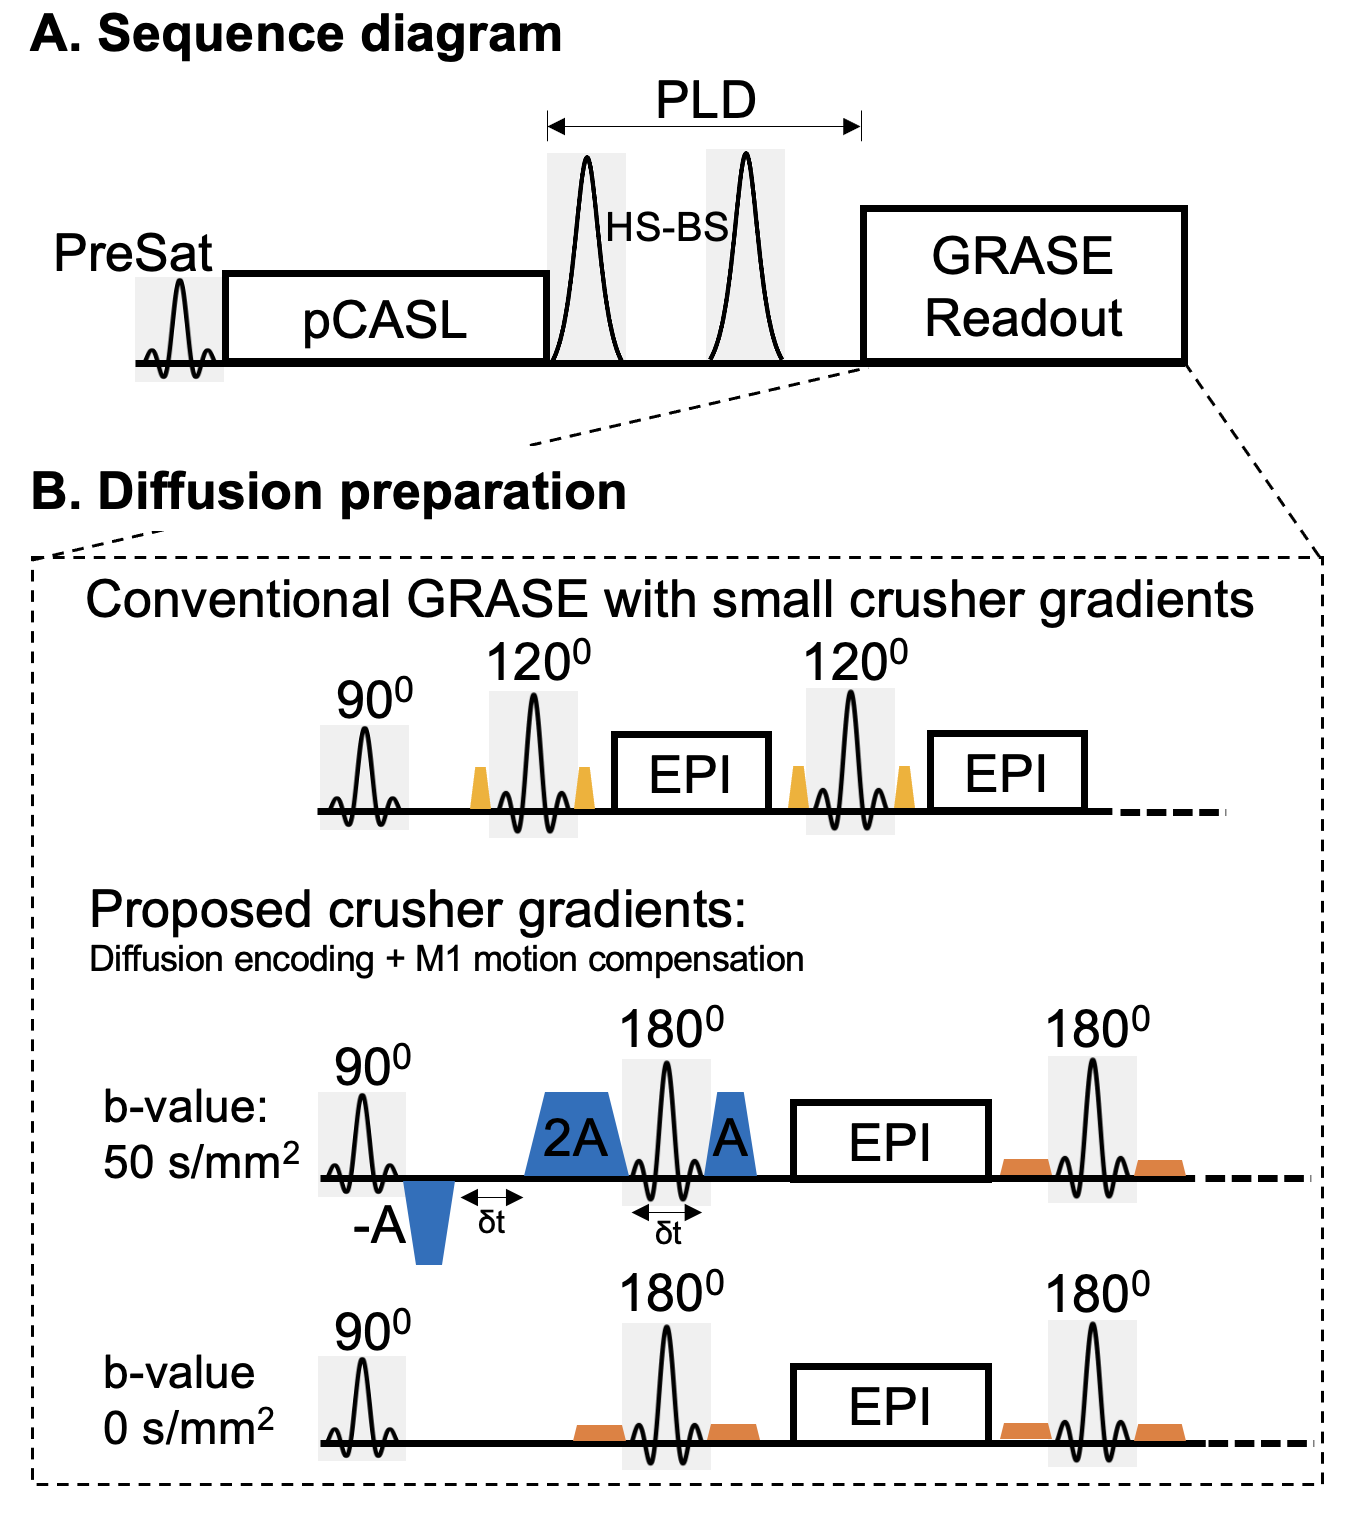
kw quantification requires estimation of the vascular (ΔMc) and tissue (ΔMb) compartments of the ASL signal. Due to the large (pseudo)-diffusion coefficients difference between the two compartments (~100 fold), a small diffusion (b=50s/mm2) weighting nulls ΔMc signal while has minimal impact on ΔMb. ΔMc can be calculated as the difference between ASL signal with (ΔMDW>0) and without (ΔMDW=0) diffusion weighting1. However, bulk head movement induces additional random phases in the presence of diffusion gradients and leads to shading artifacts in 3D Gradient-and-Spin-echo (GRASE) images. A non-CPMG diffusion preparation module has been utilized in the previous study at the cost of half signal loss and lower spatial resolution1.Crusher gradients of GRASE readout are applied to eliminate unwanted stimulated echoes while has minimal diffusion weighting due to small gradient moment (Fig. 1B yellow lobes). We propose to replace the original slice crusher pairs of the first refocusing pulse by M1-motion compensated gradients with increased amplitudes to achieve sufficient diffusion weighting (Fig. 1B blue lobes) at the cost of longer echo time (TE). Gradient amplitude=37mT/m, and gradient duration=3.9/7.8 msec for A/2A lobes. δt=3.2msec and effective b-value=48.4 sec/mm2. Crusher pairs of the rest of refocusing pulses were flattened to maintain echo-spacing with b-value<0.1s/mm2 (Fig. 1B orange lobes).
We demonstrated that kw can be calculated from ΔMc signals acquired at multiple PLDs according to the single-pass approximation (SPA) model2,3:
$$\Delta Mc(t)=-\frac{2\varepsilon \cdot CBF \cdot M_0}{\lambda (kw+R_{1a})} \cdot e^{kw \cdot ATT} \cdot (e^{-(kw+R_{1a})(t-\delta)} - e^{-(kw+R_{1a})t})...[1]$$
where ε is labeling efficiency (0.9), λ is the partition coefficient of water in the brain (0.9g/ml), R1a is the longitudinal relaxation rate (0.6sec-1), δ is labeling duration (1.5sec). The unknown parameter kw can be solved from ΔMc(δ+PLD) at multiple time PLDs. Equation [1] can be simplified by applying log function to both sides:
$$ln(\Delta Mc(t))=A+S \cdot t...[2]$$
where
$$A=ln(-\frac{2\varepsilon \cdot CBF \cdot M_0}{\lambda (kw+R_{1a})} \cdot e^{kw \cdot ATT} \cdot (e^{(kw+R_{1a})\delta} - 1))...[3]$$
$$S=-(kw+R_{1a})...[4.1]$$ or $$kw=-S-R_{1a}...[4.2]$$
Thus, kw can be calculated by estimating the slope of ln(ΔMc(t)) at multiple PLDs.
According to the Renkin-Crone equation, PSw can be calculated based on Ew and CBF:
$$PSw=-ln(1-Ew) \cdot CBF...[5]$$
To estimate Ew, a long PLD is usually required to allow complete extraction of labeled water into tissue space:
$$Ew=\frac{\Delta Mb(longPLD)}{\Delta Mc(longPLD)+\Delta Mb(longPLD)}...[6]$$
Three healthy subjects (2 male, age=29.7±1.5 years) underwent MRI on a Siemens 3T Prisma system (Erlangen, Germany) using a 32-channel head coil. Imaging parameters were: FOV=224mm, matrix size=64×64, 36 slices (20% oversampling), resolution=3.5 mm3 isotropic, 3-fold acceleration (partition) with TGV reconstruction4, TE=43.4msec, TR=4800msec, label duration=1800msec. pCASL was acquired with and without diffusion weighting at five PLDs = 1500, 1800, 2100, 2400 and 2700msec, respectively. Eighteen label/control pairs were acquired for each b value/PLD, TA=29min56sec. CBF was calculated from 5 PLDs5. DP-pCASL (3.5×3.5×8mm3, 12 slices, 10 min) was also acquired for comparison1.
Results and discussion
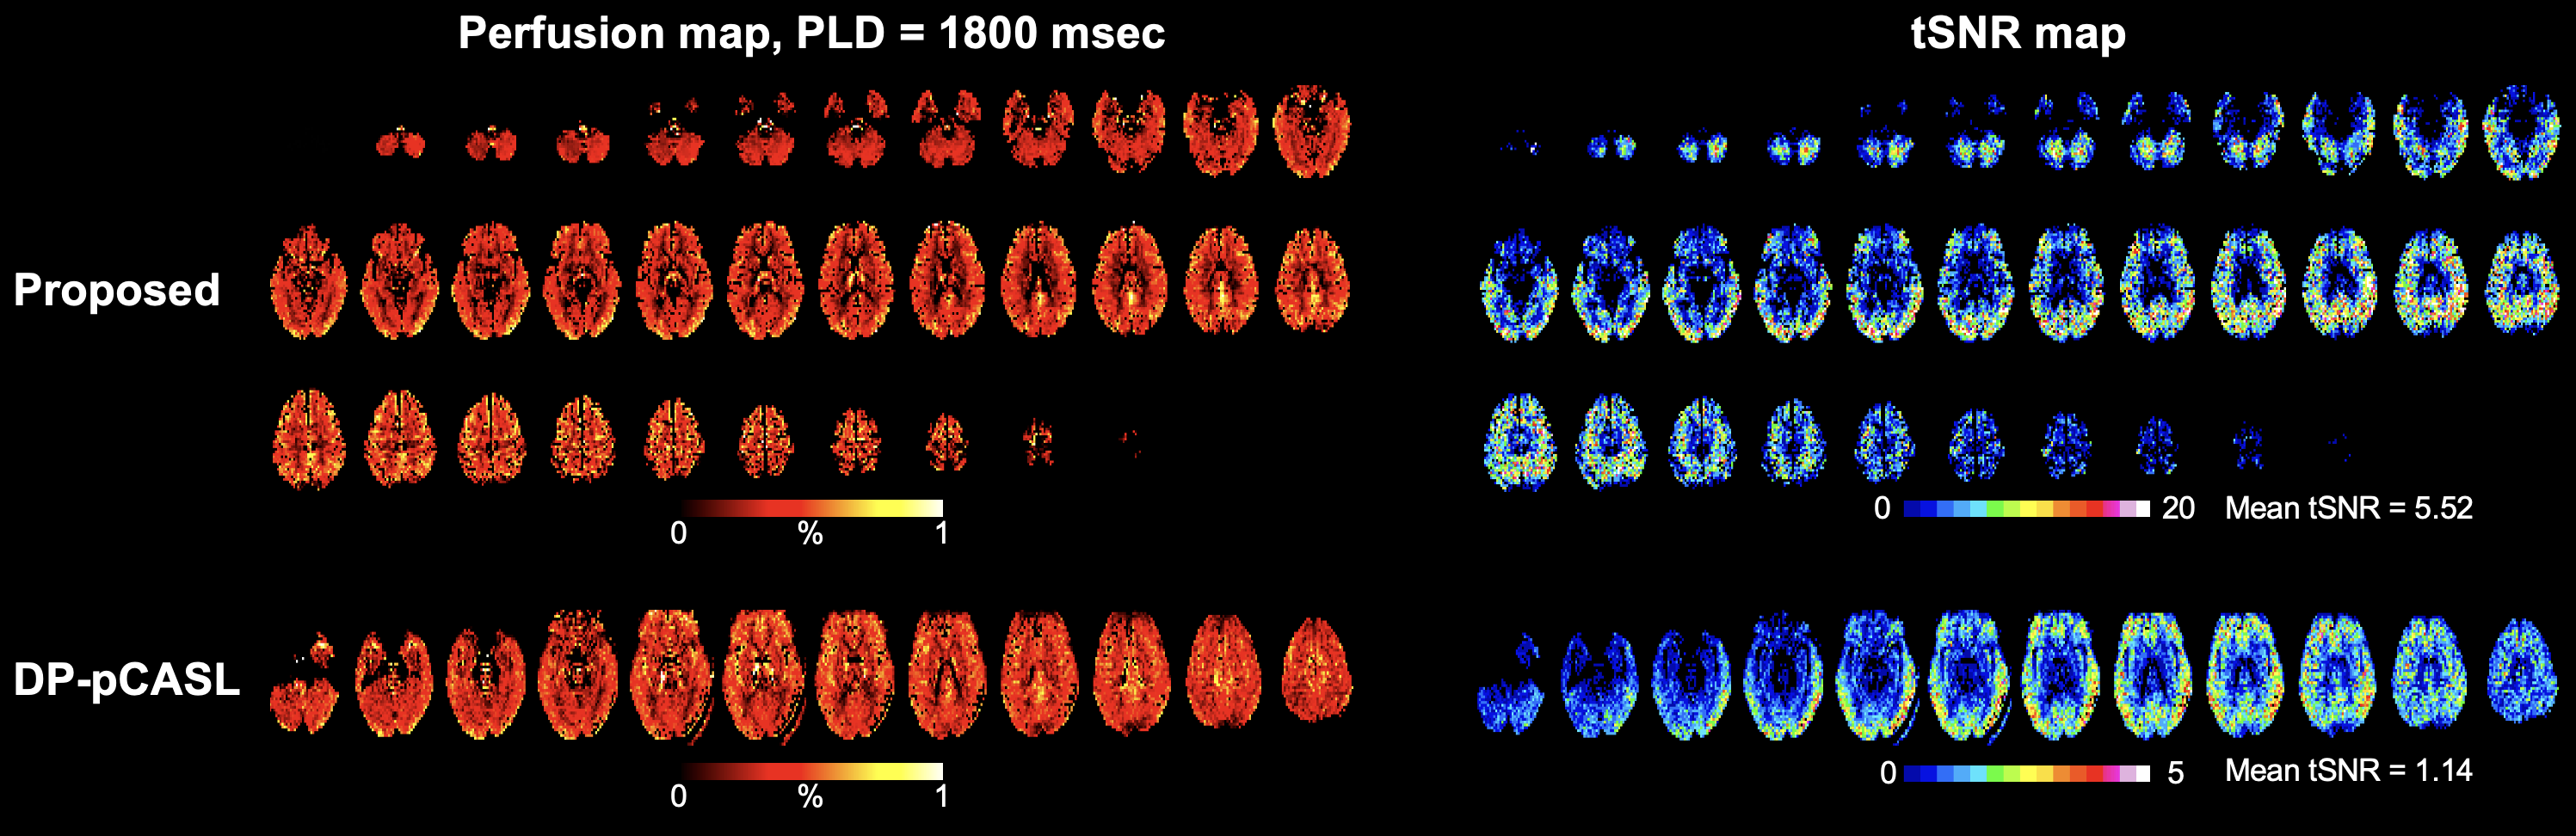
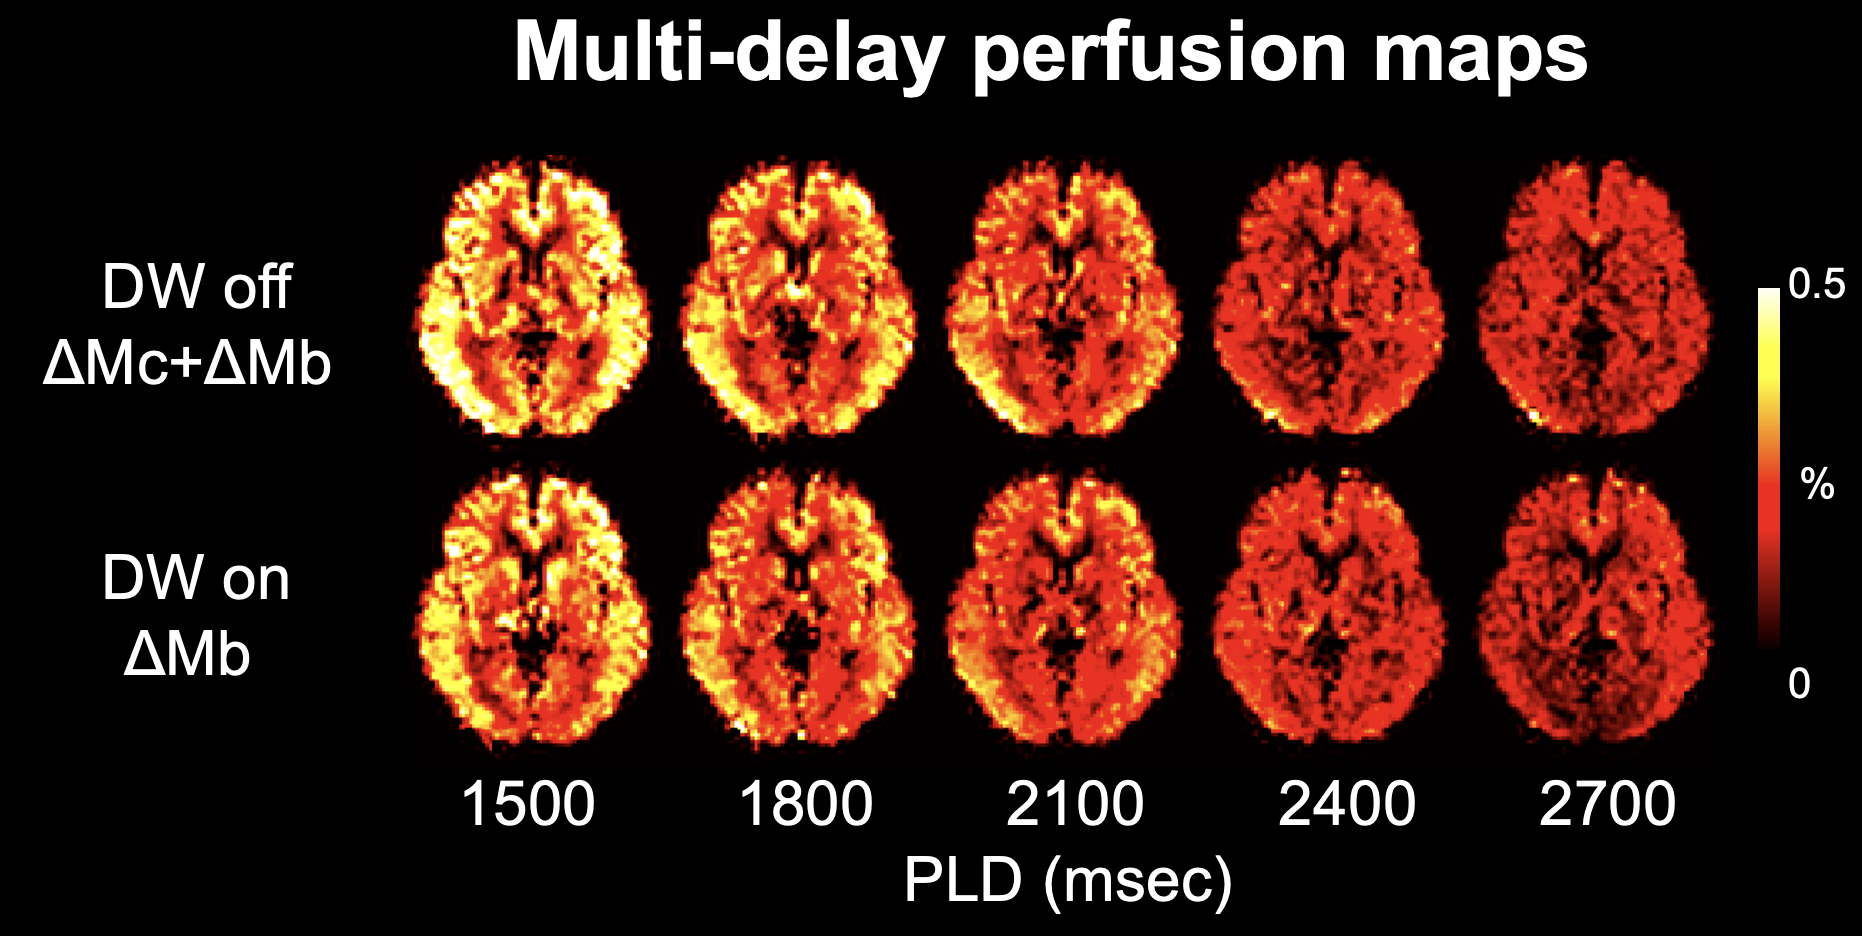
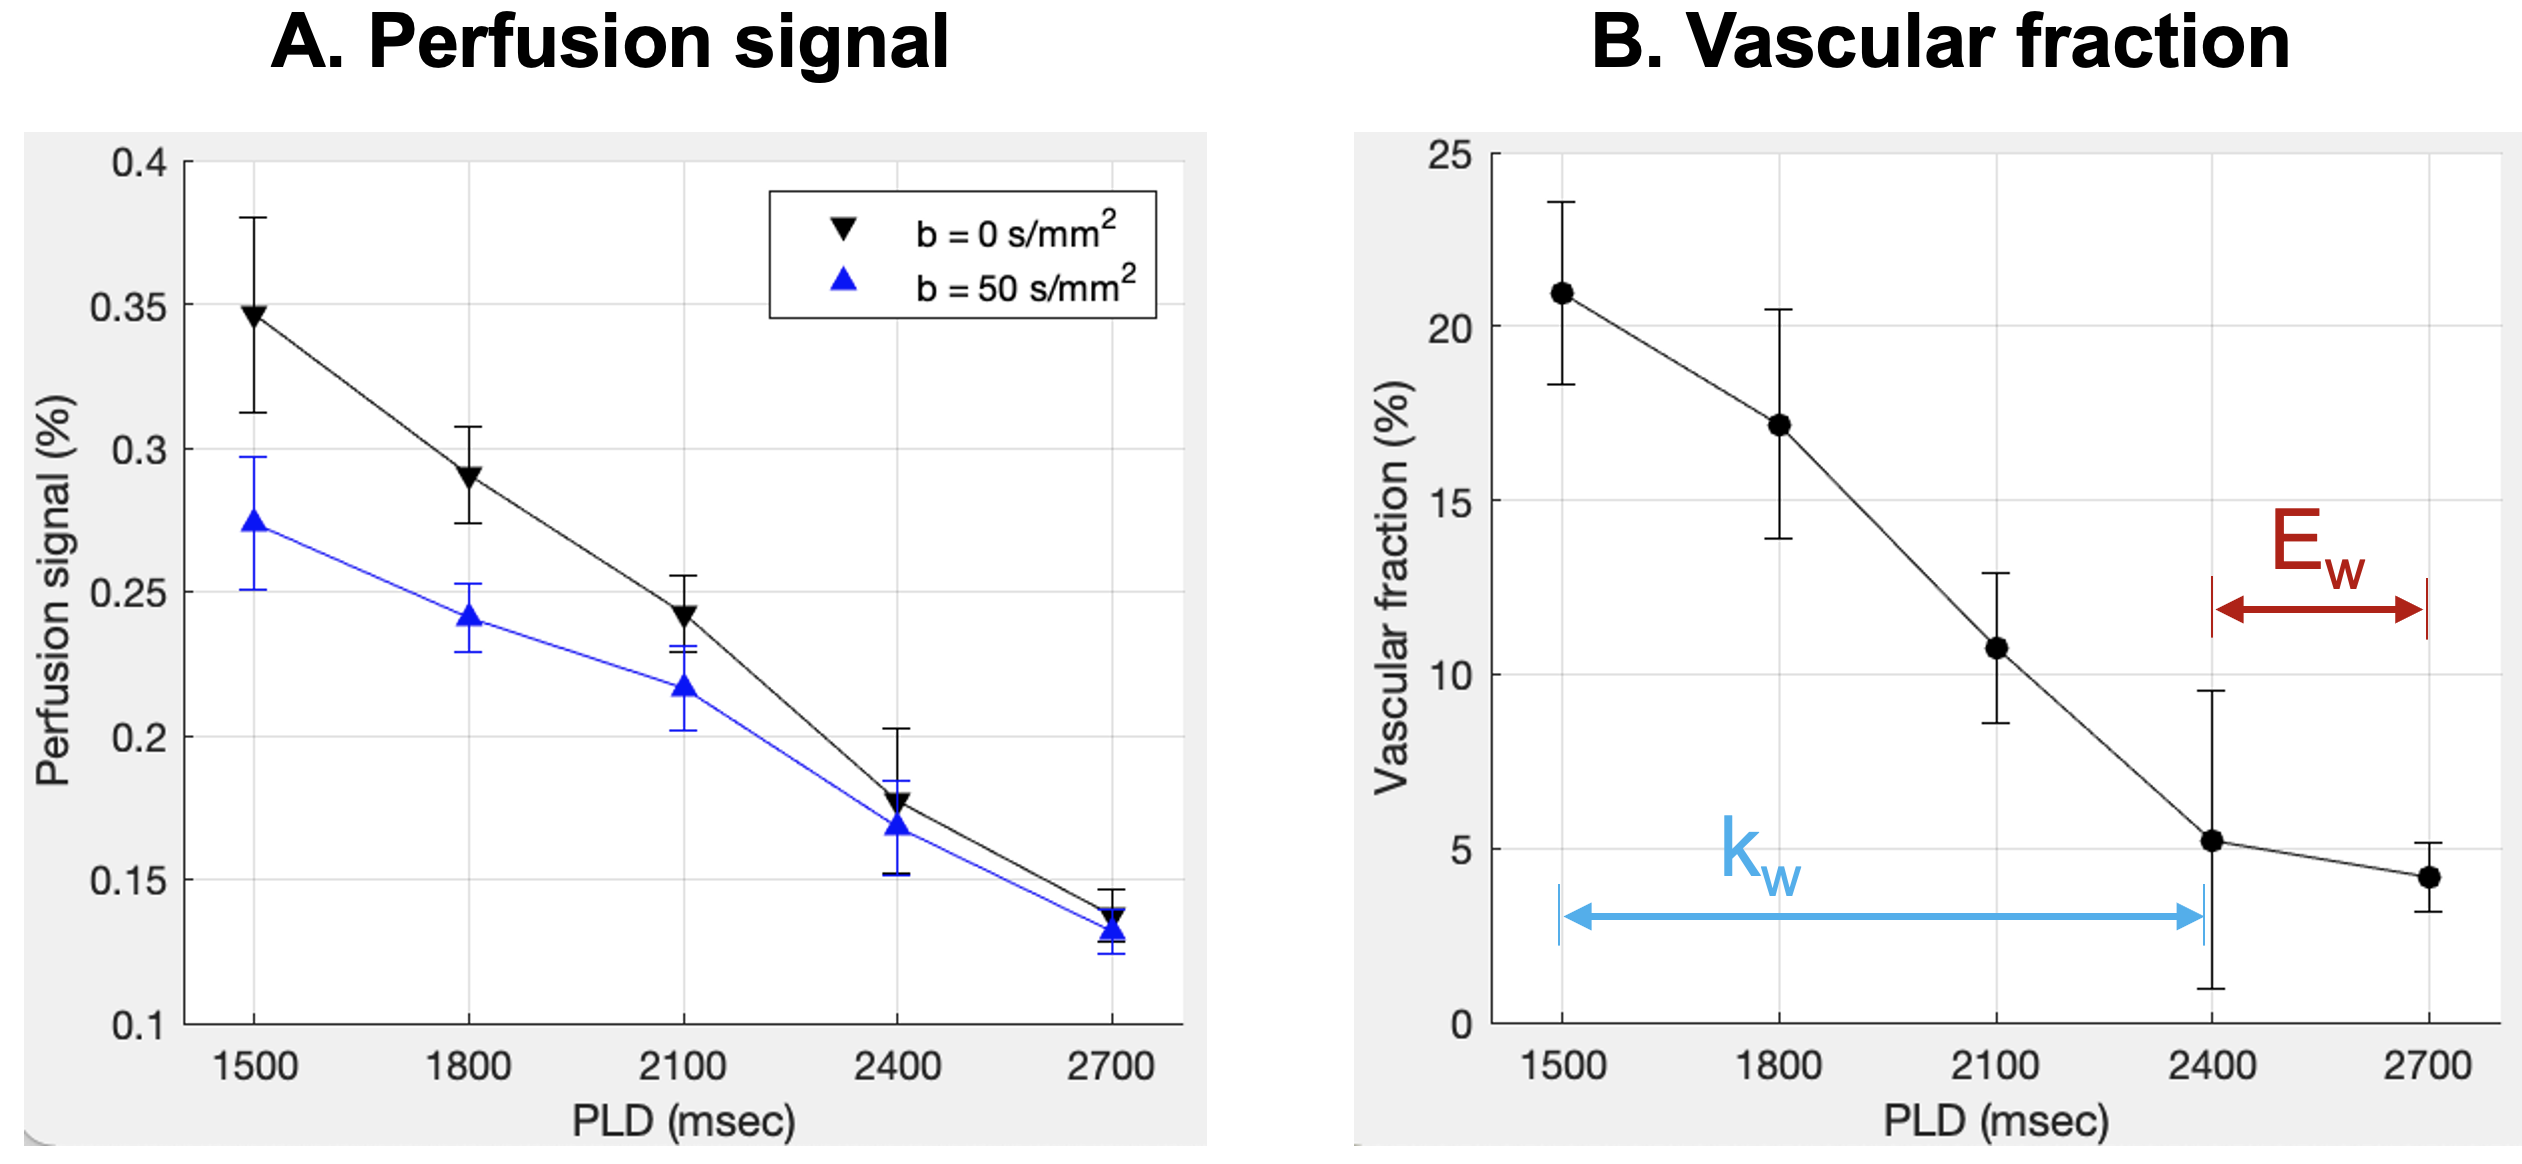
Fig.2 shows perfusion and tSNR maps acquired by the proposed technique (top) and DP-pCASL (bottom). Two times more slices were acquired by the proposed technique. Whole brain tSNR of the perfusion signals acquired by the proposed technique (5.52) was ~4-fold higher as compared to DP-pCASL tSNR (1.14), which allows reliable ASL measurements at long PLDs.Fig. 3 shows one representative slice of perfusion signal acquired at five PLDs without (top) and with (bottom) diffusion weighting. Signal decay can be observed with DW on, which indicates nulled ΔMc signal. The difference becomes smaller at longer PLDs. Fig. 4A shows the scatter plot of GM perfusion signals acquired at five PLDs with and without DW, and Fig. 4B shows the vascular fraction, which decays fast from PLD=1500 to 2400 msec, and stabilize ~5% at PLD=2400/2700 msec. Perfusion signals at PLD = 2400/2700 msec were averaged to calculate Ew and PSw (Eq. [5,6]), and kw was quantified from perfusion signals acquired at earlier PLDs (1500-2400 msec) (Eq. [4]).
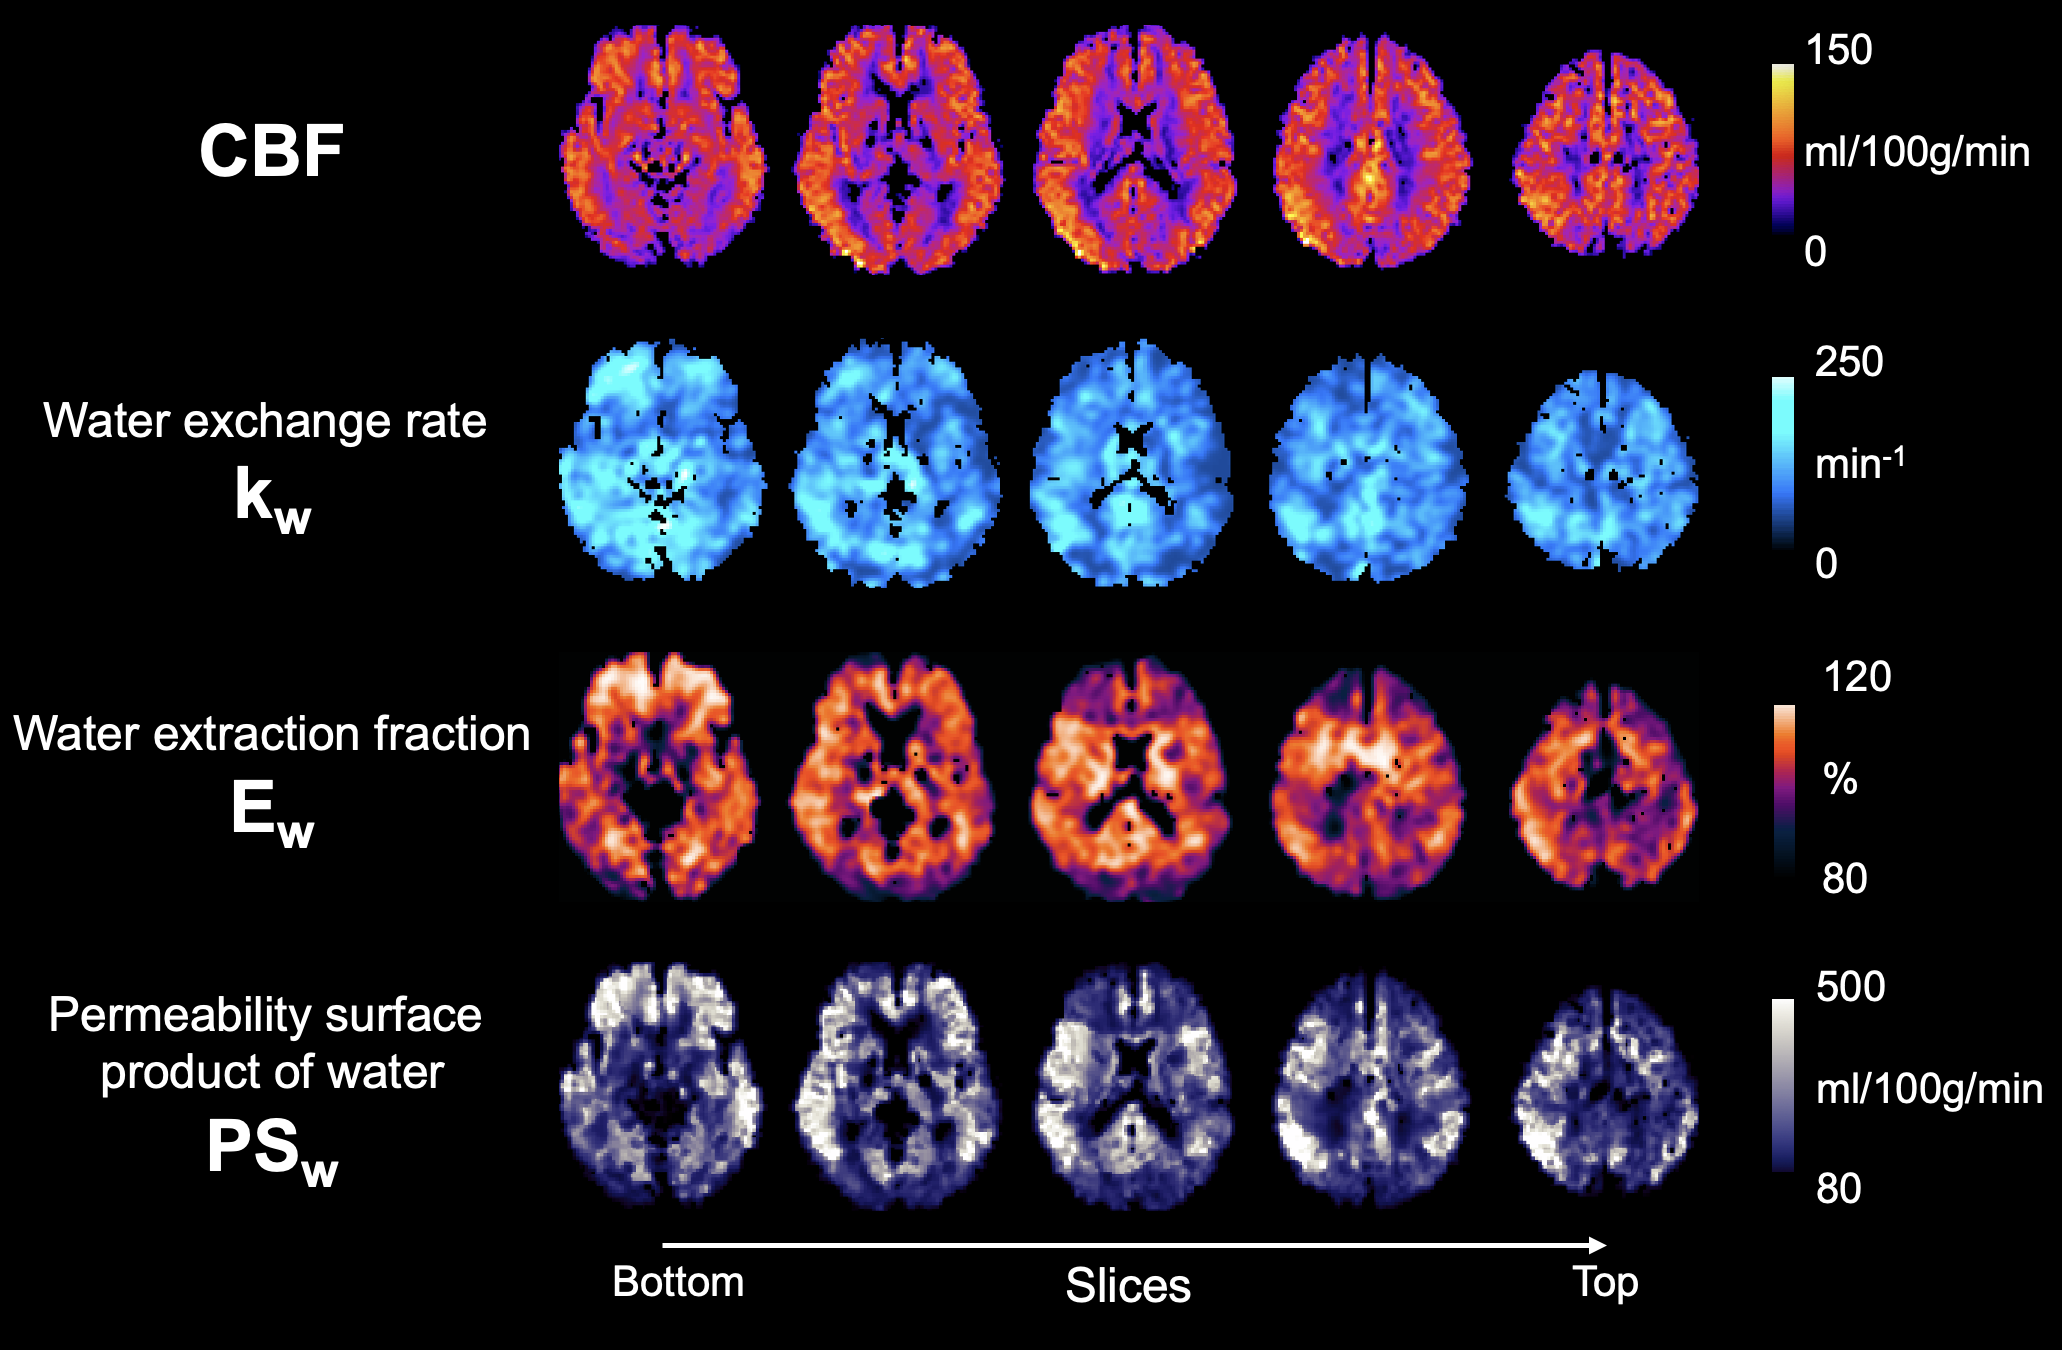
Fig. 5 shows center five slices of CBF, kw, Ew and PSw maps simultaneously acquired by the proposed technique. Whole brain average CBF = 67.8±6.7 ml/100g/min, kw = 103.7±16.6 min-1, Ew = 94.8±1.3% and PSw = 202.2±41.3 ml/100g/min. These results match the recent literatures on kw and PSw studies1,6. Ew ~95% suggests two long PLDs of 2400 and 2700 msec are sufficient to allow complete water extraction. Future validations studies are needed to investigate kw and PSw changes in neurological diseases.
Conclusion
We proposed a new sequence which significantly improves SNR of diffusion weighted ASL signals, and simultaneously acquire whole brain CBF, kw, Ew and PSw maps using a multi-delay approach.Acknowledgements
This work was supported by National Institute of Health (NIH) grant UH3-NS100614, R01-NS114382 and R01-EB028297.References
1. X. Shao et al., Mapping water exchange across the blood-brain barrier using 3D diffusion-prepared arterial spin labeled perfusion MRI. Magn Reson Med 81, 3065-3079 (2019).
2. X. Shao, D. J. Wang (2021) High resolution BBB water exchange rate mapping with multi-delay diffusion prepared pseudo-continuous arterial spin labeling. in ISMRM, p 1085.
3. K. S. St Lawrence, D. Owen, D. J. Wang, A two-stage approach for measuring vascular water exchange and arterial transit time by diffusion-weighted perfusion MRI. Magn Reson Med 67, 1275-1284 (2012).
4. S. M. Spann et al., Robust single-shot acquisition of high resolution whole brain ASL images by combining time-dependent 2D CAPIRINHA sampling with spatio-temporal TGV reconstruction. NeuroImage 206, 116337 (2020).
5. D. C. Alsop et al., Recommended implementation of arterial spin‐labeled perfusion MRI for clinical applications: a consensus of the ISMRM perfusion study group and the European consortium for ASL in dementia. Magnetic resonance in medicine 73, 102-116 (2015).
6. Z. Lin et al., Non-contrast MR imaging of blood-brain barrier permeability to water. Magn Reson Med (2018).
Figures