0211
First in vivo Myocardial Perfusion Measurements using Intra-arterial Spin Labeling during MR-guided Coronary Interventions in Pigs1Dept. of Radiology, Medical Physics, Medical Center University of Freiburg, Faculty of Medicine, University of Freiburg, Freiburg, Germany, 2German Consortium for Translational Cancer Research Partner Site Freiburg, German Cancer Research Center (DKFZ), Heidelberg, Germany, 3Dept. of Cardiology and Angiology I, University Hospital Freiburg and Faculty of Medicine, University of Freiburg, Freiburg, Germany
Synopsis
Arterial spin labeling (ASL) provides a method for myocardial perfusion quantification without exogenous contrast agents. In MR-guided coronary catheterizations, perfusion measurements can provide a valuable tool to diagnose myocardial perfusion deficits and monitor the success of the intervention. In these interventions, catheters are usually visualized by active receive RF coils attached to the catheter. Using these active coils in transmit mode would enable intra-arterial spin labeling (iASL) in the coronary arteries with an increased labeling efficiency compared to conventional ASL. Here, we show the first in vivo results using iASL for myocardial perfusion measurements during coronary interventions in pigs.
Introduction
Arterial spin labeling (ASL) provides a method for myocardial perfusion quantification that does not necessitate any exogenous contrast agent1,2. Myocardial ASL is challenging because the low labeling efficiency leads to low a SNR, and the need for motion compensation methods like ECG-triggering further reduces the sampling efficiency. In MR-guided coronary catheterizations3–5, perfusion measurements can provide a valuable tool to diagnose myocardial perfusion deficits and to monitor the success of the intervention. In these interventions, catheters are usually visualized by active receive RF coils that are attached to the catheter tip. Using these active coils in transmit mode would enable intra-arterial spin labeling (iASL) in the coronary arteries with an increased labeling efficiency compared to conventional myocardial ASL and it would enable selective perfusion measurements. Recently, we demonstrated the feasibility of catheter-based ASL in vitro6. Here, we show the first in vivo results using iASL for myocardial perfusion measurements during coronary interventions in pigs.Methods
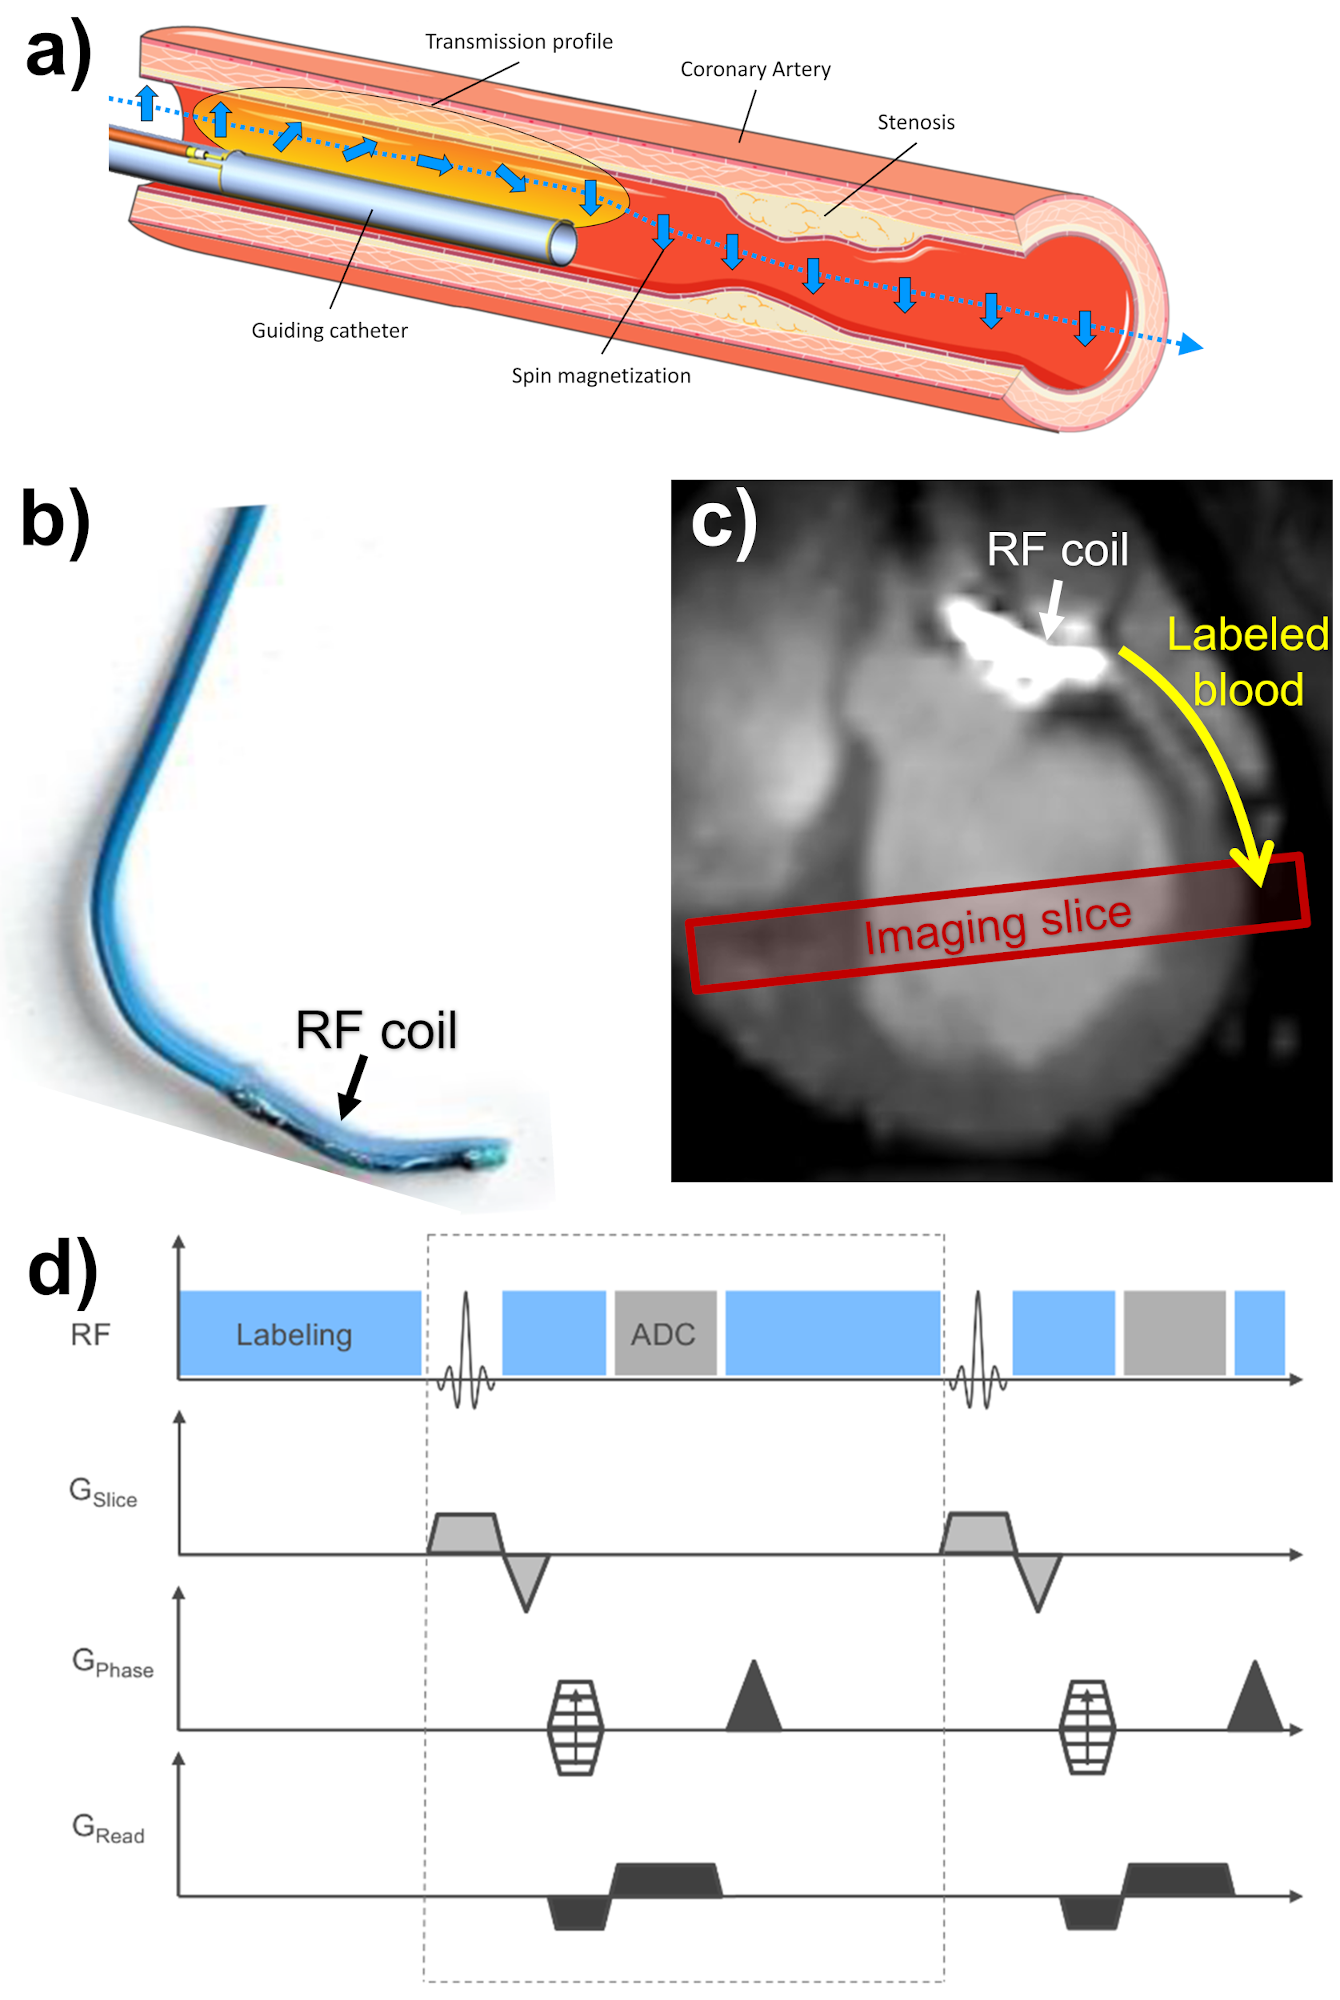
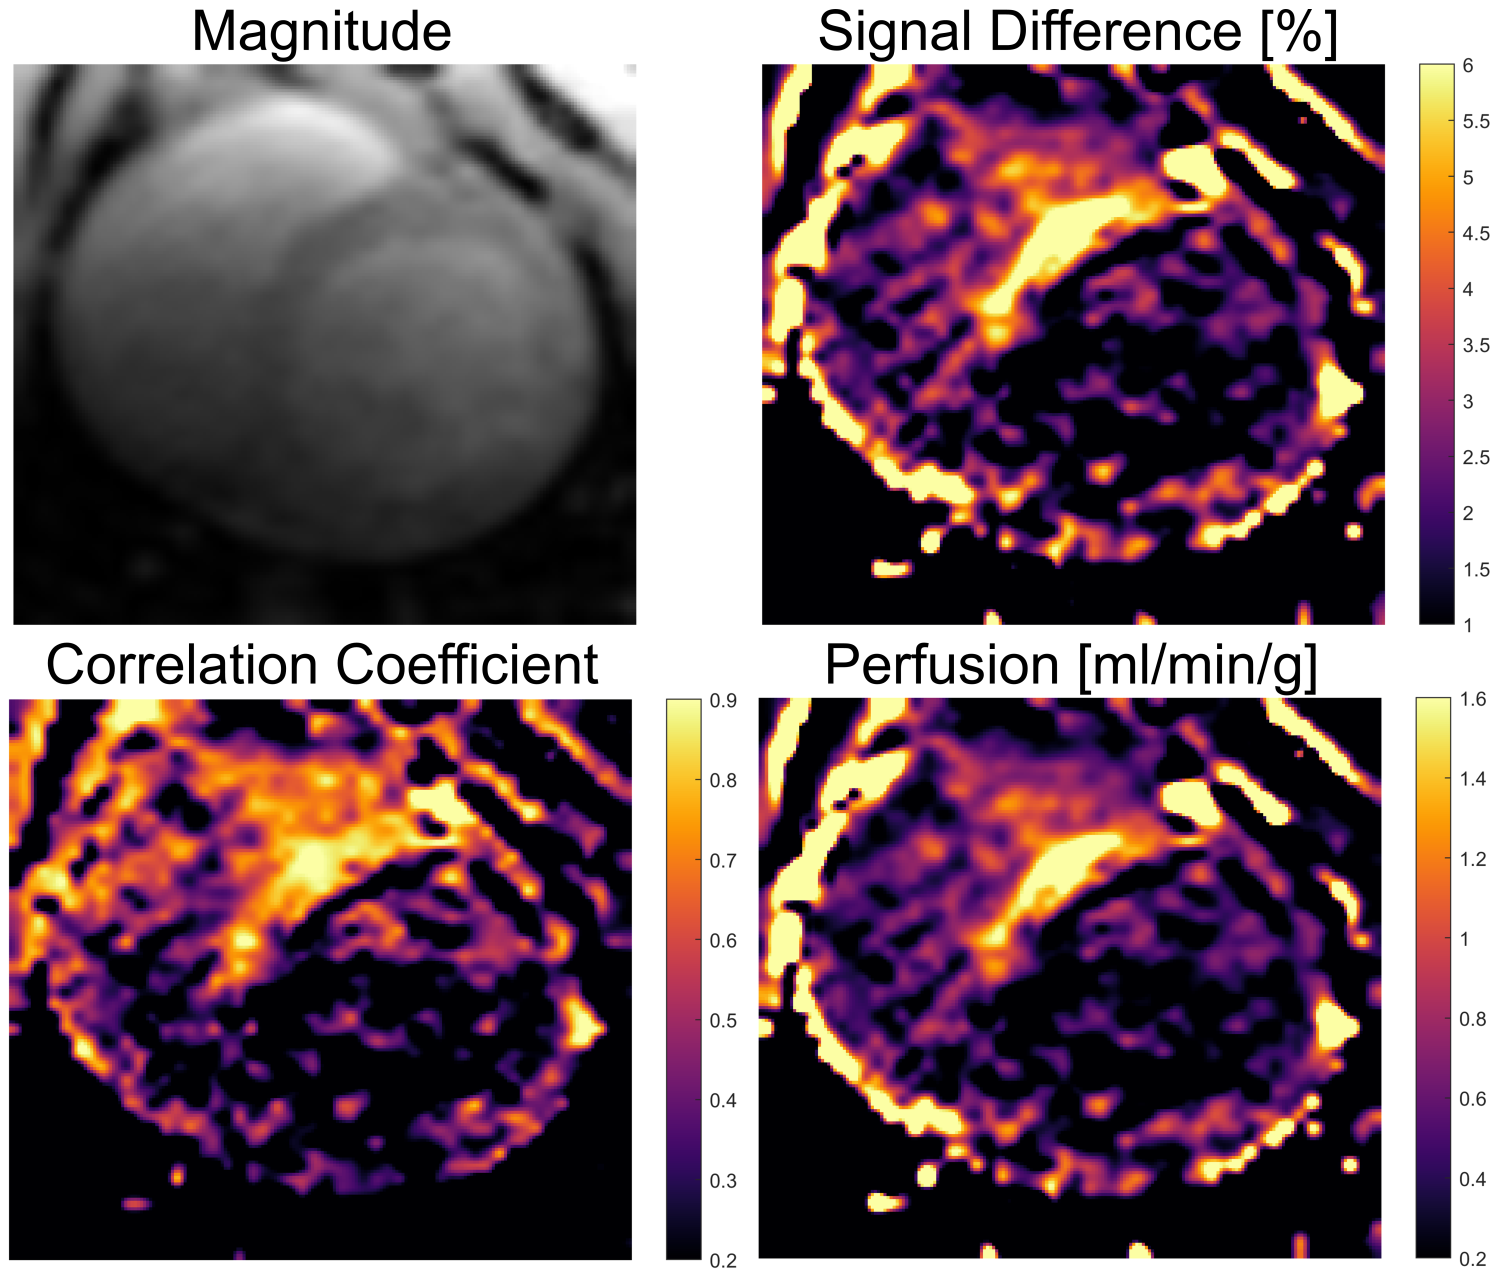
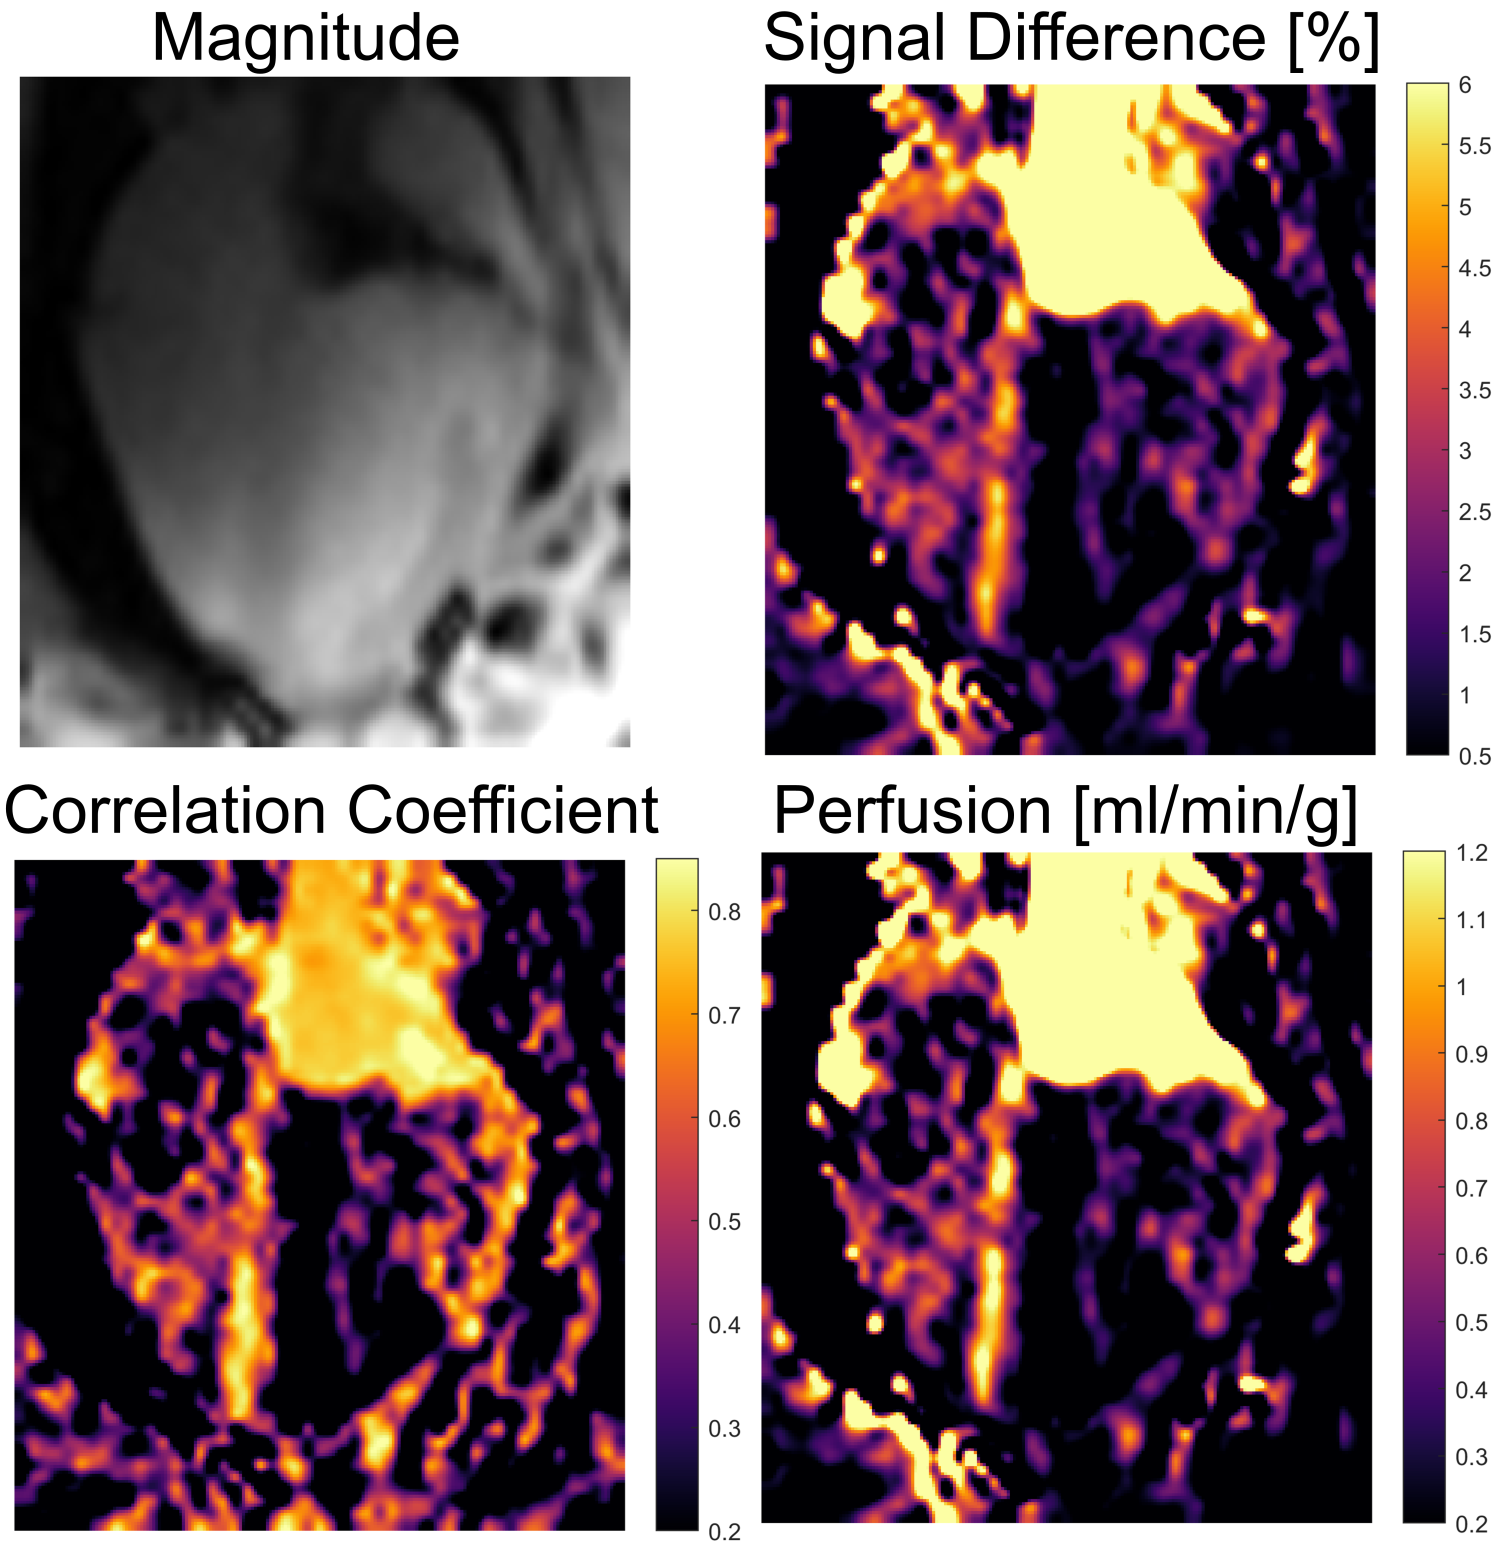
In vivo iASL experiments were performed at a clinical 3T MRI system (PRISMA fit, Siemens) during an interventional cardiovascular MRI study5,7. A commercial 5F catheter (Terumo Radial Tiger, Fig.1b) was equipped with a 2 cm long single loop RF coil for both active visualization in receive mode (Fig.1c) and spin labeling in transmit mode. The catheter was engaged in the left coronary artery (LCA) via a femoral access during real-time MR imaging. The successful intubation of the LCA was verified using a selective perfusion measurement by injecting a 2 ml bolus of 10% solution of gadolinium-(Gd)-based contrast agent (ProHance, Bracco). After that, the catheter was switched to transmit mode for the iASL experiment by connecting to a signal generator (N5181A/MXG, Agilent) via a tuning/matching circuit and the frequency was set to 123MHz (precision: 1 Hz). The iASL measurements were performed during manually induced breath-hold using a FLASH sequence in short-axis view. The sequence was gated to end-diastole and one image per heart cycle was acquired (TR=4.6ms, TE=1.6ms, a=7°, matrix=128x128, FOV=250x250mm², SL=7mm, BW=300Hz/px). The sequence was modified to provide an optical gating signal (550 ms) during conventional RF excitation via the body coil to gate the output of the signal generator – thus, RF transmission for spin labeling was activated at all times except during RF excitation of the imaging slice and data acquisition (Fig1c). For increased labeling efficiency a 2ms-long labeling period was appended at the end of each TR. Three iASL experiments were performed in two animals. In the first experiment, labeling was on during the first 15 images and turned off during 15 images. The measurement was repeated with the same sequence in long-axis view. In the second animal, a more complex pattern was used similar to the activation paradigms in fMRI: every 10 images, the labeling was turned on/off (40 images in total). Qualitative perfusion maps were calculated from the difference images ΔS between labeling and baseline. In addition, a map of the correlation of the signal intensity to the binary labeling paradigm was created similar to correlation angiography8. Quantitative perfusion maps were calculated according to:$$ f=\frac{\lambda}{2\alpha T_{1}}\frac{\Delta S}{S_{0}}\frac{ e^{\Delta t/T_{1}}}{1-e^{\Delta t/T_{1}}} $$
Here, the tissue blood partition coefficient was assumed to be 9 and the labeling efficiency was estimated from in vitro measurements (α=0.48). The blood T1 and the post labeling delay were assumed to be 1100ms and 400ms10.
Results
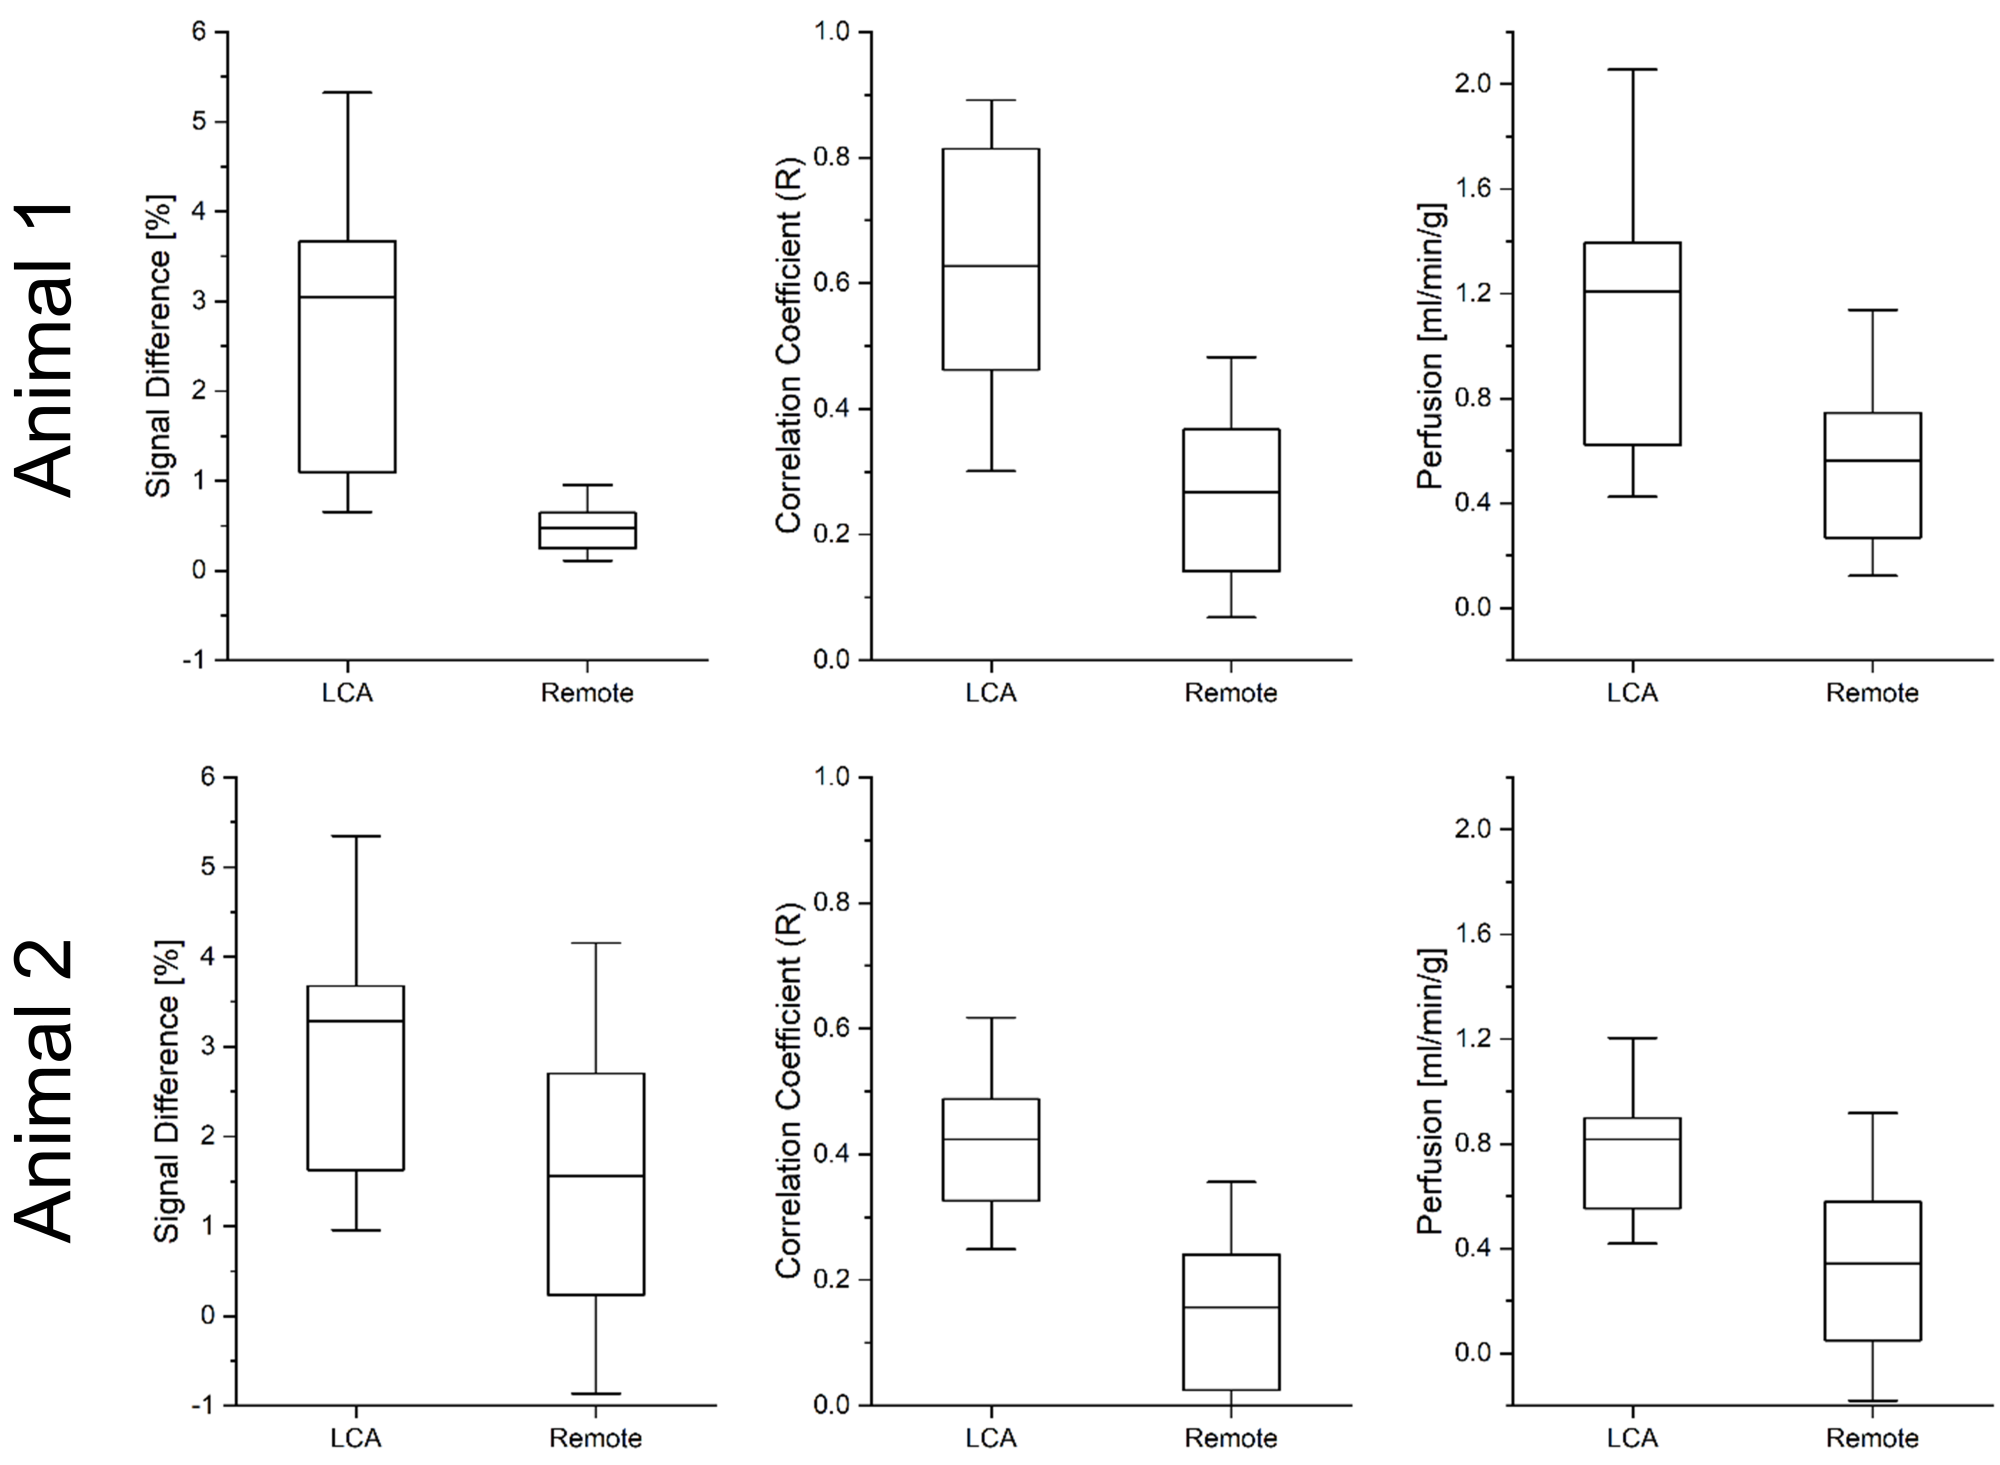
Figures 2 and 3 show maps of ΔS, the correlation and the perfusion values obtained from the in vivo iASL measurement. The maps clearly show a signal difference and a strong correlation between the signal and the labeling paradigm in the myocardial segments supplied by the LCA whereas no labeling can be detected in the remote segments. The mean correlation coefficients in the segments supplied by the LCA were 0.63±0.22 in the first and 0.42±0.16 in the second animal whereas the mean values in the corresponding remote areas were 0.27±0.15 and 0.16±0.14. The perfusion maps depict the LCA segments by increased perfusion values which where 1.2±1.1 in the first and 0.8±0.6 in the second animal compared to 0.6±0.4 and 0.3±0.4 in the remote areas. All measured parameters (signal difference, correlation and perfusion) are significantly increased in the LCA versus the remote areas with p<0.001 in all cases (c.f.Fig4).Discussion & Conclusion
This study presents the first in vivo myocardial perfusion measurements using catheter-based intra-arterial spin labeling. The results show that iASL by a catheter engaged in the LCA allows for selective perfusion measurements of myocardial segments supplied by the LCA. The perfusion can be visualized by both a signal difference and a correlation map. The results indicate that the correlation map provides a better visualization of the perfusion compared to the signal difference map - in particular, when a more complex labeling paradigm is used. Quantitative perfusion values in LCA segments agree with literature values (0.9..1.3 ml/min/g in pigs11). The SNR of the iASL technique may further be increased by using higher labeling RF amplitudes and adiabatic inversion schemes. Catheter-based iASL may provide a valuable tool for myocardial perfusion measurements during MR-guided interventions that does not use exogeneous contrast agents and may further be used for interventions of other organs, i.e. the hepatic or renal arteries.Acknowledgements
The animal experiments in this study were supported in parts by the SFB1425, funded by the Deutsche Forschungsgemeinschaft (DFG, German Research Foundation #422681845).References
1. Kober, F., Jao, T., Troalen, T. & Nayak, K. S. Myocardial arterial spin labeling. J. Cardiovasc. Magn. Reson. 18, 22 (2016).
2. Aramendía-Vidaurreta, V., Echeverría-Chasco, R., Vidorreta, M., Bastarrika, G. & Fernández-Seara, M. A. Quantification of Myocardial Perfusion With Vasodilation Using Arterial Spin Labeling at 1.5T. J. Magn. Reson. Imaging 53, 777–788 (2021).
3. Serfaty, J.-M. et al. MRI-guided coronary catheterization and PTCA: A feasibility study on a dog model. Magn. Reson. Med. 49, 258–263 (2003).
4. Omary, R. A. et al. Real-Time Magnetic Resonance Imaging-Guided Coronary Catheterization in Swine. Circulation 107, 2656–2659 (2003).
5. Heidt, T. et al. Real-time magnetic resonance imaging – guided coronary intervention in a porcine model. Sci. Rep. 9, 8663 (2019).
6. Waescher, K., Reiss, S., Özen, A. C., Lottner, T. & Bock, M. Towards Catheter-based Intra-Arterial Spin Labeling for Perfusion Measurements. in Proc. Intl. Soc. Mag. Reson. Med. vol. 27 4244 (2021).
7. Heidt, T. et al. Magnetic resonance imaging for pathobiological assessment and interventional treatment of the coronary arteries. Eur. Heart J. Suppl. 22, C46–C56 (2020).
8. Bock, M., Schoenberg, S. O., Floemer, F. & Schad, L. R. Separation of arteries and veins in 3D MR angiography using correlation analysis. Magn. Reson. Med. 43, 481–487 (2000).
9. Teixeira, T., Hafyane, T., Jerosch-Herold, M., Marcotte, F. & Mongeon, F.-P. Myocardial Partition Coefficient of Gadolinium: A Pilot Study in Patients With Acute Myocarditis, Chronic Myocardial Infarction, and in Healthy Volunteers. Can. J. Cardiol. 35, 51–60 (2019).
10. Wang, D. J. J. et al. Estimation of perfusion and arterial transit time in myocardium using free-breathing myocardial arterial spin labeling with navigator-echo. Magn. Reson. Med. 64, 1289–1295 (2010).
11. Rossi, A. et al. Quantification of myocardial blood flow by adenosine-stress CT perfusion imaging in pigs during various degrees of stenosis correlates well with coronary artery blood flow and fractional flow reserve. Eur. Heart J. - Cardiovasc. Imaging 14, 331–338 (2013).
Figures