0206
Three dimensional multi-parameter brain mapping using MR fingerprinting for characterization of multiple sclerosis lesions1Center for Biomedical Imaging, Grossman school of Medicine, NYU Langone Health, New York, NY, United States, 2Department of Neurology, Grossman School of Medicine, NYU Langone Health, New York, NY, United States
Synopsis
A 3D multi-parameter MRF imaging technique capable of quantifying 4 different parameters (T1, T2, T1ρ, B1) was developed for multiple sclerosis(MS) application. The 3D-MRF technique was tested with multiple shots on a standardized NIST/ISMRM phantom, and brain imaging in 5 healthy volunteers. The 3D-MRF was also tested on two MS patients with chronic and enhancing MS lesions. The phantom studies demonstrate that quantitative maps are in agreement with reference, healthy volunteer studies show the agreement between multiple shots and SNR improvement with increasing shots. The MS patient results demonstrate the potential use of mutli-parameter quantitative mapping for WM characterization.
PURPOSE
Multiple Sclerosis (MS) is a chronic inflammatory demyelinating disease characterized by multi-focal brain lesions with various stages of tissue damage[1,2]. MR fingerprinting (MRF) is a promising new concept that allows quantitative multi-parameter mapping for measuring tissue properties based on a single and time-efficient acquisition[3]. The goal of the study was to develop a 3D-MRF imaging sequence, which is capable of quantifying four different parameters (T1, T2, T1ρ, B1), and to explore its feasibility for quantitative tissue characterization of MS lesions.METHODS
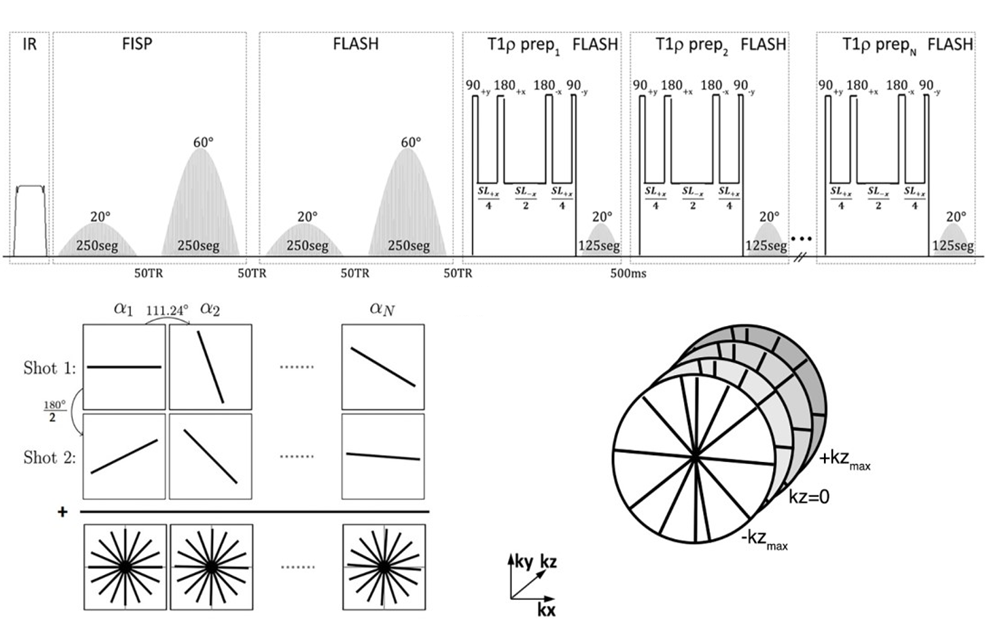
A 3D implementation of the MRF sequence is shown in figure 1[4-6]. An adiabatic inversion pulse is followed by two FISP segments that encode for T1/T2, where each FISP segment consists of 250 RF excitations and FLASH segment that encodes for T1/B1 with variable flip angles(FA). This is followed by a T1ρ preparation module with variable duration (6 pulses varying from 2-45 ms) followed by 125 RF excitations for each spin lock pulse, with FA’s ranging from 0° to 20°. Golden angle radial readouts following each RF excitation were used with centric out readout in the kz dimension.To increase SNR and k-space coverage, additional shots (n shots) were acquired by adding an offset angle (180°/n) at the beginning of each train. The 3D-MRF imaging sequence with 1 shot took 6 minutes, 2 shots took 12 min, 4 shots took 24 minutes, and 8 shots took 48 minutes. Other MR acquisition parameters included: FOV=240mm, in-plane voxel resolution= 1x1mm2, 3mm through plane slice thickness, TR=7.5ms, TE=3.5 ms, bandwidth=500Hz/pixel, frequency of spin lock=500 Hz.
Extended phase graph[7] simulations were performed to compute a dictionary of simulated MR fingerprints with a T1 range of 50-3000ms, T2 range of 2-200ms, and a T1ρ range of 2-200ms in steps of 6%. SVD compression was used to speed up the reconstruction[8], which was performed offline. An iterative dictionary pattern matching algorithm was used to produce quantitative maps of proton density, T1, T2, T1ρ and B1.
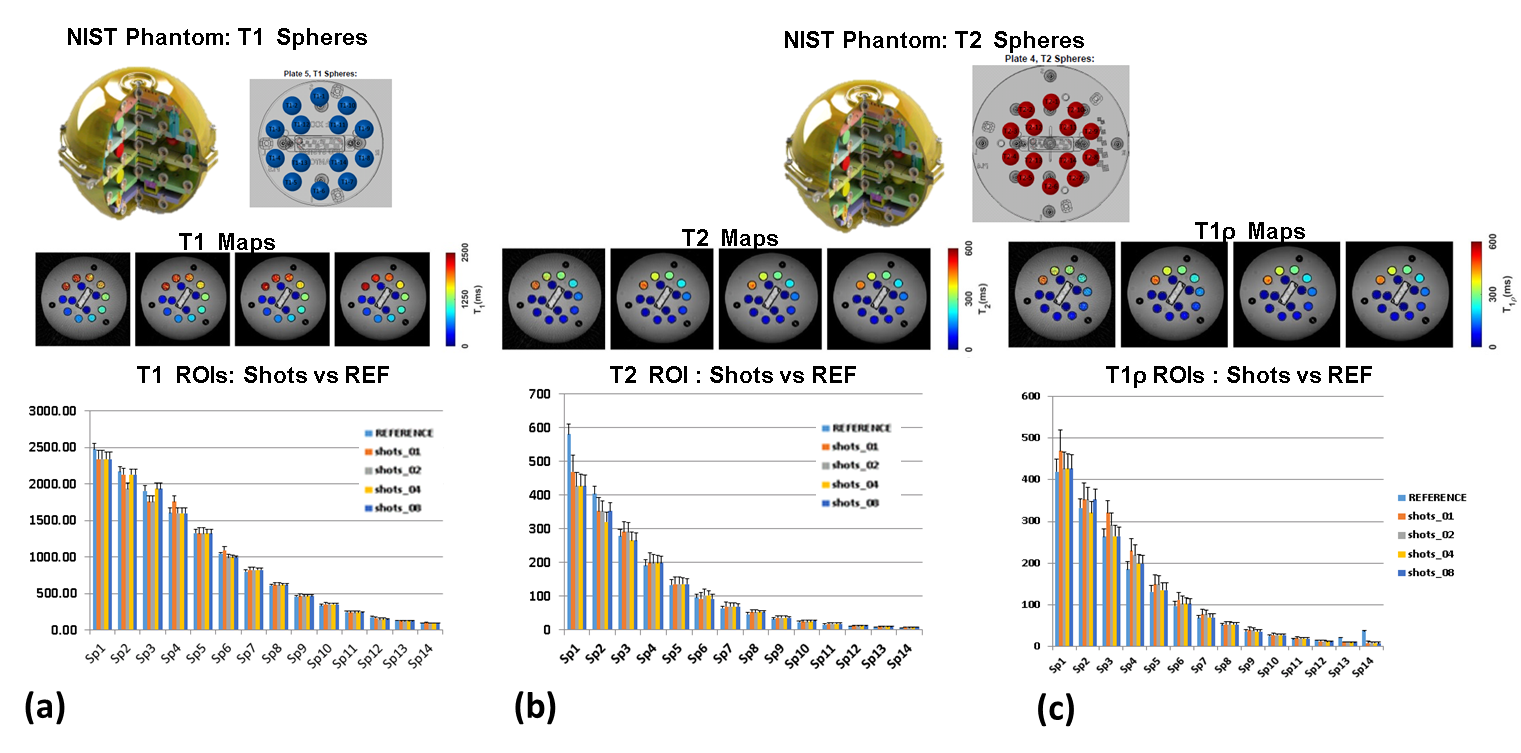
The 3D-MRF sequence was tested on a standardized NIST/ISMRM phantom that has published T1 and T2 values for 14 spheres[9]. Reference imaging sequences for T1-mapping, T2-mapping and T1ρ-mapping were used, and 3D-MRF data were obtained using 2, 4, 6 and 8 shots with a standard vendor provided 20-array head coil.
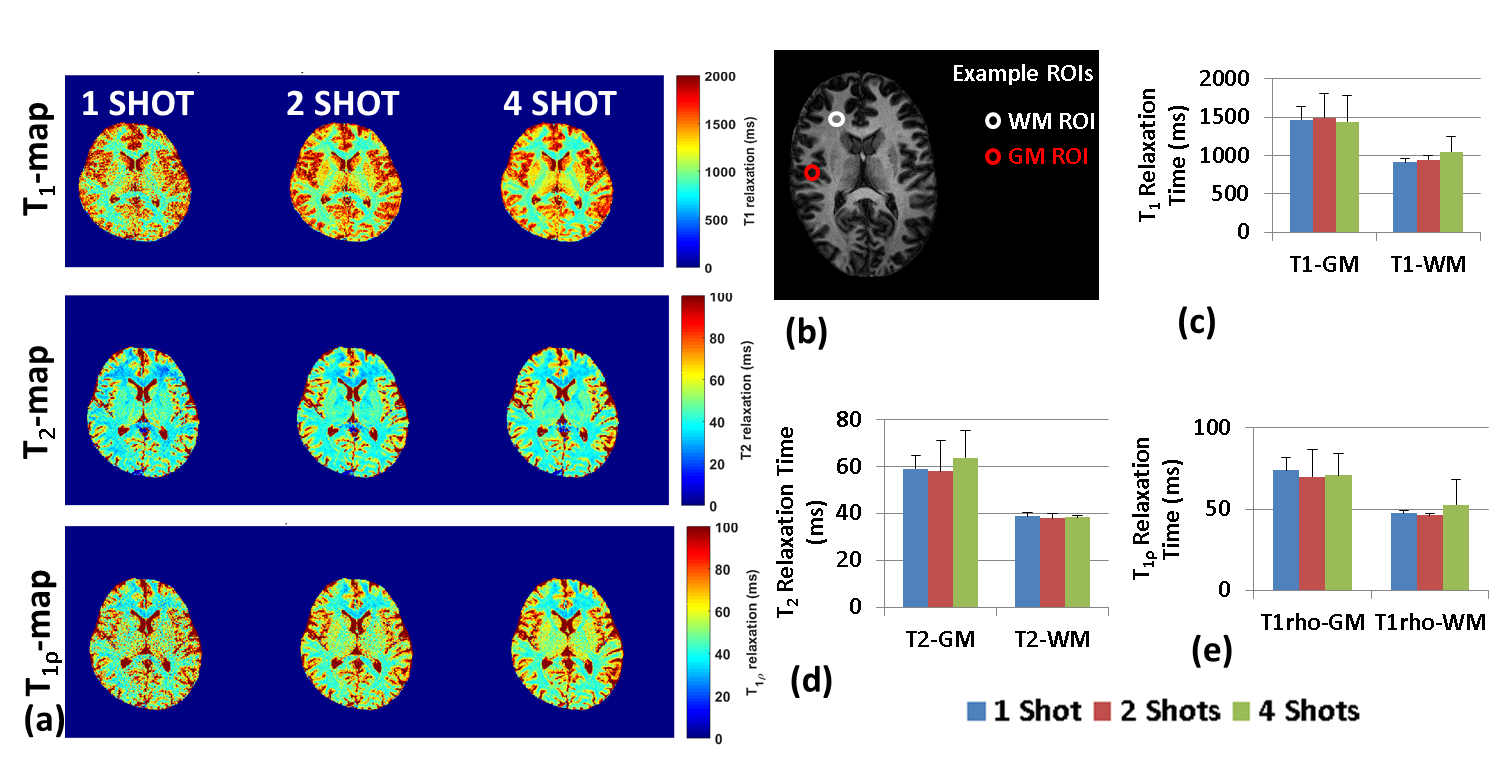
To test the efficiency and errors in multiple shot acquisition schemes for neuro-imaging applications, we tested the 3D-MRF imaging on control subjects. Five control subjects (3 males, 27±3 years) were recruited following informed consent, and in accordance with institutional review board guidelines. They underwent brain imaging with the 3D-MRF imaging sequence at 1, 2 and 4 shots.
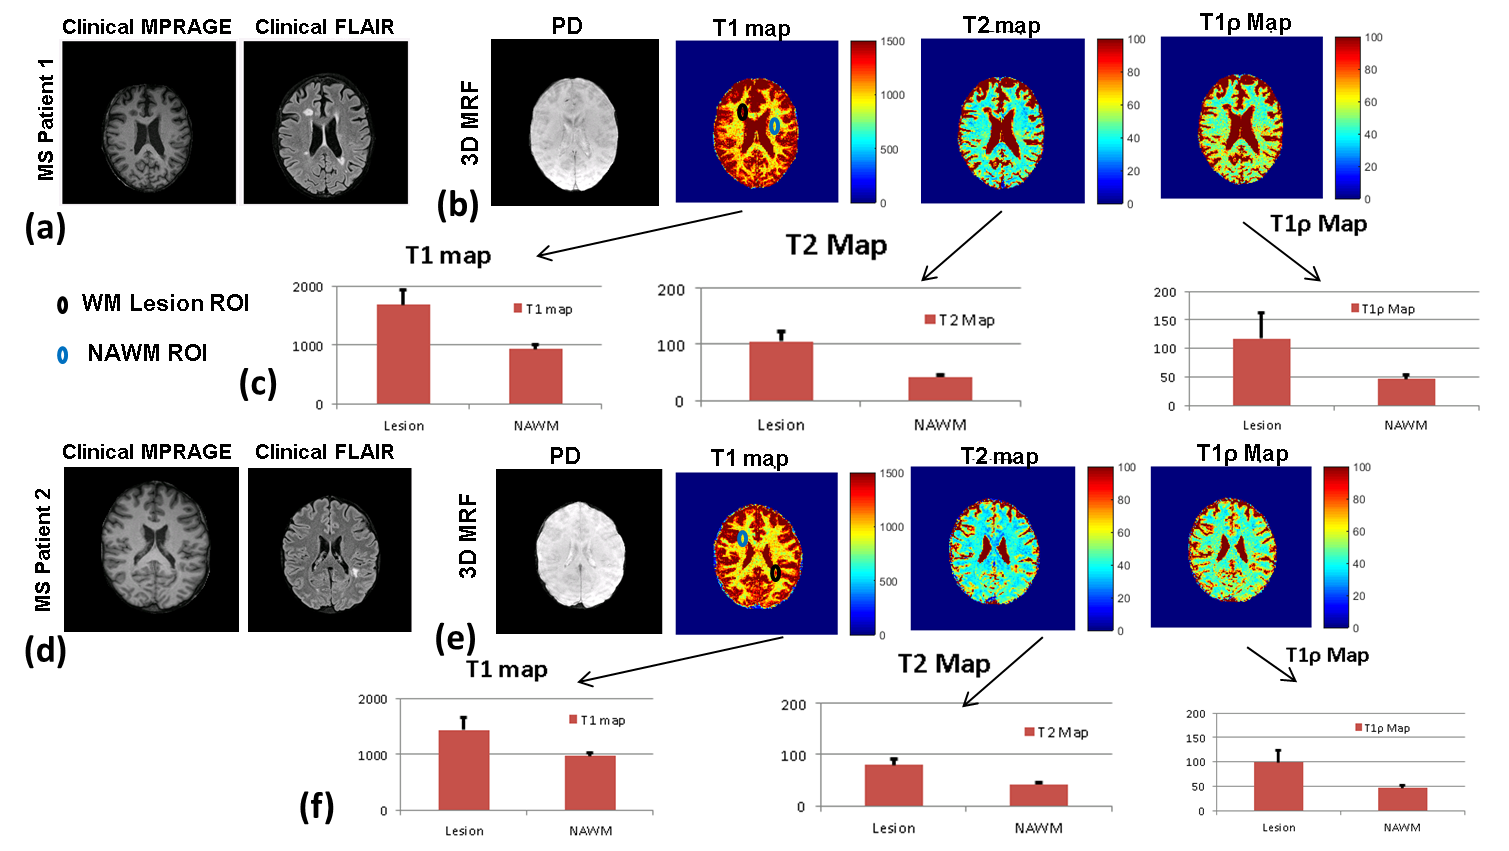
Two MS patients (1 male, 63 years and 1 female, 29 years) with MS lesions were also recruited following informed consent, and underwent brain imaging with no contrast using the 3D-MRF sequence at 2 shots, followed by routine clinical imaging protocol of whole brain imaging using T1-MPRAGE for T1 contrast, and FLAIR imaging for T2 contrast.
RESULTS
Results from the phantom study are shown in figure 2. Figure 2(a) shows the T1 spheres in the NIST phantom, the T1 maps reconstructed from 1-, 2-, 4- and 8-shots, and bar graph shows the mean values for spheres compared to reference for the number of shots. Similarly, Figure 2(b) shows the T2 spheres, the T2 maps at multiple shots, and the mean values for multiple shot data compared to reference. Figure 1(c) shows the T1ρ maps and the comparison of the mutiple shot data with the reference.Figure 3 shows exemplary volumetric, multi-parameter maps of multiple brain slices for 1-, 2- and 4-shots obtained using 3D-MRF. Figure 4(a) shows the variation in performance using multi-shot 3D-MRF for T1, T2 and T1ρ-mapping. Figure 4(b) shows example ROIs drawn in the gray matter (GM) and white matter (WM) in healthy subjects. The bar graphs show the means of GM and WM ROIs in 5 subjects, and the parameter estimation performance with 1-, 2- and 4-shot 3D-MRF for T1, T2 and T1ρ mapping. The 3D-MRF acquisition using 2 shots was considered optimal taking into consideration a clinically feasible imaging time (~12 min), SNR, noise characteristics, and accuracy.
Figure 5 shows the results of 3D-MRF imaging on two MS patients. Figure 5(a-c) shows results of the MS patient with chronic lesions and figure 5(d-f) shows results from the patient with actively enhancing lesions. Figure 5(a) shows T1 and T2 imaging using clinical protocol. The T2 imaging shows the presence of MS lesions. Figure 5(b) shows 3D-MRF results showing PD, T1-, T2-, and T1ρ-maps. WM ROIs drawn in the WM lesion and contralateral normal appearing white matter (NAWM) showed significant differences in values for T1, T2 and T1ρ. The NAWM ROIs in both MS patients have similar values consistent with WM values, but the chronic MS lesion shows increased values for T1, T2 and T1ρ compared to enhancing lesion ROIs suggesting the potential to discriminate chronic and active enhancing lesions using 3D-MRF.
DISCUSSION AND CONCLUSION
High-resolution, multi-parameter mapping in clinically feasible times for neuro-imaging applications such as MS can yield in vivo quantitative characterization of tissue properties. The results here suggest the potential to discriminate chronic and active enhancing lesions using 3D-MRF.Acknowledgements
This study was supported by NIH grants R21-AR075259-01A, R01 AR076328, R01 AR076985, and R01 AR068966, and was performed under the rubric of the Center of Advanced Imaging Innovation and Research (CAI2R) at the NYU Grossman School of Medicine and NIBIB Biomedical Technology Resource Center (NIH P41 EB017183).References
1. Filippi M, Rocca MA, Ciccarelli O, et al. MRI criteria for the diagnosis of multiple sclerosis: MAGNIMS consensus guidelines. Lancet Neurol. 2016;15(3):292-303.
2. Kuhlmann T, Ludwin S, Prat A, Antel J, Bruck W, Lassmann H. An updated histological classification system for multiple sclerosis lesions. Acta Neuropathol. 2017;133(1):13-24.
3. Ma S, Wang N, Fan Z, et al. Three-dimensional whole-brain simultaneous T1, T2, and T1rho quantification using MR Multitasking: Method and initial clinical experience in tissue characterization of multiple sclerosis. Magn Reson Med. 2021;85(4):1938-1952.
4. Cloos MA, Asslander J, Abbas B, et al. Rapid Radial T1 and T2 Mapping of the Hip Articular Cartilage With Magnetic Resonance Fingerprinting. J Magn Reson Imaging. 2019;50(3):810-815.
5. Sharafi A, Zibetti MVW, Chang G, Cloos M, Regatte RR. MR fingerprinting for rapid simultaneous T1 , T2 , and T1 rho relaxation mapping of the human articular cartilage at 3T. Magn Reson Med. 2020;84(5):2636-2644.
6. Sharafi A, Medina K, Zibetti MWV, et al. Simultaneous T1 , T2 , and T1rho relaxation mapping of the lower leg muscle with MR fingerprinting. Magn Reson Med. 2021;86(1):372-381.
7. Weigel M. Extended phase graphs: dephasing, RF pulses, and echoes - pure and simple. J Magn Reson Imaging. 2015;41(2):266-295.
8. McGivney DF, Pierre E, Ma D, et al. SVD Compression for Magnetic Resonance Fingerprinting in the Time Domain. Ieee Transactions on Medical Imaging. 2014;33(12):2311-2322.
9. Sullivan DC, Obuchowski NA, Kessler LG, et al. Metrology Standards for Quantitative Imaging Biomarkers. Radiology. 2015;277(3):813-825.
Figures