0205
Imaging Optic Nerve Pathology and Dysfunction in Multiple Sclerosis Using Diffusion Basis Spectrum imaging1Radiology, Washington University School of Medicine, St. Louis, MO, United States, 2Biostatistics, Washington University School of Medicine, St. Louis, MO, United States, 3Imaging Physics, MD Anderson Cancer Center, Houston, TX, United States, 4Radiology, Baylor College of Medicine, Houston, TX, United States, 5Neurology, Washington Univeristy School of Medicine, St. Louis, MO, United States, 6Hope Center for Neurological Disorders, Washington University School of Medicine, St. Louis, MO, United States
Synopsis
We have introduced diffusion basis spectrum imaging (DBSI) to detect, differentiate, and quantify coexisting pathologies in people with multiple sclerosis (MS). Recently, we performed functional DBSI and DTI with flashing-checkerboard stimulation. DBSI-derived radial diffusivity (DBSI-RD) decreased significantly during visual stimulation while DTI-RD did not change. In this study, we employed fDBSI to assess optic nerve function and pathology simultaneously in MS. Axonal loss and vasogenic edema/increased extracellular space attenuated optic nerve response to visual stimulation.
Introduction
We have developed diffusion basis spectrum imaging (DBSI)1 to differentiate coexisting axonal injury, demyelination, inflammation, a quantify axonal loss in multiple sclerosis (MS)2,3 and its animal models.4-6 We previously reported that diffusion functional MRI (dfMRI), using single-direction diffusion weighting7,8 or diffusion tensor imaging (DTI)9, can identify axonal dysfunction and conduction blockage. Subsequently, we performed functional DTI and DBSI with 8Hz flashing checkerboard visual stimulation to examine healthy and MS subjects. Optic neuritis (ON) is common symptom in MS. Optical coherence tomography (OCT)-assessed retinal nerve fiber layer (RNFL) thinning has been correlated with visual acuity, optic nerve axonal loss and, notably, with global brain atrophy in MS.10,11 Thus, optic nerve pathology severity could potentially reflect disease progression in MS. In this study, we employed functional DBSI (fDBSI) to simultaneously assess optic nerve dysfunction and pathology in people with MS.Materials and Methods
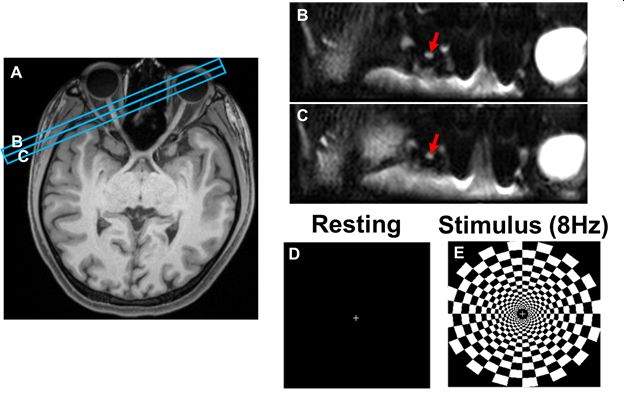
Subject set-up: Six healthy control (CTL) and eleven MS subjects were recruited. Scans were performed on a 3T Siemens Prisma scanner. A 64-channel head coil was used with a mirror to allow the subject to see the flashing checkerboard (Fig. 1E) during scanning. Imaging protocol: Whole brain MPRAGE was acquired to locate optic nerves (Fig.1A). Two image slices were adjusted perpendicular to the tested optic nerve (Fig. 1A, blue rectangles). Imaging was performed in 31 directions with 31 b-values (monopolar diffusion encoding, max b-value = 1,000 s/mm2) including one b = 0. Diffusion-weighted images were obtained using inner-volume single-shot EPI:12 TR = 2.5 s, TE = 53.8 ms, in-plane resolution = 1.1 x 1.1 mm, slice thickness = 4 mm, echo-train length = 30, and acquisition time = 1.5 minutes. Each fDBSI measurement consisted of a series of three baseline, three stimulation (8 Hz flashing checkerboard), and three stimulation-off images (Fig. 1D&E). Thus, three measurements were averaged for each condition. Data processing: Raw DWIs were post-processed and co-registered before DBSI and DTI metrics were derived using lab-developed software.Results
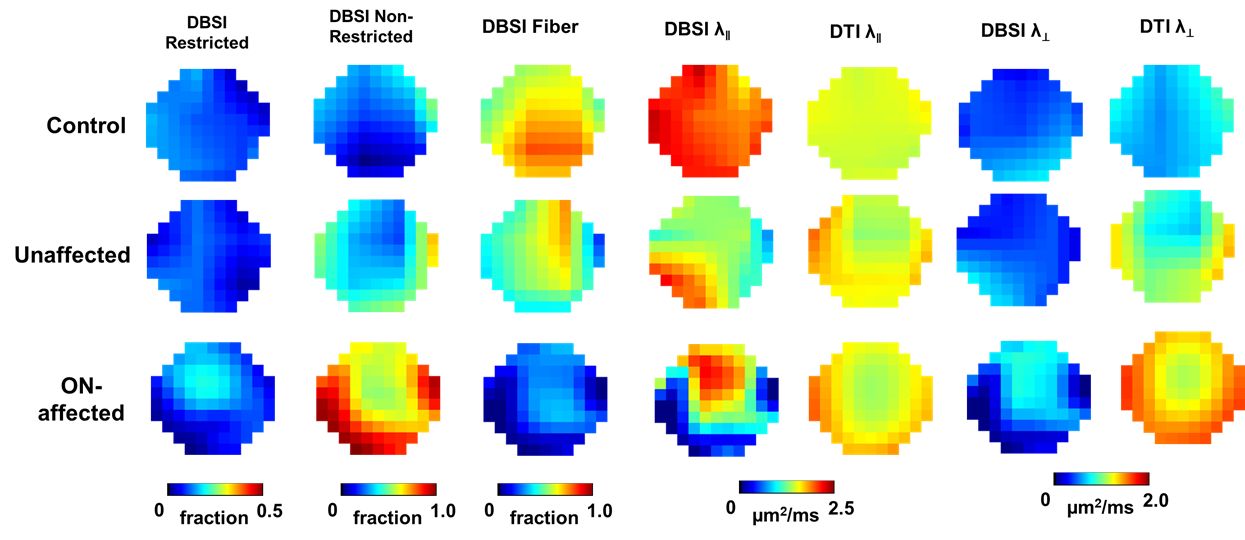
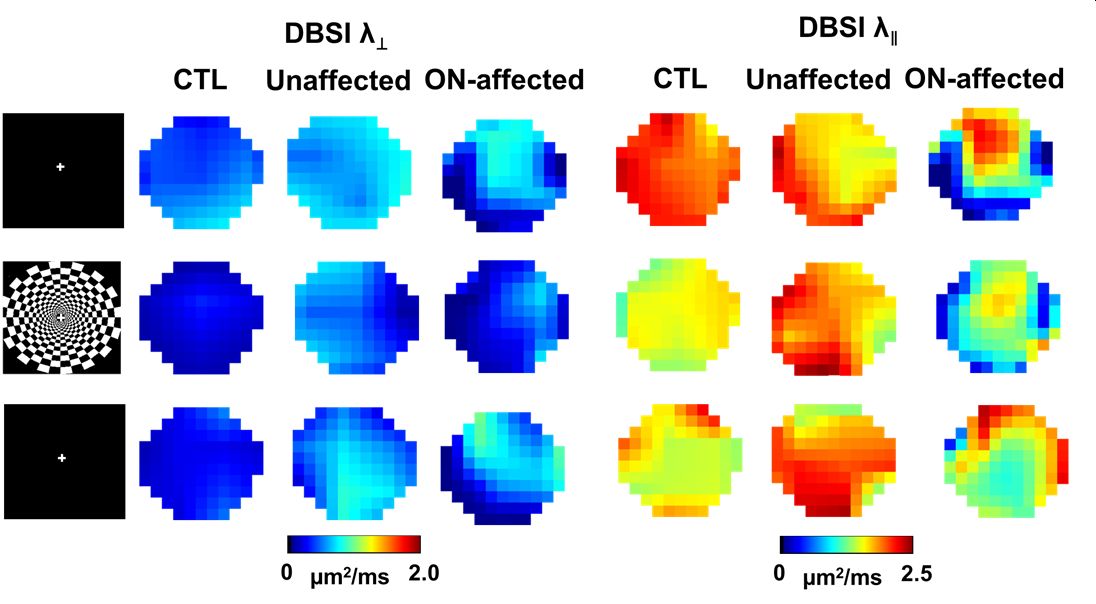
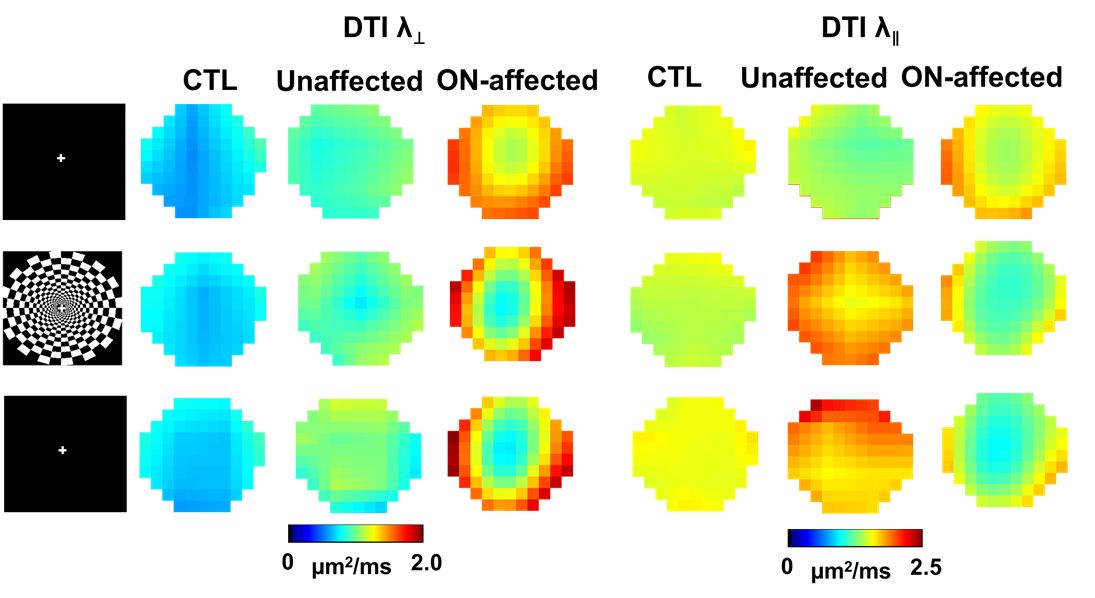
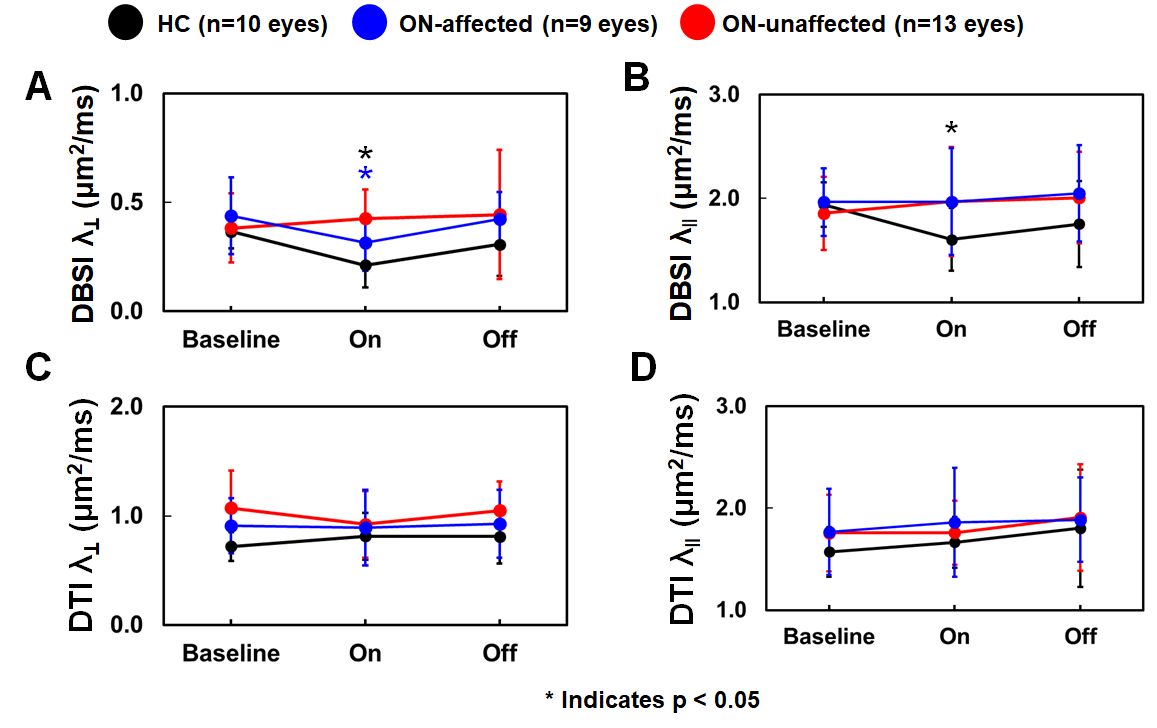
Representative DBSI and DTI maps of one healthy optic nerve from a control subject, and one prior ON-affected and contralateral unaffected eye from one MS subject (Fig.2) revealed an increased non-restricted fraction (putative biomarker for increased inter-axonal tissues/vasogenic edema), an increased restricted fraction, and decreased fiber fraction (putative biomarker for axonal density) in MS nerves, with or without ON history, compared to control. Decreased DBSI-λǁ in both unaffected and ON-affected nerves suggested axonal injury. Increased DBSI-λ⊥ in ON-affected eye suggested demyelination. Overall DTI-λ⊥ and DTI-λǁ were higher and lower than DBSI-λ⊥ and DBSI-λǁ, respectively (Fig. 2). Functional DBSI in optic nerves from five health (n=10 eyes) and eleven MS (n=9 prior ON-affected eyes, n=11 unaffected eyes) subjects revealed 42% DBSI-λ⊥ (p< 0.05) and 17% DBSI-λǁ decrease (p<0.05) in healthy subjects upon stimulation versus 28% DBSI-λ⊥ (p< 0.05) and ~0% DBSI-λǁ decrease in ON-unaffected eyes of MS patients; and 11% decrease in DBSI-λ⊥ and 5% DBSI-λǁ increase in optic nerves previously affected by ON. In contrast, functional DTI did not detect axonal activation in optic nerve of eyes, unaffected MS unaffected eyes, or previously affected by ON.Discussion
Our baseline DBSI results indicated that DBSI could detect and quantify coexisting inflammation, axonal injury, demyelination, and reduced axonal density in MS optic nerves while DTI was confounded by inflammation and surrounding CSF. In contrast, DTI failed to detect axonal activation in optic nerve. fDBSI detected axonal activation in either healthy or ON-unaffected optic nerves. Current data reflect averaged effect over the entire optic nerve. More detailed data analysis to examine the potential inhomogeneous activation is ongoing for a more refined interpretation.Conclusion
In this proof-of-concept study, we successfully translated our mouse dfMRI finding to human optic nerve using DBSI. The results suggested functional DBSI could simultaneously assess pathology and function in optic nerves.Acknowledgements
This work was supported in part by NIH R01-NS047592, P01-NS059560, U01-EY025500, and National Multiple Sclerosis Society (NMSS) RG 5258-A-5, RG 1701-26617References
1 Cross, A. H. & Song, S. K. "A new imaging modality to non-invasively assess multiple sclerosis pathology". Journal of neuroimmunology 304, 81-85, doi:10.1016/j.jneuroim.2016.10.002 (2017).
2 Wang, Y. et al. Quantification of increased cellularity during inflammatory demyelination. Brain 134, 3590-3601, doi:10.1093/brain/awr307 (2011).
3 Wang, Y. et al. Differentiation and quantification of inflammation, demyelination and axon injury or loss in multiple sclerosis. Brain 138, 1223-1238, doi:10.1093/brain/awv046 (2015).
4 Chiang, C. W. et al. Quantifying white matter tract diffusion parameters in the presence of increased extra-fiber cellularity and vasogenic edema. Neuroimage 101, 310-319, doi:10.1016/j.neuroimage.2014.06.064 (2014).
5 Lin, T.-H. et al. Diffusion MRI quantifies early axonal loss in the presence of nerve swelling. Journal of neuroinflammation 14, 78 (2017).
6 Lin, T. H. et al. Diffusion Basis Spectrum Imaging Detects Axonal Loss After Transient Dexamethasone Treatment in Optic Neuritis Mice. Front Neurosci 14, 592063, doi:10.3389/fnins.2020.592063 (2020).
7 Lin, T. H. et al. Diffusion fMRI detects white-matter dysfunction in mice with acute optic neuritis. Neurobiology of disease 67, 1-8, doi:10.1016/j.nbd.2014.02.007 (2014).
8 Spees, W. M., Lin, T. H. & Song, S. K. White-matter diffusion fMRI of mouse optic nerve. NeuroImage 65, 209-215, doi:10.1016/j.neuroimage.2012.10.021 (2013).
9 Spees, W. M. et al. MRI-based assessment of function and dysfunction in myelinated axons. Proc Natl Acad Sci U S A 115, E10225-E10234, doi:10.1073/pnas.1801788115 (2018).
10 Naismith, R. T. et al. Optical coherence tomography differs in neuromyelitis optica compared with multiple sclerosis. Neurology 72, 1077-1082, doi:10.1212/01.wnl.0000345042.53843.d5 (2009).
11 Trip, S. A. et al. Optic nerve atrophy and retinal nerve fibre layer thinning following optic neuritis: Evidence that axonal loss is a substrate of MRI-detected atrophy. Neuroimage 31, 286-293, doi:10.1016/j.neuroimage.2005.11.051 (2006).
12 Kim, J. W. et al. Incorporating non-linear alignment and multi-compartmental modeling for improved human optic nerve diffusion imaging. NeuroImage 196, 102-113, doi:10.1016/j.neuroimage.2019.03.058 (2019).
Figures