0204
Myelin water and multi-shell diffusion imaging provide unique information about multiple sclerosis myelin and axonal damage1Physics and Astronomy, University of British Columbia, Vancouver, BC, Canada, 2International Collaboration on Repair Discoveries, University of British Columbia, Vancouver, BC, Canada, 3Montreal Neurological Institute - Hospital, McGill University, Montreal, QC, Canada, 4Medicine, University of British Columbia, Vancouver, BC, Canada, 5Radiology, University of British Columbia, Vancouver, BC, Canada, 6Imaging Physics, MD Anderson Cancer Center, Houston, TX, United States, 7School of Biomedical Engineering, University of British Columbia, Vancouver, BC, Canada, 8Pathology & Laboratory Medicine, University of British Columbia, Vancouver, BC, Canada, 9Radiology, Washington University, St. Louis, MO, United States
Synopsis
Myelin Water Imaging (MWI), Diffusion Basis Spectrum Imaging (DBSI) and Neurite Orientation Dispersion and Density Imaging (NODDI) were used to assessed relationships between myelin and axon-related measures in 122 multiple sclerosis (MS) participants and 16 healthy controls. Neurite density index (NDI) correlated strongly with radial diffusivity and weakly with myelin water fraction, suggesting that radial diffusivity also captures diffusion in dendrites. The lack of correlation between NDI and fiber fraction was surprising given that both metrics are meant to relate to axon density. MWI, DBSI and NODDI provide unique and complementary information about MS damage.
Background
Multiple sclerosis (MS) is characterized by demyelination of nerve fibers1. MRI metrics that are specific to myelin and axon integrity can be useful biomarkers for studying MS disease mechanisms and remyelination treatments2,3. A number of approaches are being used to assess myelin and axons.Myelin Water Imaging (MWI) quantifies different water pools based on T2 decay time. The ratio of water associated with myelin (T2 < 40ms) to the whole spectrum of T2 times is the Myelin Water Fraction (MWF) which correlates with histopathological staining for myelin content4. A common analysis method for converting the sum of T2 decay components into a spectrum is a regularized non-negative least squares (NNLS) technique with flip angle optimization5,6. Recently, a new machine learning approach has been developed: spectrum analysis for multiple exponentials via experimental condition oriented simulation (SAME-ECOS), which is more robust than NNLS in the presence of noise7.
Diffusion-based approaches measure water diffusion characteristics in a local area, which can be modelled to reveal specific aspects of brain microstructure. Neurite Orientation Dispersion and Density Imaging (NODDI) fits 3 water environments with contributing imaging signals (intracellular, extracellular, cerebrospinal fluid) to determine the neurite density index (NDI) which reflects neurite density (higher for greater density of axons/dendrites)8,9. Diffusion Basis Spectrum Imaging (DBSI) models different diffusion tensors that represent myelinated and unmyelinated axons, restricted diffusion, nonrestricted diffusion, and cerebrospinal fluid9. DBSI metrics include radial diffusivity (RD, thought to increase with myelin damage10,11), axial diffusivity (AD, thought to decrease with acute, and increase with chronic, axon damage11,12), and fiber fraction (FF, axon density10).
Previous work observed limited correlations between NDI and mcDESPOT-derived MWF in some brain regions of healthy controls (HC)13. Investigating relationships between MRI metrics supposedly quantifying similar aspects of microstructural damage may be useful in determining to what extent these metrics correlate with each other and where they diverge to provide complementary information.
Objective
To assess pair-wise correlations between metrics that reflect myelin and axon damage: (1) NNLS MWF, (2) SAME-ECOS MWF, (3) NDI, (4) DBSI RD, (5) DBSI AD, and (6) DBSI FF in normal and normal-appearing white matter and MS lesions.Methods
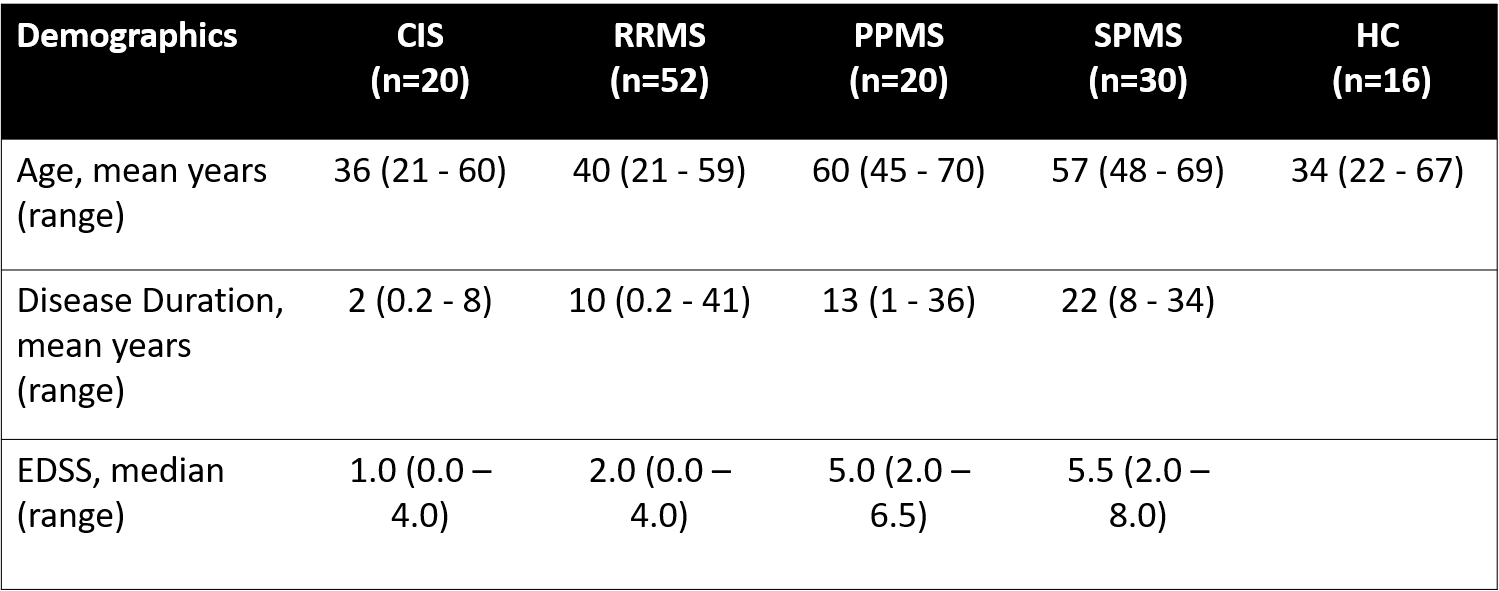
Data Collection: Sixteen healthy controls (HC) and 122 MS (demographics in Figure 1) underwent 3T MRI (Philips Achieva) to collect MWI (48-echo Gradient and Spin Echo, TR/TE=1073/8ms, resolution = 1x1x2.5mm3)14, diffusion (99 directions, b values = 0–1500, TR/TE=4798/79ms, voxel size = 2×2×2mm3)15, 3DT1 (TR/TE/TI=3000/3.5/926ms, resolution = 1x1x1mm3), and proton-density/T2-weighted (TR/TE1/TE2=2900/8.42/80ms, resolution = 1x1x3mm3). MS participants were recruited from 2 studies using the same MRI protocol.Analysis: Voxel-wise MWF maps (T2 < 40ms) were made using NNLS5,6 and a trained SAME-ECOS neural network7. Diffusion data was eddy current corrected and smoothed using FSL toolbox16. NDI maps were made using NODDI algorithm with AMICO to accelerate17. DBSI RD, AD, and FF maps were made with in-house MATLAB software15. All quantitative maps were registered to 3DT1. CSF masks were made using thresholded diffusion b0 images. Lesion masks were segmented by an experienced radiologist using seed points on the PD/T218, then registered to 3DT1. HC normal white matter (WM) and MS normal appearing WM (NAWM) masks were made using FAST segmentation19 on the 3DT1, with lesion and CSF masks subtracted. Masks were overlaid on registered NNLS MWF, SAME-ECOS MWF, NDI, DBSI RD, DBSI AD, DBSI FF maps to obtain mean WM, NAWM and lesion values. Pairwise Pearson correlation coefficients were used to assessed relationships between MRI metrics (significance p<0.05).
Results and Discussion
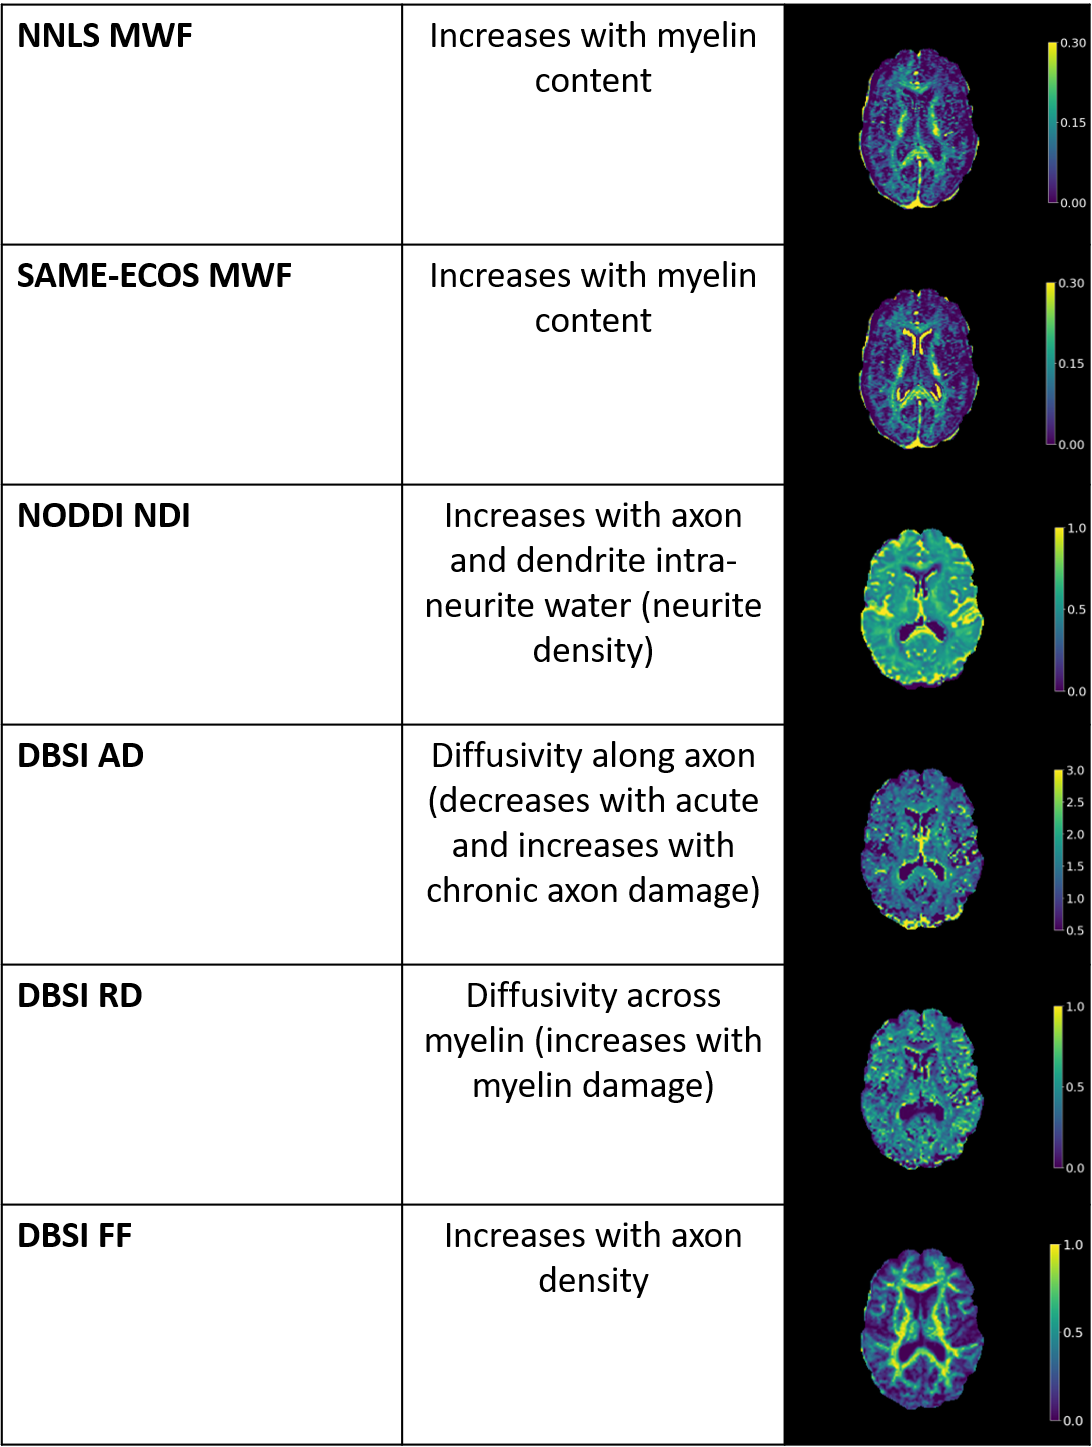
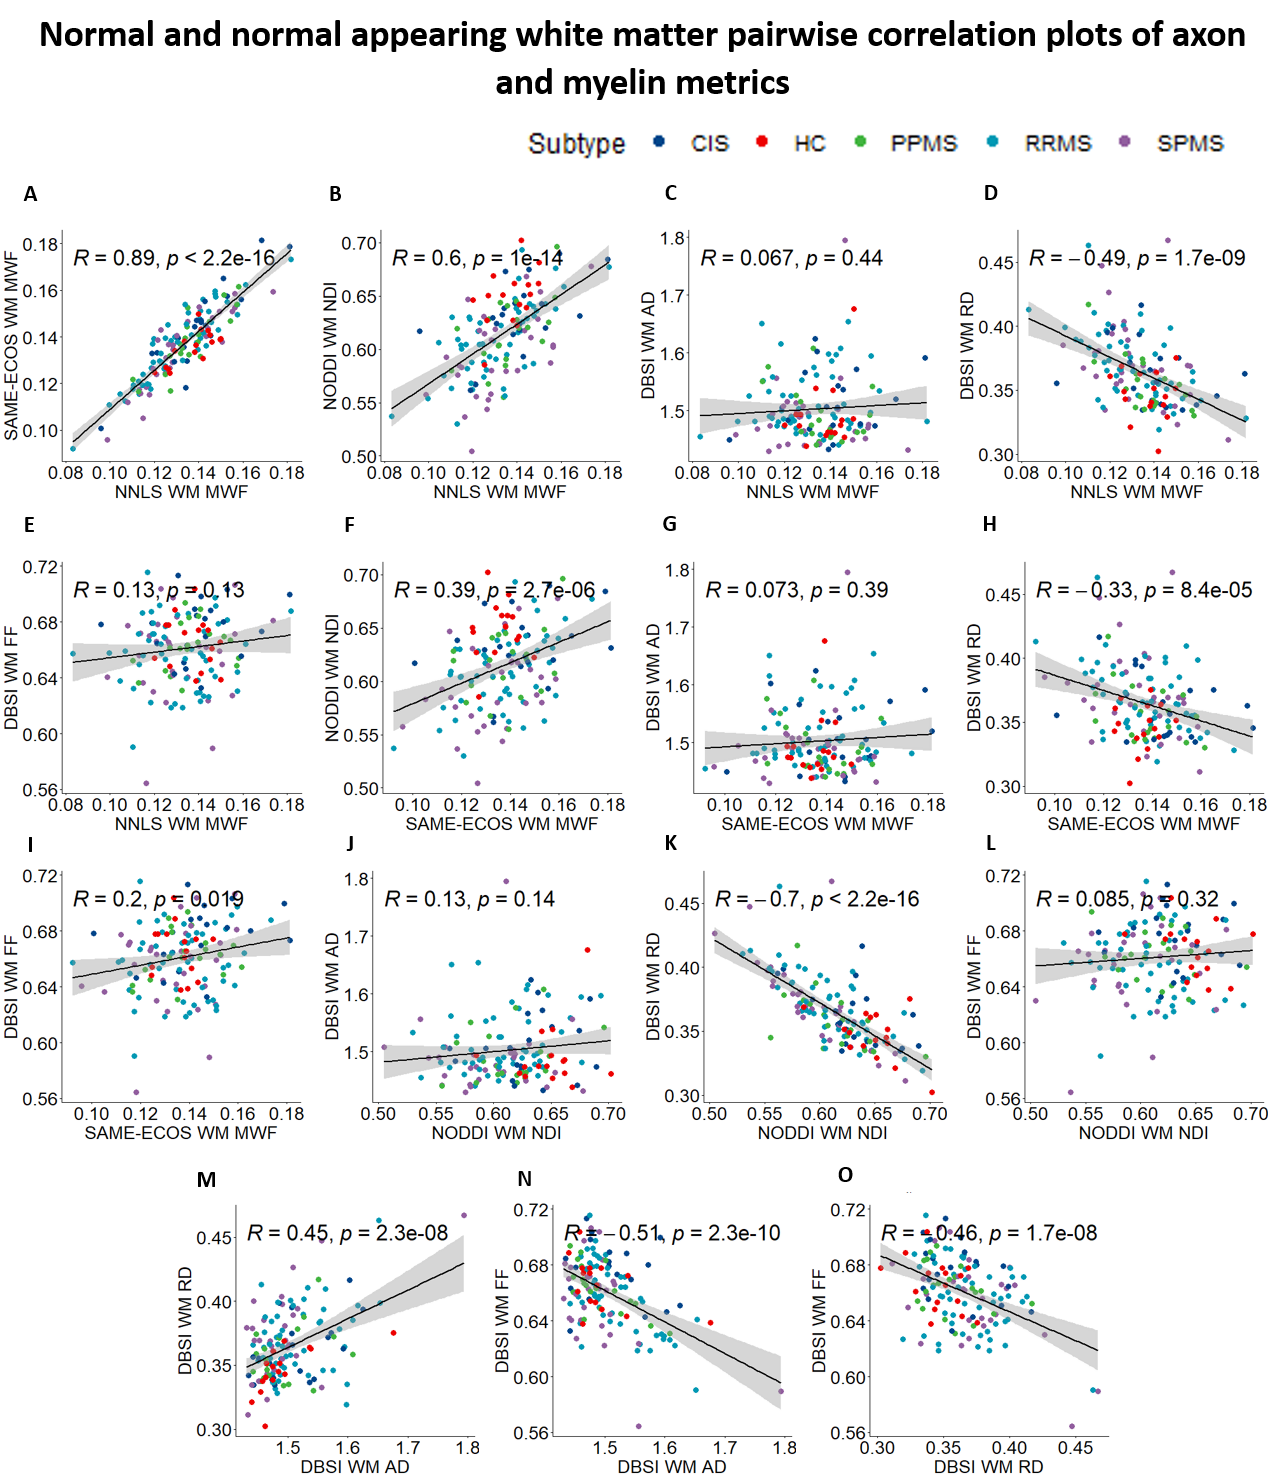
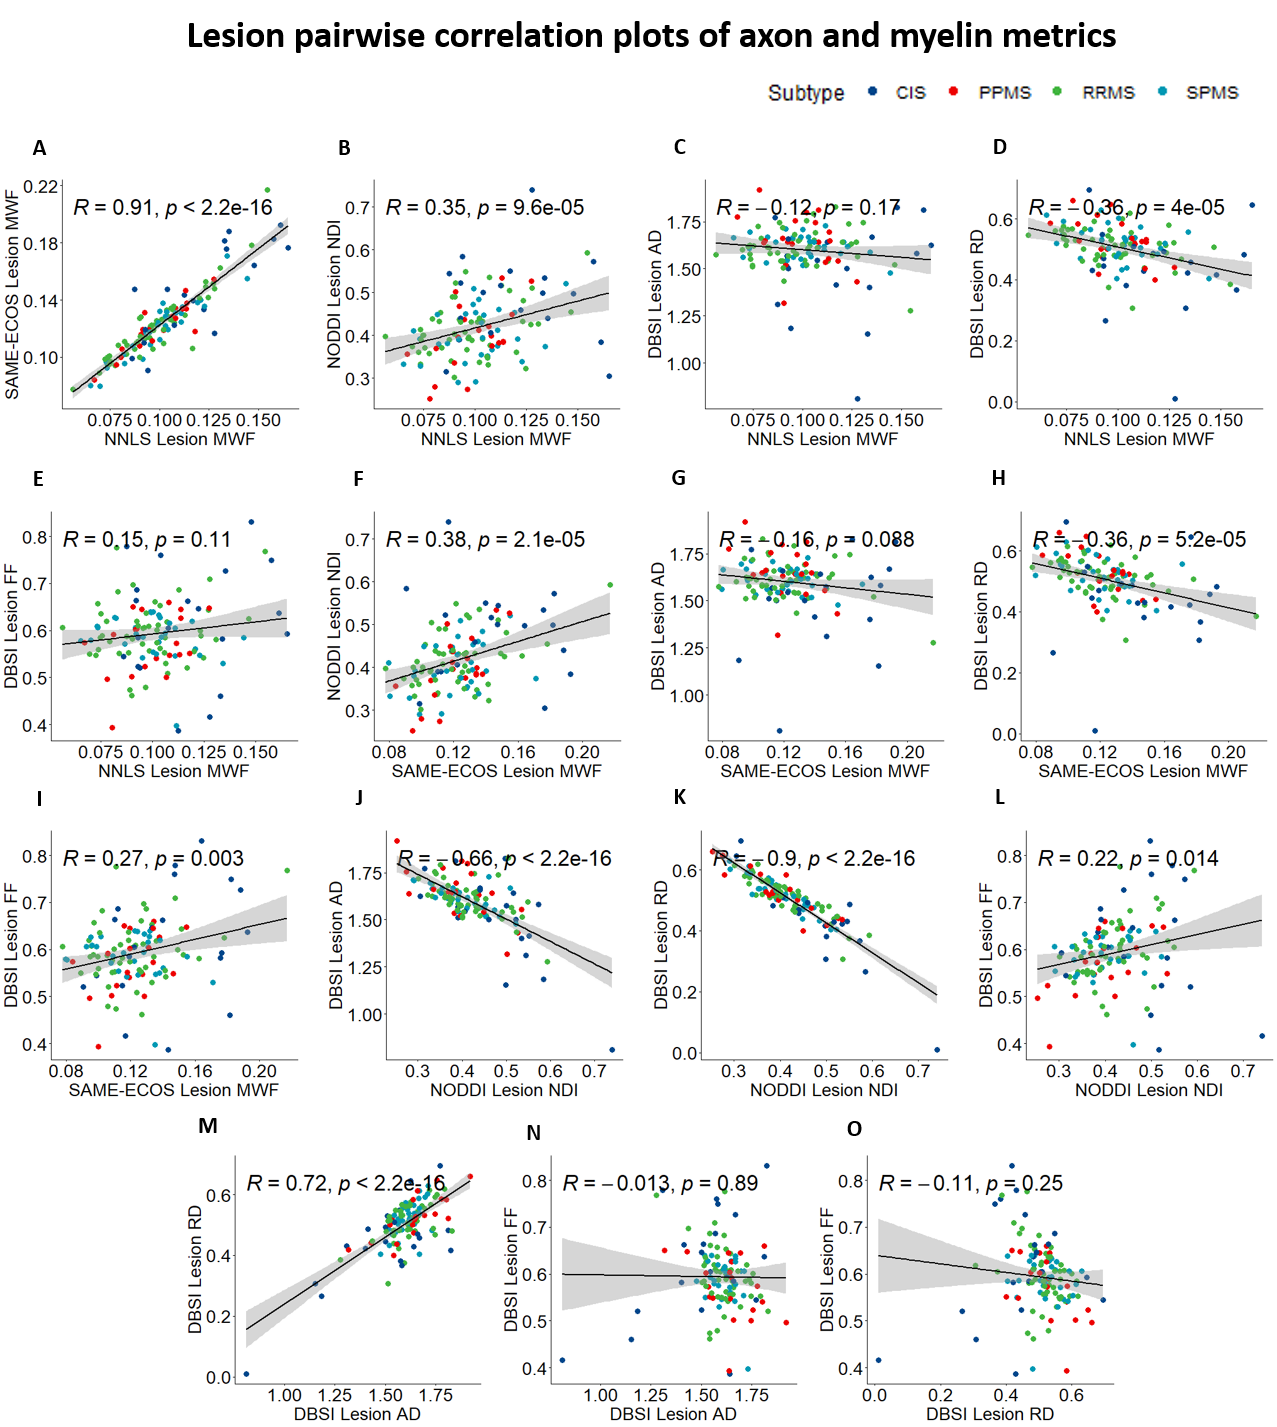
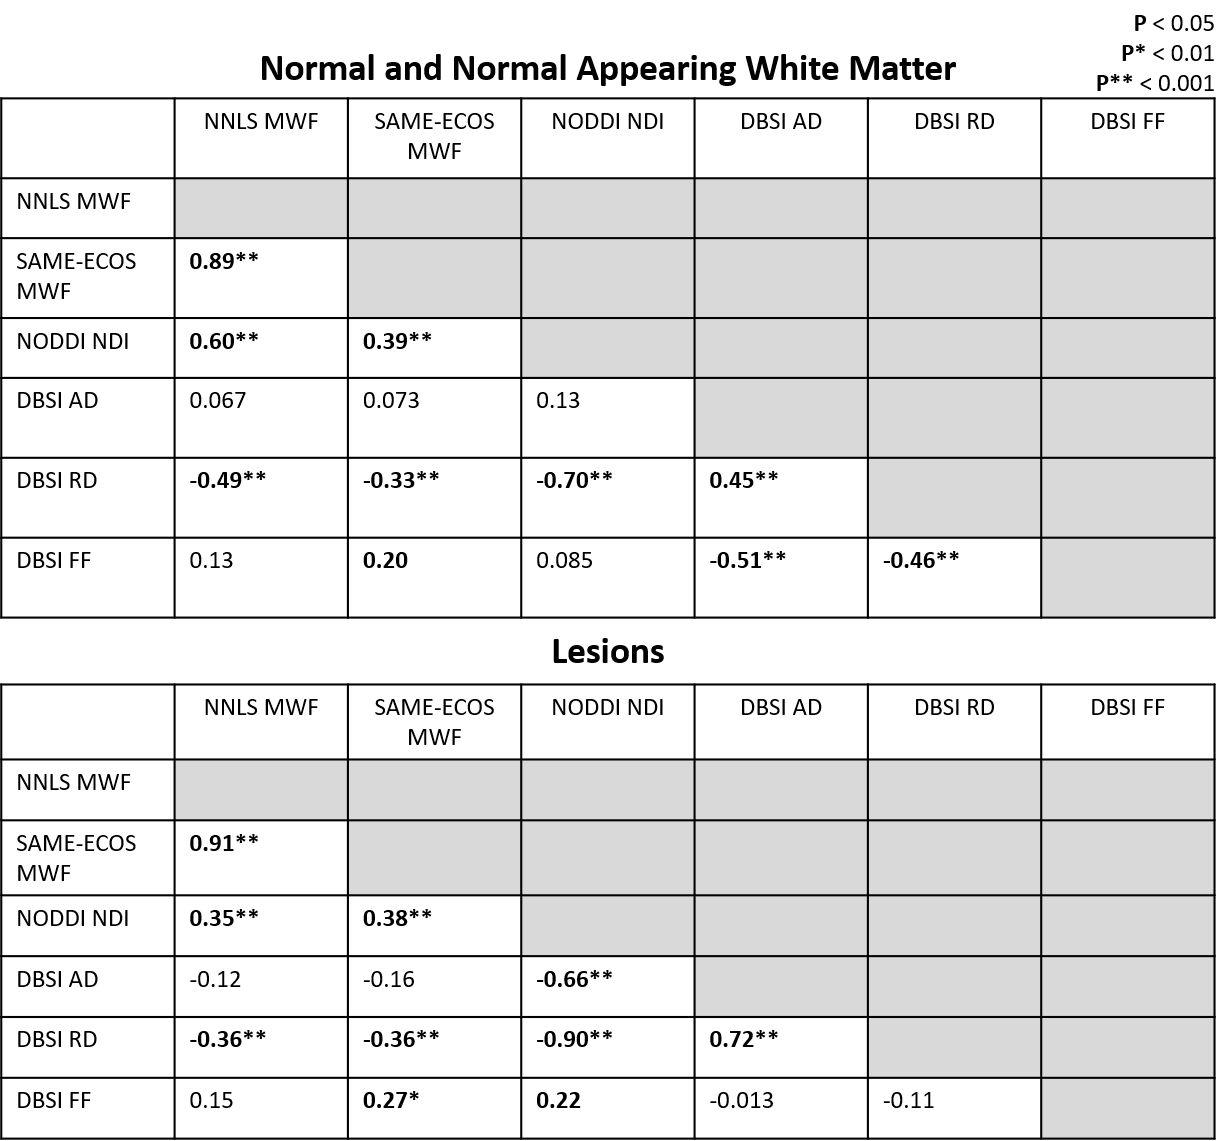
Representative maps are displayed in Figure 2. Correlation plots of pair-wise myelin and axon metrics comparisons are displayed in Figures 3 and 4. Correlation coefficients are summarized in Figure 5. NNLS and SAME-ECOS MWF correlated strongly with each other, in agreement with a previous study7, and correlated similarly with most other metrics.MWF correlated negatively with RD, suggesting that less myelin is related to increased diffusivity in the radial direction. NDI correlated strongly with RD and weakly/moderately with MWF; this disassociation is likely because RD is determined by inter-fiber diffusion freedom and would thus also reflect dendrite density (inter-dendritic space).
NDI was only weakly correlated with FF in lesions and not at all in white matter, which is surprising given that both metrics are meant to relate to axon density. NDI was however correlated with AD in lesions where the reduced neurite density is associated with increased extra-axonal space, resulting in increased diffusion. AD negatively correlated with FF in white matter, illustrating that an increase in AD could be related to a loss of axons. AD was not correlated with FF in lesions, which may be due to debris impacting axial diffusion.
Correlations between FF and RD, NDI and RD, and NDI and MWF may reflect some coupling between myelin and axonal pathology.
Conclusion
Weak correlations between MWF and DBSI radial diffusivity suggest they are quantifying similar microstructure characteristics to some extent, but are uniquely influenced by other factors. NODDI NDI correlated more strongly with myelin metrics than axonal metrics, suggesting it may be more sensitive to myelin changes. Further histological validation studies that compare these methods should be done to determine which metrics accurately characterize tissue microstructure and pathology.Acknowledgements
The collection of the data was funded by the MS Society of Canada and F. Hoffman La Roche. TSJ was funded by an UBC MS Connect Summer Studentship Award funded from the Christopher Foundation and an endMS Master’s Studentship award from the Multiple Sclerosis Society of Canada. Thank you to the MRI technologists at the UBC MRI Research Center, the neurologists and staff at the UBC MS Clinic, as well as the study participants and their families. This work was conducted on the traditional, ancestral, and unceded territories of Coast Salish Peoples, including the territories of the xwməθkwəy̓əm (Musqueam), Skwxwú7mesh (Squamish), Stó:lō and Səl̓ílwətaʔ/Selilwitulh (Tsleil- Waututh) Nations.References
1. The Multiple Sclerosis International Federation, Atlas of MS, 3rd Edition (September 2020).
2. Gholamzad M, Ebtekar M, Ardestani MS, et al. A comprehensive review on the treatment approaches of multiple sclerosis: currently and in the future. Inflammation Research. 2019;68:25-38. doi:https://doi.org/10.1007/s00011-018-1185-0.
3. Lubetzki C, Zalc B, Williams A, Stadelmann C, Stankoff B. Remyelination in multiple sclerosis: from basic science to clinical translation. The Lancet Neurology. 2020;19(8):678-688. doi:10.1016/S1474-4422(20)30140-X.
4. Laule C, Leung E, Li DKB, et al. Myelin water imaging in multiple sclerosis: quantitative correlations with histopathology. Multiple Sclerosis Journal. 2006;12(6):747-753. doi:10.1177/1352458506070928.
5. Whittall KP, Mackay AL. Quantitative interpretation of NMR relaxation data. Journal of Magnetic Resonance (1969). 1989;84(1):134-152. doi:10.1016/0022-2364(89)90011-5.
6. Prasloski T, Mädler B, Xiang Q-S, Mackay A, Jones C. Applications of stimulated echo correction to multicomponent T2 analysis. Magnetic Resonance in Medicine. 2011;67(6):1803-1814. doi:10.1002/mrm.23157.
7. Liu H, Joseph TS, Xiang Q-S, et al. A data-driven T2 relaxation analysis approach for myelin water imaging: Spectrum analysis for multiple exponentials via experimental condition oriented simulation (SAME-ECOS). Magn Reason Med. 2021. doi: 10.1002/mrm.29000.
8. Zhang H, Schneider T, Wheeler-Kingshott CA, Alexander DC. Noddi: Practical in vivo neurite orientation dispersion and density imaging of the human brain. NeuroImage. 2012;61(4):1000-1016. doi:10.1016/j.neuroimage.2012.03.072
9. Lakhani DA, Schilling KG, Xu J, Bagnato F. Advanced Multicompartment Diffusion MRI Models and Their Application in Multiple Sclerosis. AJNR Am J Neuroradiol. 2020;41(5):751-757. doi:10.3174/ajnr.A6484
10. Wang Y, Sun P, Wang Q, et al. Differentiation and quantification of inflammation, demyelination and axon injury or loss in multiple sclerosis. Brain. 2015;138(Pt 5):1223-1238. doi:10.1093/brain/awv046
11. Wang X, Cusick MF, Wang Y, et al. Diffusion basis spectrum imaging detects and distinguishes coexisting subclinical inflammation, demyelination and axonal injury in experimental autoimmune encephalomyelitis mice. NMR in Biomedicine. 2014;27(7):843-852. doi:10.1002/nbm.3129
12. Vavasour IM, Sun P, Graf C, et al. Characterization of multiple sclerosis neuroinflammation and neurodegeneration with relaxation and diffusion basis spectrum imaging. Multiple Sclerosis Journal. 2021:13524585211023345 . doi:10.1177/13524585211023345
13. Qian W, Khattar N, Cortina LE, Spencer RG, Bouhrara M. Nonlinear associations of neurite density and myelin content with age revealed using multicomponent diffusion and relaxometry magnetic resonance imaging. NeuroImage. 2020;223:117369. doi:10.1016/j.neuroimage.2020.117369
14. Oshio K, Feinberg DA. GRASE (Gradient-and Spin-Echo) imaging: A novel fast MRI technique. Magnetic Resonance in Medicine. 1991;20(2):344-349. doi:10.1002/mrm.1910200219
15. Wang Y, Wang Q, Haldar JP, et al. Quantification of increased cellularity during inflammatory demyelination. Brain. 2011;134(Pt 12):3590-3601. doi:10.1093/brain/awr307
16. Jenkinson M, Beckmann CF, Behrens TE, et al. FSL. Neuroimage. 2012; 62(2): 782–790. doi: 10.1016/j.neuroimage.2011.09.015.
17. Daducci A, Canales-Rodríguez EJ, Zhang H, Dyrby TB, Alexander DC, Thiran J-P. Accelerated Microstructure Imaging via Convex Optimization (AMICO) from diffusion MRI data. NeuroImage. 2015;105:32-44. doi:10.1016/j.neuroimage.2014.10.026
18. McAusland J, Tam RC, Wong E, Riddehough A, Li DK. Optimizing the use of radiologist seed points for improved multiple sclerosis lesion segmentation. IEEE Trans Biomed Eng. 2010;57(11). doi: 10.1109/TBME.2010.2055865.
19. Zhang, Y, Brady, M, Smith, S. Segmentation of brain MR images through a hidden Markov random field model and the expectation-maximization algorithm. IEEE Trans Med Imag, 20(1):45-57, 2001.
Figures