0203
Mapping the myelin bilayer with short-T2 MRI: Application to ex-vivo multiple sclerosis brain tissue1Institute for Biomedical Engineering, ETH Zurich and University of Zurich, Zurich, Switzerland, 2Neuroimmunology and MS Research Section, Neurology Clinic, University of Zurich, University Hospital Zurich, Zurich, Switzerland, 3Department of Neuroradiology, Clinical Neuroscience Center, University Hospital Zurich, University of Zurich, Zurich, Switzerland
Synopsis
Signal from the myelin bilayer can be captured using dedicated short-T2 imaging techniques, and analysis methods to isolate the contribution of the bilayer from other signal sources have been proposed. However, such analysis methods are often validated on samples in which the background water signal has been suppressed. Thus, it is unclear whether these techniques can successfully map myelin content in a clinical setting. Here, we apply and evaluate a previously proposed technique for myelin mapping to multiple sclerosis brain tissue without water suppression. We conclude that the quality of the myelin maps is comparable to that of water-suppressed samples.
Introduction
Myelin is of great importance in the proper functioning of the central nervous system. Diseases which compromise the integrity of the myelin sheath, such as multiple sclerosis (MS), thus present a substantial clinical burden in affected patients. Noninvasive mapping of the myelin sheath, whether it be for diagnosis, monitoring or treatment of demyelinating disorders, is therefore highly sought after. Most of the research toward myelin mapping with MRI has so far been focused on the analysis of signal stemming from water-bound protons1-3. However, in recent years it has been shown that short-T2 imaging technology is capable of capturing and resolving signal from non-aqueous protons4-8 such as those found in the myelin lipid-protein bilayer.Here, we explore the capability of short-T2 imaging techniques7-9 for mapping the myelin bilayer in brain samples from MS patients. This work extends on a previous study8 in which background water signal was suppressed through D2O exchange. In the present study, brain samples were imaged without such a preparation procedure, thus representing a more clinically relevant setup towards in-vivo application.
Methods
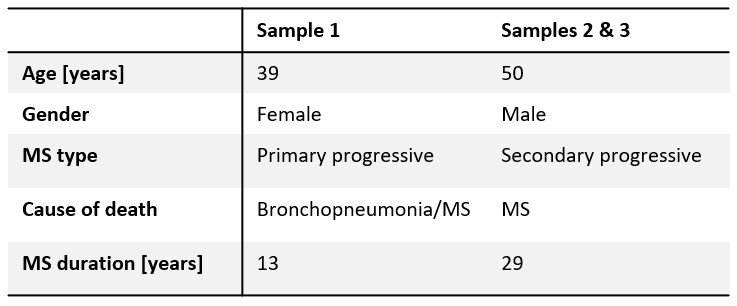
SamplesThree tissue slices of approximately 6x25x19 mm3 from two MS patients (UK brain bank) were studied. Details on the demographic features of the patients can be found in Table 1.
All samples were kept frozen at -80 °C and were thawed and subsequently immersed in physiological saline solution (9 g/L NaCl) prior to and during imaging.
Imaging
Specialised imaging techniques and hardware are necessary in order to capture the extremely rapidly decaying signal of the myelin bilayer. In this work, a 3T Philips Achieva system was used together with a high-performance gradient system capable of reaching a strength of over 200 mT/m at 100 % duty cycle10, fast transmit/receive switches11 and a proton-free loop coil of 40 mm diameter.
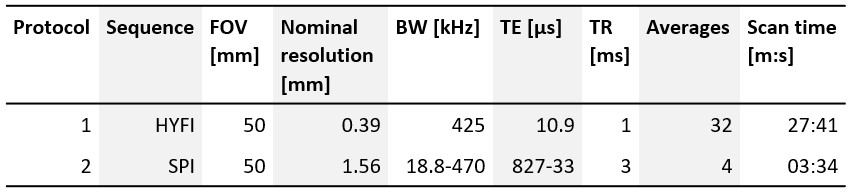
The imaging experiment consisted of two protocols. The first protocol comprised of a high-resolution reference scan, acquired with the zero-TE variant HYFI12. The second protocol consisted of 12 single-point imaging (SPI)13 images acquired at TE between 33-827 µs which were used for model fitting. Further details on the protocols can be found in Table 2.
Analysis
The analysis procedure applied to the SPI data aims to create amplitude maps for different signal components9. It is based on the signal model provided in Ref.7, which consists of three components, one representing the aqueous signal and two representing the non-aqueous signal, which are divided into an ultrashort and a short component. The ultrashort component is believed to represent the myelin bilayer, rendering the amplitude map for this component the desired myelin map. The amplitude map of the aqueous component represents a water map.
Interpolation was applied to all images, and the myelin map was masked based on the sample outline seen in the water map.
Histology
The tissue samples were cryosectioned (20 µm) and underwent myelin staining by immunohistochemistry for myelin oligodendrocyte glycoprotein (MOG, 1:50). The cryosections were collected from one side of each sample.
Results and Discussion
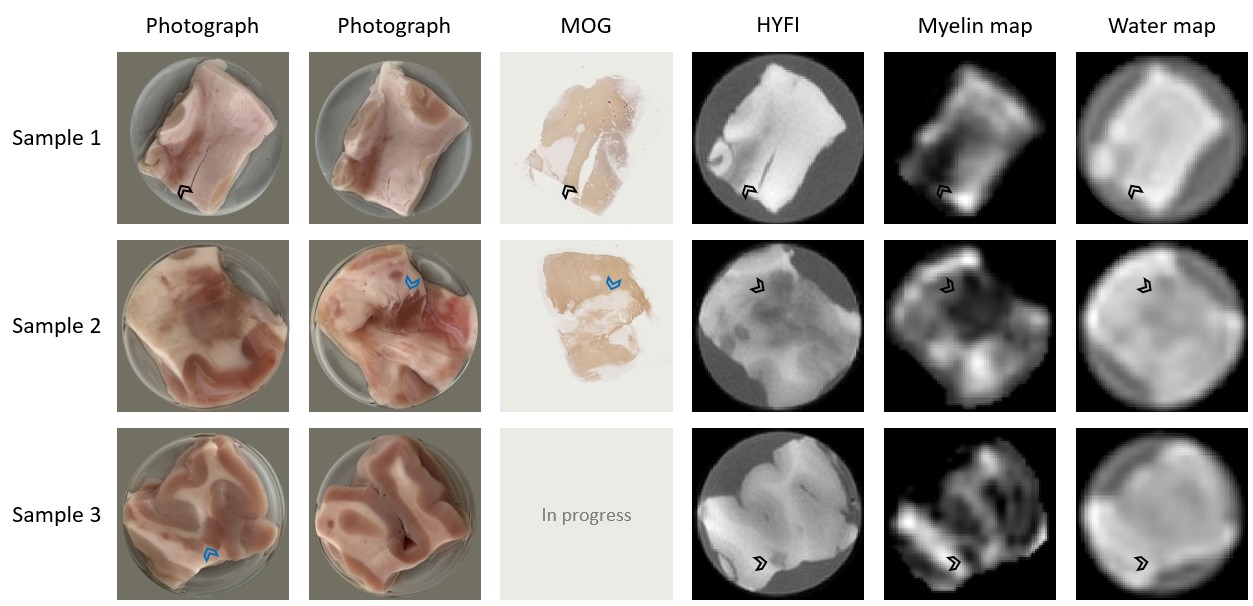
Visual photographs of both sides of the samples, MOG immunohistochemistry slides, HYFI reference images and the fitted amplitude maps for myelin and water content are presented in Figure 1. White matter (WM), grey matter (GM) and MS lesions are present in all samples, with MS lesions indicated by arrowheads.There is a clear correlation between all displayed images for each sample. However, due to the thickness of the samples and the resolution of the MR images, some topological sample features may vary slightly between photographs and MR slices and/or histology slides.
As expected from focal demyelinated pathology in MS, MS lesions have reduced intensity in the HYFI images. This is also true for GM, but because the reduction is nonuniform in MS lesions, commonly prevalent within WM regions, they are easily distinguishable from GM in most cases. However, the HYFI images depict the sum of all signal components, not only the myelin bilayer. The purpose of the fitting procedure on SPI data is to increase myelin specificity, but this comes at the cost of image resolution.
The fitted myelin maps show similar contrast to the HYFI images, but due to the coarser resolution and potential fit difficulties in low-SNR regions, the boundaries of WM, GM and MS lesion are less clear. That said, MS lesions are represented by significant signal dropouts which are observable in all displayed myelin maps.
Conclusion
Good correlation is observed between visual photographs, MOG immunohistochemistry, high-resolution reference MR images and fitted myelin maps for all samples. The myelin maps are of comparable quality to the maps presented in Ref.8 for D2O-exchanged MS tissue. Hence, we conclude that reducing background water signal is not required for successful application of myelin mapping procedures such as the one proposed in Ref.7.Overall, the results of this study demonstrate that myelin mapping based on bilayer signal is feasible for human tissue also in the presence of myelin-related disease pathology. This paves the way for application in-vivo, bearing in mind that the overall methodology will require adaptation before such studies can be performed.
Acknowledgements
The authors would like to thank Richard Reynolds from the UK MS Tissue Bank for providing brain samples from multiple sclerosis patients.References
1. Piredda GF, Hilbert T, Thiran J-P, Kober T. Probing myelin content of the human brain with MRI: A review. Magn Reson Med. 2021;85:627-652.
2. MacKay AL, Laule C. Magnetic Resonance of Myelin Water: An in vivo Marker for Myelin. Brain Plast. 2016;2:71-91.
3. Varma G, Duhamel G, de Bazelaire C, Alsop DC. Magnetization transfer from inhomogeneously broadened lines: A potential marker for myelin. Magn Reson Med. 2015;73:614-622.
4. Wilhelm MJ, Ong HH, Wehrli SL et al. Direct magnetic resonance detection of myelin and prospects for quantitative imaging of myelin density. Proc Natl Acad Sci. 2012;109:9605-9610.
5. Du J, Ma G, Li S et al. Ultrashort echo time (UTE) magnetic resonance imaging of the short T2 components in white matter of the brain using a clinical 3T scanner. NeuroImage. 2014;87:32-41.
6. Seifert AC, Li C, Wilhelm MJ, Wehrli SL, Wehrli FW. Towards quantification of myelin by solid-state MRI of the lipid matrix protons. NeuroImage. 2017;163:358-367.
7. Weiger M, Froidevaux R, Baadsvik EL, Brunner DO, Rösler MB, Pruessmann KP. Advances in MRI of the myelin bilayer. NeuroImage. 2020;217:116888.
8. Baadsvik EL, Weiger M, Froidevaux R, Faigle W, Ineichen BV, Pruessmann KP. Mapping myelin content in ex-vivo MS brain tissue using short-T2 MRI of the lipid-protein bilayer. In Proceedings of the 29th Annual Meeting of the ISMRM, Vancouver, Canada, 2021. p.2827.
9. Baadsvik EL, Weiger M, Froidevaux R, Faigle W, Ineichen BV, Pruessmann KP. Mapping the myelin bilayer with short-T2 MRI: Validation studies. Submitted to the 30th Annual Meeting of the ISMRM, London, UK, 2022.
10. Weiger M, Overweg J, Rösler MB et al. A high-performance gradient insert for rapid and short-T2 imaging at full duty cycle. Magn Reson Med. 2018;79:3256-3266.
11. Brunner DO, Furrer L, Weiger M et al. Symmetrically biased T/R switches for NMR and MRI with microsecond dead time. J Magn Reson. 2016;263:147-155.
12. Froidevaux R, Weiger M, Rosler MB, Brunner DO, Pruessmann KP. HYFI: Hybrid filling of the dead-time gap for faster zero echo time imaging. NMR in biomedicine. 2021;34:e4493.
13. Balcom BJ, MacGregor RP, Beyea SD, Green DP, Armstrong RL, Bremner TW. Single-point ramped imaging with T1 enhancement (SPRITE). J Magn Reson Ser A. 1996;123:131-134.
Figures