0202
Multiple sclerosis T2 lesion volume correlates weakly with myelin water fraction1Physics and Astronomy, University of British Columbia, Vancouver, BC, Canada, 2International Collaboration on Repair Discoveries, University of British Columbia, Vancouver, BC, Canada, 3Montreal Neurological Institute - Hospital, McGill University, Montreal, QC, Canada, 4Medicine, University of British Columbia, Vancouver, BC, Canada, 5Radiology, University of British Columbia, Vancouver, BC, Canada, 6School of Biomedical Engineering, University of British Columbia, Vancouver, BC, Canada, 7Pathology & Laboratory Medicine, University of British Columbia, Vancouver, BC, Canada
Synopsis
Multiple sclerosis (MS) lesion volume is commonly reported but is not pathologically specific or strongly associated with MS disability. Lesions are not necessarily demyelinated, which may be why lesion volume and disability are not strongly correlated. MS lesion volume was compared to Myelin Water Imaging (MWI) derived metrics related to myelin content (myelin water fraction) and inflammation (geometric mean T2) in MS normal appearing white matter and lesions. Weak correlations were observed between lesion volume and MWF, highlighting that the amount of lesional tissue does not reflect the degree of myelin damage within the brain.
Background
Multiple sclerosis (MS) lesions on conventional MRI are areas of damage characterized by inflammation, demyelination, and axon degeneration1. Lesion volume is a commonly reported measure in research and clinical trials but is not pathologically specific or strongly associated with MS disability2,3. This disassociation is likely because lesions are not necessarily demyelinated4. Remyelination and further damage changes lesion environments but may not change lesion volume on conventional imaging. Yet, lesions and myelin damage are often synonymous in literature.Damage within and beyond lesions can be probed using MRI metrics that are specific to myelin and inflammation. Myelin Water Imaging (MWI) is an MRI technique that quantifies different water pools based on T2 decay time and produces T2 spectra specific to local environment characteristics. Geometric Mean T2 (GMT2) of the intra/extracellular pool (40-200ms) is thought to increase when more water is present as a result of inflammation/edema5, as demonstrated by lesions having a higher GMT2 than normal appearing white matter (NAWM)6. Myelin Water Fraction (MWF) is the ratio of the short peak component (T2 < 40ms) to the whole T2 spectrum and has been demonstrated to correlate with histology staining for myelin7. The conventional analysis method for MWI data is a regularized non-negative least squares (NNLS) algorithm with refocusing flip angle optimization8,9. Previous work has shown that NNLS with strong χ2-regularization may still be susceptible to noise10. Recently, a new machine learning approach known as spectrum analysis for multiple exponentials via experimental condition orientated simulation (SAME-ECOS) has been developed to solve for T2 decay distributions using a supervised neural network11. SAME-ECOS was shown to be more robust than NNLS in the presence of noise11.
Objective
Using MWI, we investigated the common assumption that the amount of lesional tissue is reflective of the degree of myelin damage. Specifically, we assessed the correlations between lesion volume and (1) MWF (myelin content), (2) GMT2 (inflammation) from NNLS and SAME-ECOS in NAWM and MS lesions.Methods
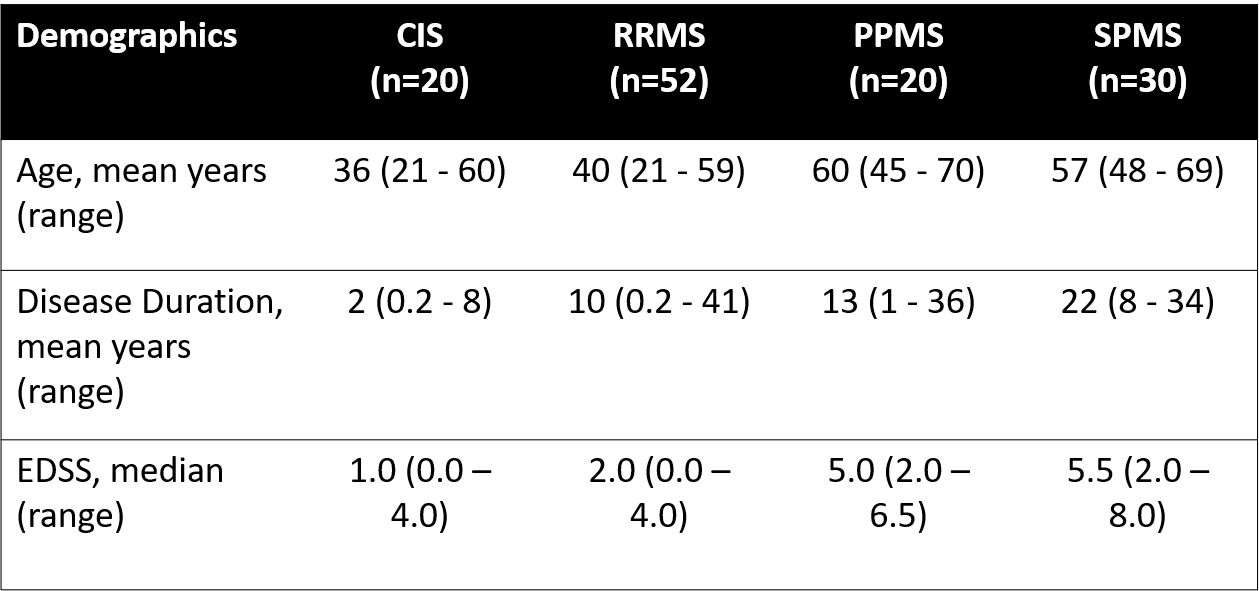
Data Collection: 122 MS participants (demographics in Figure 1) were scanned on a 3T MRI (Philips Achieva). Sequences included MWI 48-echo Gradient and Spin Echo (TR/TE=1073/8ms, resolution=1x1x2.5mm3)12, diffusion (99 directions, b values = 0–1500, TR/TE=4798/79ms, voxel size = 2×2×2mm3)13, 3DT1 (TR/TE=3000/3.5ms, TI=926ms, resolution=1x1x1mm3), and proton-density/T2-weighted (TR/TE1/TE2=2900/8.42/80ms, resolution=1x1x3mm3). MS participants were recruited from 2 studies using the same MRI protocol.Analysis: Voxel-wise GMT2 of the intra/extracellular pool (spectrum weighted mean 40ms< T2 < 200ms), and MWF maps (ratio of T2 < 40ms to whole spectrum) were made with NNLS8,9 and SAME-ECOS11. All maps were registered to 3DT1 space. CSF masks were made using thresholded diffusion b0 images. Lesion masks were segmented by an experienced radiologist using seed points on the PD/T2 images14, then registered to 3DT1. NAWM masks were made using FAST segmentation15 on 3DT1 images with lesion and CSF masks subtracted. Masks were overlaid on registered NNLS and SAME-ECOS maps to obtain mean region of interest (ROI) values in NAWM and lesions. Lesion volume was determined by the number of voxels in the lesion masks. The cube root was taken of the voxel number to maintain homoscedasticity. Pearson correlation coefficients compared all ROI metric means with lesion volume in all participants and in each disease phenotypes (significance was determined if p < 0.05).
Results
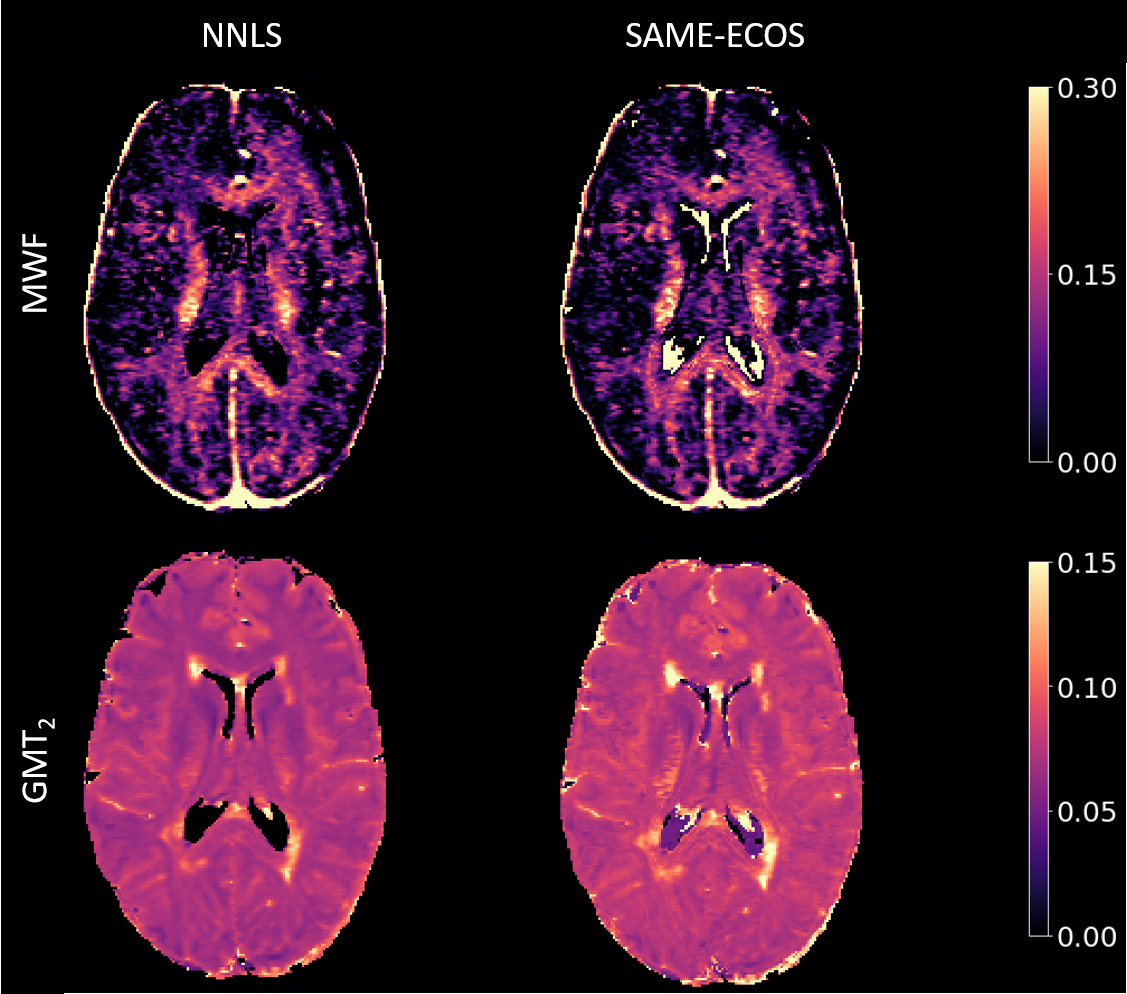
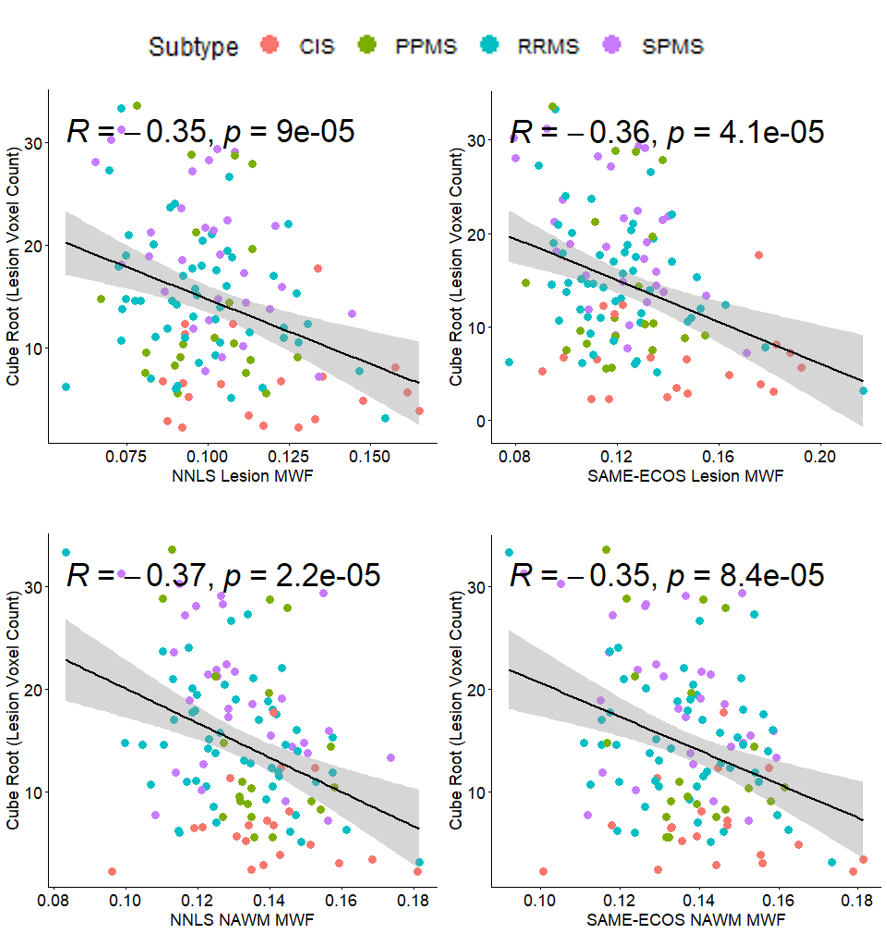
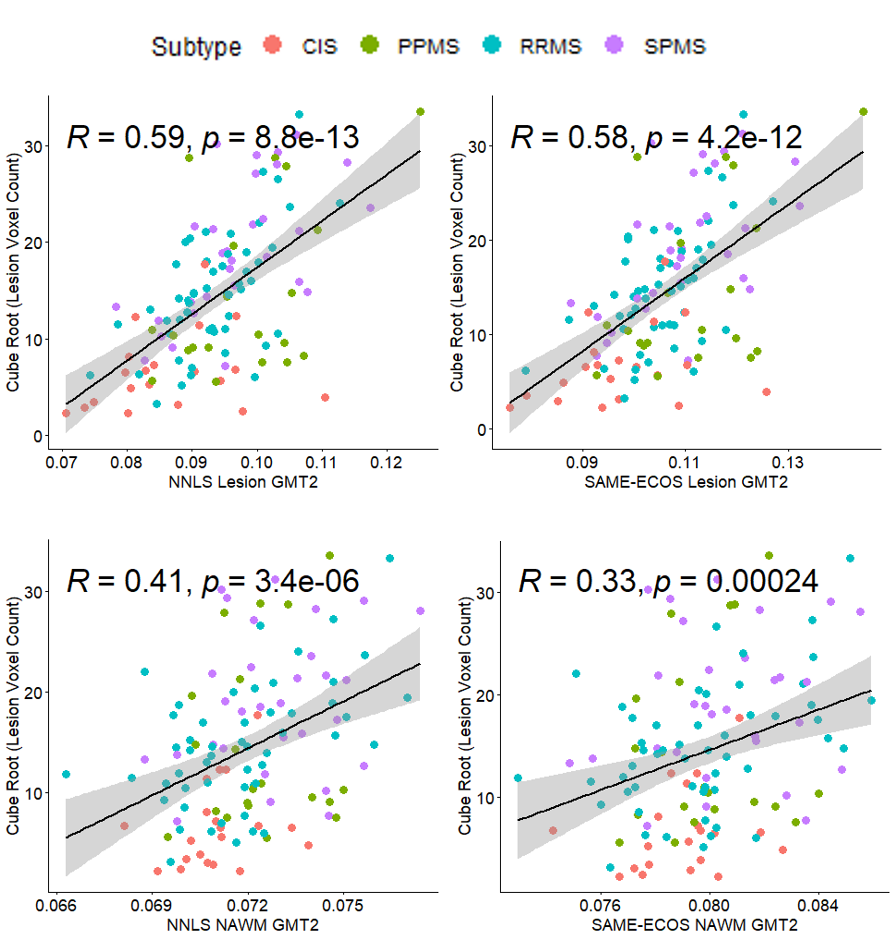
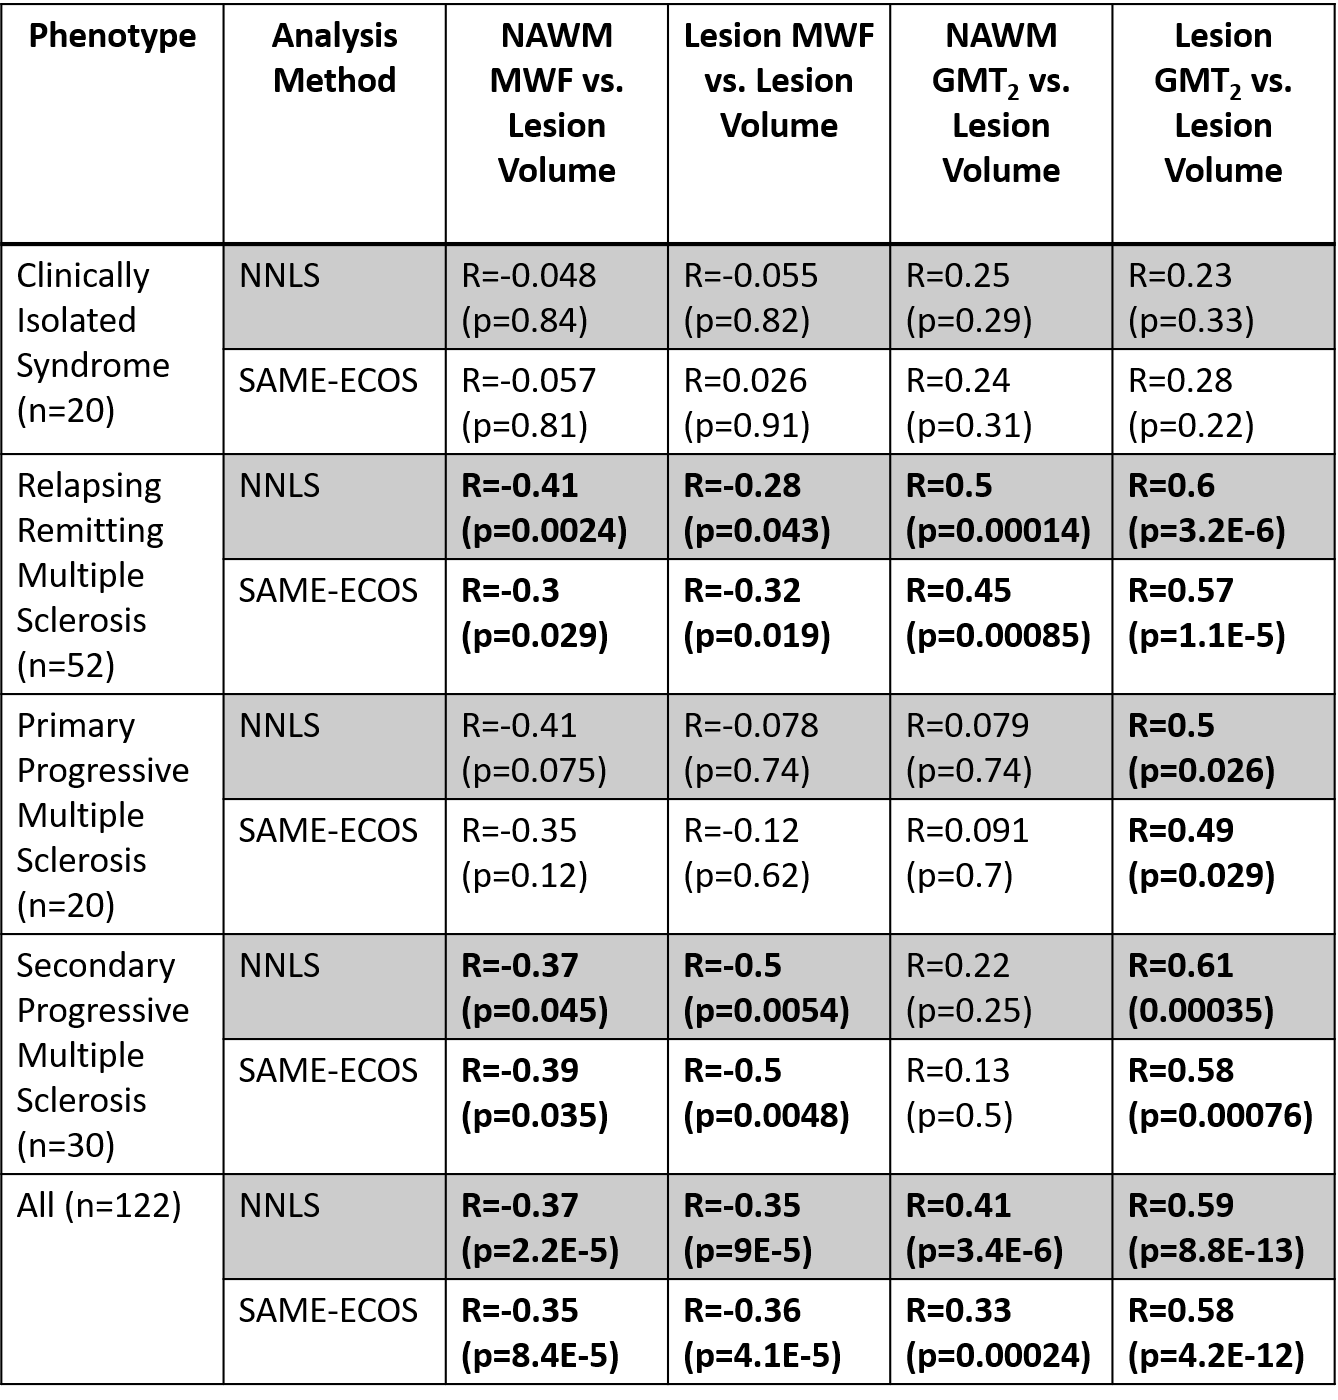
Figure 2 demonstrates representative MWF and GMT2 maps. Correlation plots between lesion volume and the MWI metrics are displayed in Figures 3 and 4. Lesion volume correlated weakly with lesion MWF (NNLS: R = -0.35, SAME-ECOS: R = -0.36), and moderately with lesion GMT2 (NNLS: R = 0.59, SAME-ECOS: R = 0.58). Lesion volume correlated weakly with NAWM MWF (NNLS: R= -0.37, SAME-ECOS: R = -0.35), and NAWM GMT2 (NNLS: R = 0.41, SAME-ECOS: R = 0.33). Figure 5 shows Pearson correlation coefficients between MWI metrics and lesion volume in different phenotypes.Discussion
Lesion volume was only weakly correlated with lesion MWF, which highlights the non-specific nature of lesion hyperintensities and may also include remyelination. Lesion volume was most strongly correlated with lesion GMT2, which suggests that as lesions occupy more and more space, water-associated pathology becomes more dominant. NNLS and SAME-ECOS produced similar correlations with both metrics in lesions and NAWM.Phenotype analysis found NAWM MWF weakly negatively correlated with lesion volume in secondary progressive MS (SPMS) and relapsing remitting MS (RRMS). Lesion MWF correlated moderately negatively with lesion volume in SPMS but only weakly in RRMS, which could mean increased lesion volume is associated with increased myelin damage in more progressive disease. Lesion GMT2 moderately correlated with lesion volume in RRMS, primary progressive MS (PPMS), and SPMS, which may be due to an increase in water mobility with inflammation or damage.
Conclusion
Weak correlations between MWF and lesion volume suggest that lesion pathology is complex and that lesion volume should not be equated with myelin loss. Lesion GMT2 most strongly correlated with lesion volume, suggesting the larger the lesional burden, the more water-associated pathology. Further histology studies are needed to determine what GMT2 changes are reflecting in tissue.Acknowledgements
The collection of the data was funded by the MS Society of Canada and F. Hoffman La Roche. TSJ was funded by an UBC MS Connect Summer Studentship Award funded from the Christopher Foundation and an endMS Master’s Studentship award from the Multiple Sclerosis Society of Canada. Thank you to the MRI technologists at the UBC MRI Research Center, the neurologists and staff at the UBC MS Clinic, as well as the study participants and their families. This work was conducted on the traditional, ancestral, and unceded territories of Coast Salish Peoples, including the territories of the xwməθkwəy̓əm (Musqueam), Skwxwú7mesh (Squamish), Stó:lō and Səl̓ílwətaʔ/Selilwitulh (Tsleil- Waututh) Nations.References
1. Institute of Medicine 2001. Multiple Sclerosis: Current Status and Strategies for the Future. Washington, DC: The National Academies Press. https://doi.org/10.17226/10031.
2. Mammi S, Filippi M, Martinelli V, et al. Correlation between brain MRI lesion volume and disability in patients with multiple sclerosis. Acta Neurologica Scandinavica. 1996;94(2):93-96. doi:10.1111/j.1600-0404.1996.tb07036.x
3. Ammitzbøll C, Dyrby TB, Lyksborg M, et al. Disability in progressive MS is associated with T2 lesion changes. Multiple Sclerosis and Related Disorders. 2018;20:73-77. doi:10.1016/j.msard.2017.12.010
4. Patani R, Balaratnam M, Vora A, Reynolds R. Remyelination can be extensive in multiple sclerosis despite a long disease course. Neuropathology and Applied Neurobiology. 2007;33(3):277-287. doi:10.1111/j.1365-2990.2007.00805.x
5. Liu H, Ljungberg E, Dvorak AV, et al. Myelin Water Fraction and Intra/Extracellular Water Geometric Mean T2 Normative Atlases for the Cervical Spinal Cord from 3T MRI. Journal of Neuroimaging. 2019;30(1):50-57. doi:10.1111/jon.12659
6. Laule C, Vavasour IM, Kolind SH, et al. Long T2 water in multiple sclerosis: What else can we learn from multi-echo T2 relaxation? Journal of Neurology. 2007;254(11):1579-1587. doi:10.1007/s00415-007-0595-7
7. Laule C, Leung E, Li DKB, et al. Myelin water imaging in multiple sclerosis: quantitative correlations with histopathology. Multiple Sclerosis Journal. 2006;12(6):747-753. doi:10.1177/1352458506070928
8. Whittall KP, Mackay AL. Quantitative interpretation of NMR relaxation data. Journal of Magnetic Resonance (1969). 1989;84(1):134-152. doi:10.1016/0022-2364(89)90011-5.
9. Prasloski T, Mädler B, Xiang Q-S, Mackay A, Jones C. Applications of stimulated echo correction to multicomponent T2 analysis. Magnetic Resonance in Medicine. 2011;67(6):1803-1814. doi:10.1002/mrm.23157
10. Wiggermann V, Vavasour IM, Kolind SH, Mackay AL, Helms G, Rauscher A. Non-negative least squares computation for in vivo myelin mapping using simulated multi-echo spin-echo T2 decay data. NMR in Biomedicine. 2020. doi:10.1002/nbm.4277
11. Liu H, Joseph TS, Xiang Q-S, et al. A data-driven T2 relaxation analysis approach for myelin water imaging: Spectrum analysis for multiple exponentials via experimental condition oriented simulation (SAME-ECOS). Magn Reason Med. 2021. doi: 10.1002/mrm.29000
12. Oshio K, Feinberg DA. GRASE (Gradient-and Spin-Echo) imaging: A novel fast MRI technique. Magnetic Resonance in Medicine. 1991;20(2):344-349. doi:10.1002/mrm.1910200219
13. Wang Y, Wang Q, Haldar JP, et al. Quantification of increased cellularity during inflammatory demyelination. Brain. 2011;134(Pt 12):3590-3601. doi:10.1093/brain/awr307
14. McAusland J, Tam RC, Wong E, Riddehough A, Li DK. Optimizing the use of radiologist seed points for improved multiple sclerosis lesion segmentation. IEEE Trans Biomed Eng. 2010;57(11). doi: 10.1109/TBME.2010.2055865.
15. Zhang, Y, Brady, M, Smith, S. Segmentation of brain MR images through a hidden Markov random field model and the expectation-maximization algorithm. IEEE Trans Med Imag, 20(1):45-57, 2001.
Figures