0201
A Multi-Stage 3D Patch-wise Deep Learning Algorithm for Detection of New Multiple Sclerosis Lesions in Longitudinal MRI1Division of biomedical engineering, Hankuk University of Foreign Studies, gyunggi-do,yongin-si, Korea, Republic of, 2College of Medicine, Catholic University of Korea, Seoul, Korea, Republic of, 3Department of Radiology, Seoul St. Mary's Hospital, Seoul, Korea, Republic of
Synopsis
Detecting changes in multiple sclerosis (MS) lesions through follow-up MR images is an important but time-consuming and subjective process. In this work, we propose a fully automatic deep learning-based method to detect new MS lesions. The model was trained and tuned using the MSSEG2 challenge dataset. First, the brain and spinal cord masks were generated, and registration between two time points was performed. Then, new lesions and whole lesions were segmented by patch-wise inputs, respectively. The final mask for new lesions was produced by comparing these two segmentations, and in this way we could effectively reduce false-positives.
Introduction
Multiple Sclerosis (MS) is the most common neuroinflammatory disease of the central nervous system (CNS), characterized by demyelination and chronic inflammation.1,2 Because dissemination in time and space are the important clinical and imaging characteristics of MS, assessing new lesions in longitudinal MRI scans is important in the diagnosis and management of MS patients. Manual detection and segmentation of lesion changes is time-consuming and prone to intra- and inter-observer variation, thus an automated and reliable method is required for clinical and research purposes.3 Several automatic methods to detect and quantify MS lesions and new MS lesion have been introduced.4-8 However, there still remain several problems to train regarding methods for identifying new MS lesions. For example, it is difficult to match the lesions due to a change in size and overlapping areas. In this study, we introduce a fully automated, deep learning-based algorithm to detect new MS lesions from two FLAIR images taken at different time points.Method
[Dataset]The data of 100 patients provided by the MSSEG2 Challenge were used in this study.9 The dataset consisted of a pair of 3D FLAIR images taken at different time points. The second 3D FLAIR sequence was taken 1 to 3 years after the first one, and the ground truth segmentations for new lesions were provided (confirmed by 4 expert neuroradiologists). We split the dataset into training (N=80 patients) and validation (N=20) sets, and additional external validation was performed on independent datasets (N=3) from our institution. The FLAIR images were acquired from 15 different scanner models including both 1.5T and 3T.
[Deep learning model architecture]
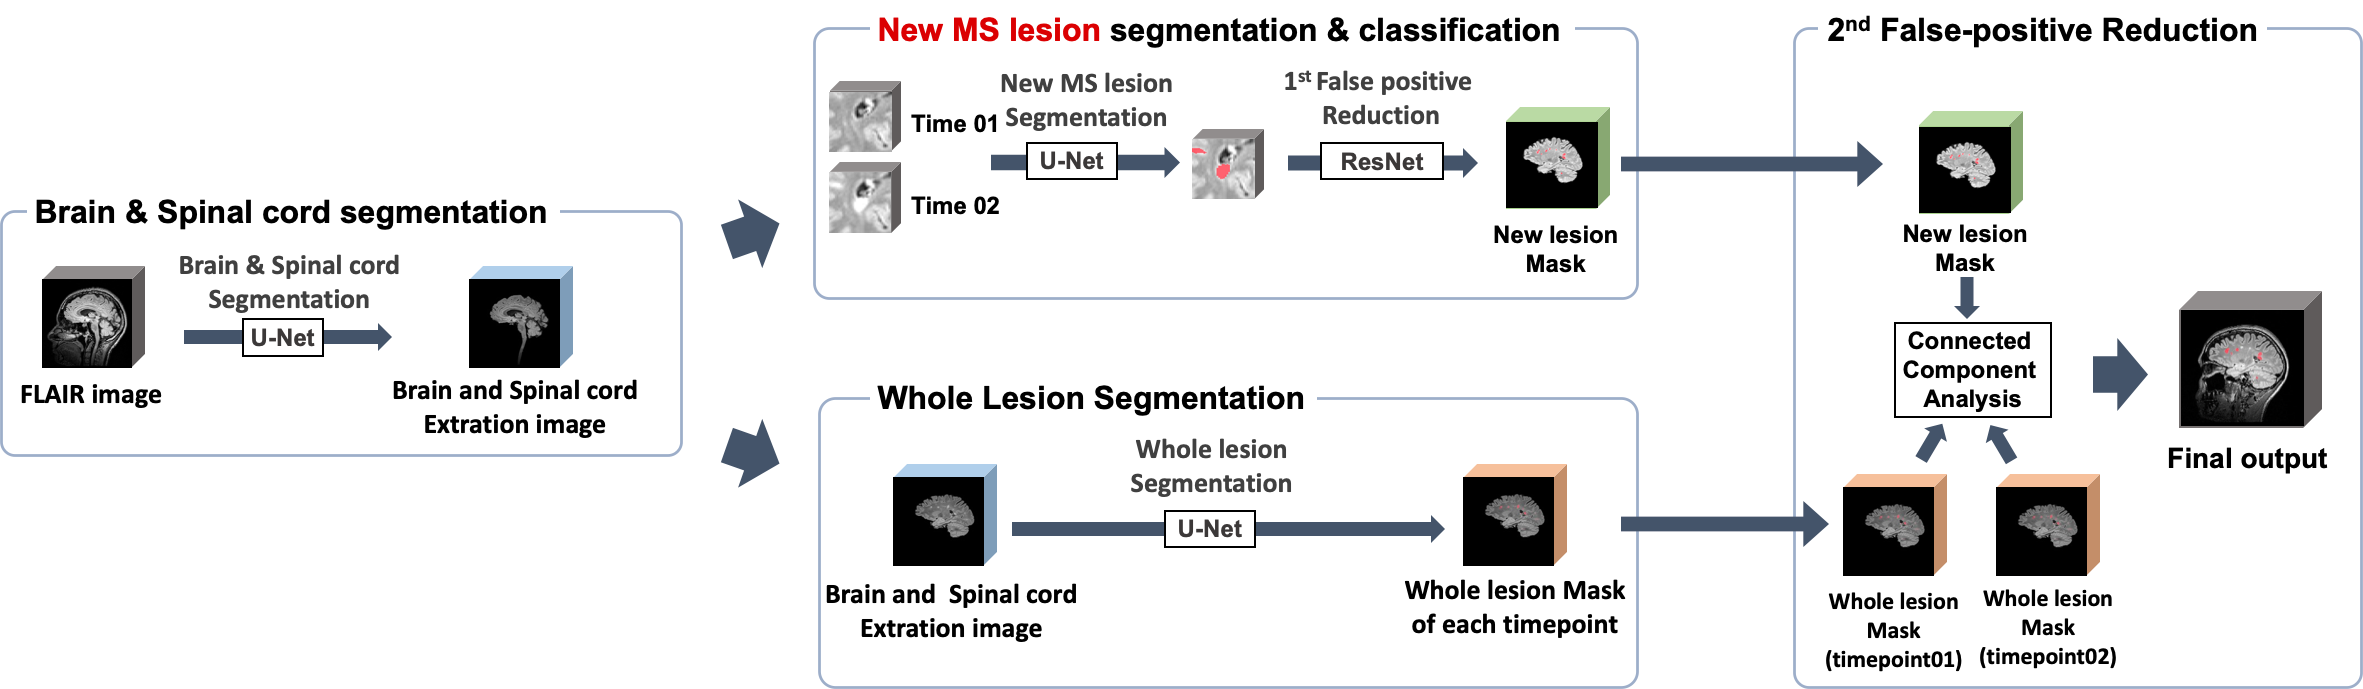
Our proposed method is summarized in Figure 1. This method is composed of several steps. Firstly, a 3D U-net was utilized for brain and spinal cord segmentation. Then, new lesion segmentation and whole lesion segmentation were performed in the segmented brain regions for identifying new lesions. For the final step, connected component analysis was used for removing the remaining false positives (FPs).
A detailed explanation of each step is as follows:
- New lesion segmentation (Step1): Candidate lesion detection was performed by a new lesion segmentation step. A 3D UNETR was used for training.11 UNETR is a U-shaped network using a transformer as the encoder. The baseline and follow-up FLAIR images were concatenated as input for training, and the new lesion mask provided was used as the ground truth. Due to its design to obtain a result with high sensitivity, it was necessary to exclude the false positives(FPs). So, FPs were removed by patchwise classification using 3D ResNet.
- Whole Lesion Segmentation (Step2): The next step was segmenting whole MS lesions. A 3D UNETR was used for training.11 The model was trained with input as the whole brain image and output as labels of candidate lesions. Labels were initially generated by the lesion segmentation tool(LST) and then manually corrected.12
- Final False-Positive Reduction (Step3) : Using masks obtained from step1 and step 2 respectively, connected component analysis was used for removing the remaining FPs. So, out of the new lesion candidates from step1, only those that overlapped with the follow-up lesion segmentation but not with the initial lesion segmentation were used as the final lesion mask.
$$LossFunction(total) =w_{1}*CrossEntropyLoss + w_{2}*DiceCoefficient Loss+w_{3}*TverskyLoss$$
[Evaluation]
Our experiment was implemented with 5-fold cross validation. The performance for new lesion segmentation was evaluated using the dice similarity coefficient and F1 score. Performance evaluation on the external dataset was done by visual assessment between two time point FLAIR images.
Results and Discussion
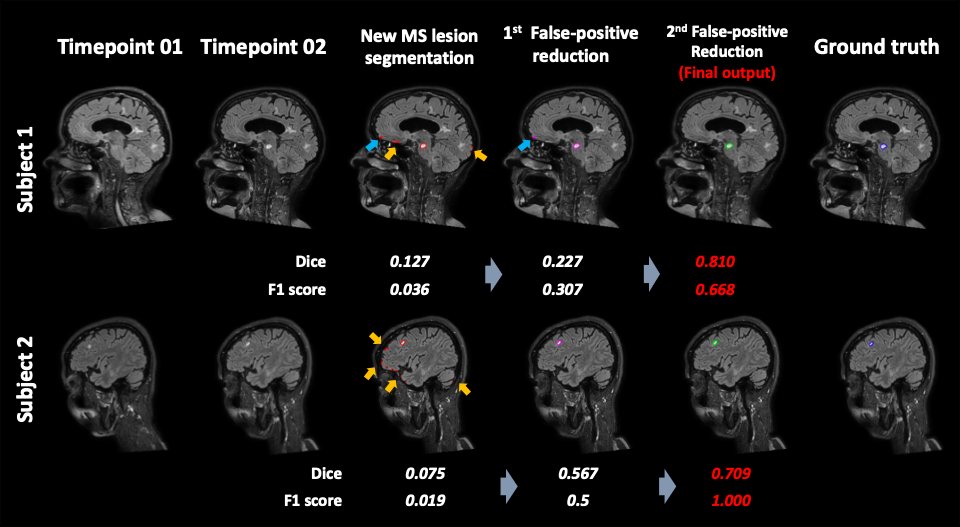
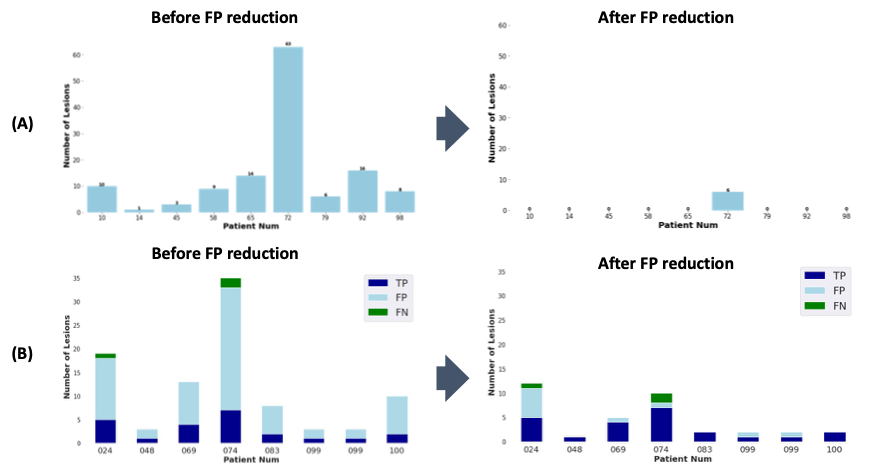
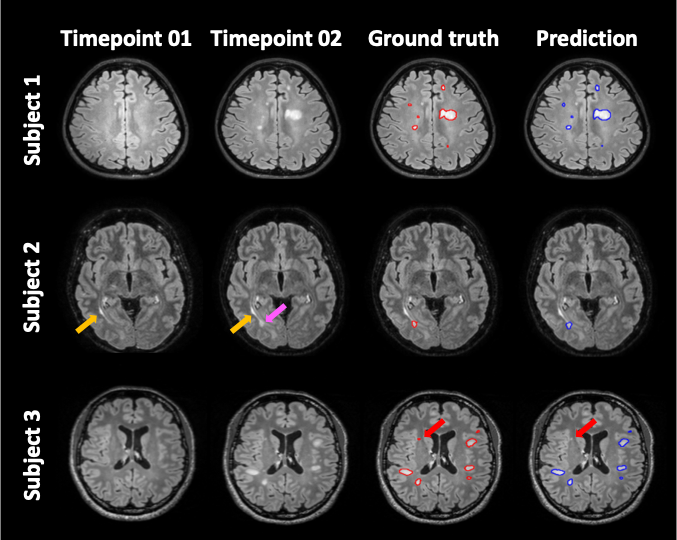
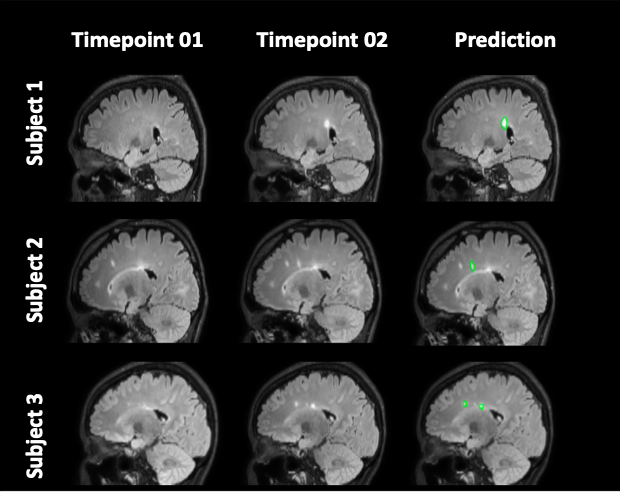
Figure 2 shows representative images of the results in each step. The inference time for the entire process was less than 3 minutes per a subject. The results showed that FPs decreased through sequential steps and both the dice and F1 scores increased. The final Dice score and F1 score for our results were 0.467 (0.273) and 0.644 (0.237), respectively. Figure 3 summarizes the performance of the FP reduction process for the validation set. The results showed our method could reduce FPs without noticeable reducing the TPs. Figure 4 is an example of a challenging case, a large portion of the lesion in the second time point overlapped with the lesion in the first time point. In these cases, our model accurately classified and segmented only the new lesions, distinguishing areas that already existed at the first timepoint. Figure 5 shows the representative results of our external dataset. For our 3 external subjects with a total of 14 new lesions, all new lesions were successfully detected except for only one lesion and there was no FP.Conclusion
We proposed a fully-automatic algorithm for the detection of new MS lesions consisting of three consecutive steps. The proposed multi-stage method can narrow down the regions of FPs, so it can rule out the outliers from the workflow. The results suggest that it could be a helpful and efficient tool for detecting and analyzing new MS lesions.Acknowledgements
This work was carried out in collaboration with The Observatoire Français de la Sclérose en Plaques (OFSEP), who is supported by a grant provided by the French State and handled by the“Agence Nationale de la Recherche,” within the framework of the “Investments for the Future” program, under the reference ANR-10-COHO-002, by the Eugène Devic EDMUS Foundation against multiple sclerosis and by the ARSEP Foundation. This work was supported by a grant (NRF-2020R1F1A1070517) of the Basic Science Research Program through the National Research Foundation of Korea.
References
1. Gaetani L, Prosperini L, Mancini A, et al. 2017 revisions of McDonald criteria shorten the time to diagnosis of multiple sclerosis in clinically isolated syndromes. J Neurol. 2018;265(11):2684-2687.
2. Berer K, Krishnamoorthy G. Microbial view of central nervous system autoimmunity. FEBS Lett. 2014;588(22):4207-4213.
3. Ashton EA, Takahashi C, Berg MJ, Goodman A, Totterman S, Ekholm S. Accuracy and reproducibility of manual and semiautomated quantification of MS lesions by MRI. Journal of Magnetic Resonance Imaging: An Official Journal of the International Society for Magnetic Resonance in Medicine. 2003;17(3):300-308.
4. Kamraoui RA, Ta V, Tourdias T, Mansencal B, Manjon JV, Coupé P. Towards broader generalization of deep learning methods for multiple sclerosis lesion segmentation. arXiv preprint arXiv:2012.07950. 2020.
5. Krüger J, Opfer R, Gessert N, et al. Fully automated longitudinal segmentation of new or enlarged multiple sclerosis lesions using 3D convolutional neural networks. NeuroImage: Clinical. 2020;28:102445.
6. Dou Q, Yu L, Chen H, et al. 3D deeply supervised network for automated segmentation of volumetric medical images. Med Image Anal. 2017;41:40-54.
7. Gros C, Lemay A, Cohen-Adad J. SoftSeg: Advantages of soft versus binary training for image segmentation. Med Image Anal. 2021;71:102038.
8. Carass A, Roy S, Jog A, et al. Longitudinal multiple sclerosis lesion segmentation: Resource and challenge. Neuroimage. 2017;148:77-102.
9. Commowick O, Cervenansky F, Cotton F, Dojat M. MSSEG-2 challenge proceedings: Multiple sclerosis new lesions segmentation challenge using a data management and processing infrastructure. . 2021:1-118.
10. Salehi SSM, Erdogmus D, Gholipour A. Tversky loss function for image segmentation using 3D fully convolutional deep networks. . 2017:379-387.
11. Hatamizadeh A, Tang Y, Nath V, et al. Unetr: Transformers for 3d medical image segmentation. arXiv preprint arXiv:2103.10504. 2021.
12. Schmidt P, Gaser C, Arsic M, et al. An automated tool for detection of FLAIR-hyperintense white-matter lesions in multiple sclerosis. Neuroimage. 2012;59(4):3774-3783.
Figures