0199
Improved Automated Central Vein Sign Assessment by Multi-Level Classification1Advanced Clinical Imaging Technology, Siemens Healthcare AG, Lausanne, Switzerland, 2Department of Radiology, Lausanne University Hospital and University of Lausanne, Lausanne, Switzerland, 3Signal Processing Laboratory (LTS 5), Ecole Polytechnique Fédérale de Lausanne (EPFL), Lausanne, Switzerland, 4Translational Neuroradiology Section, National Institute of Neurological Disorders and Stroke, National Institutes of Health (NIH), Bethesda, MD, United States, 5Department of Neurology, Cedars-Sinai Medical Center, Los Angeles, CA, United States
Synopsis
Central vein sign (CVS) assessment has shown potential to improve differential diagnosis in multiple sclerosis, but automating this task remains non-trivial. As human inter-rater agreement was reported to improve by separating the tasks of lesion exclusion and CVS assessment, we hypothesized that this could also benefit automated CVS assessment. To test this hypothesis, we implemented a novel multi-level classifier for automated CVS assessment and trained and evaluated it in more than 9400 expert-reviewed lesions. The new approach outperforms previous methods, achieving per-class accuracies of 76%–83% in an unseen testing set and >90% accuracy to identify MS cases.
Introduction
Misdiagnosis with potentially harmful consequences for patients is unfortunately not uncommon in multiple sclerosis (MS) and was estimated to affect up to 20% of patients1. Assessment of the fraction of white matter lesions exhibiting a central vein, referred to as the central vein sign (CVS), has shown the potential to distinguish MS from other mimicking diseases and thereby potentially reduce misdiagnoses2–5. Manual CVS assessment can, however, be tedious and very time-consuming, rendering it unfeasible in clinical routine. To address this problem, automated approaches have been proposed6–8, but the task remains non-trivial. In particular, the selection of lesions that should be included in the assessment per the NAIMS criteria9 has proven to be challenging. As human inter-rater agreement was reported to improve by separating the tasks of lesion exclusion and CVS assessment10, we hypothesized that this approach could also benefit automated CVS assessment. To test this hypothesis, we implemented a novel multi-level classifier for automated CVS assessment that implements this separation and trained and evaluated it in a large dataset of more than 9400 expert-reviewed lesionsMethods
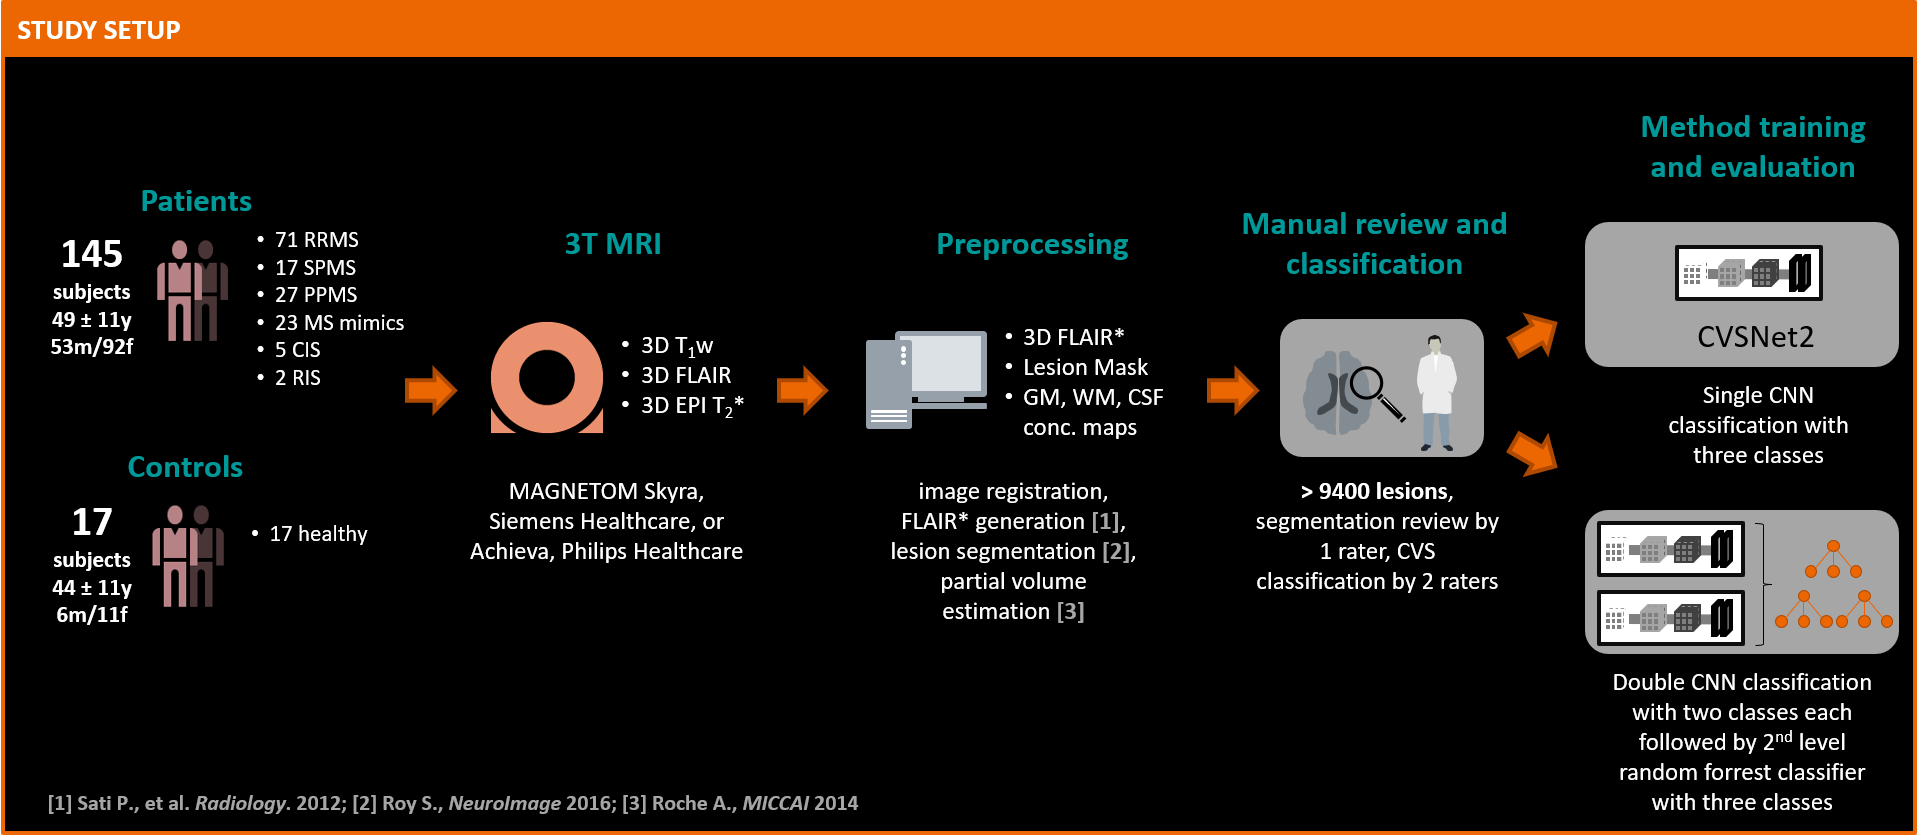
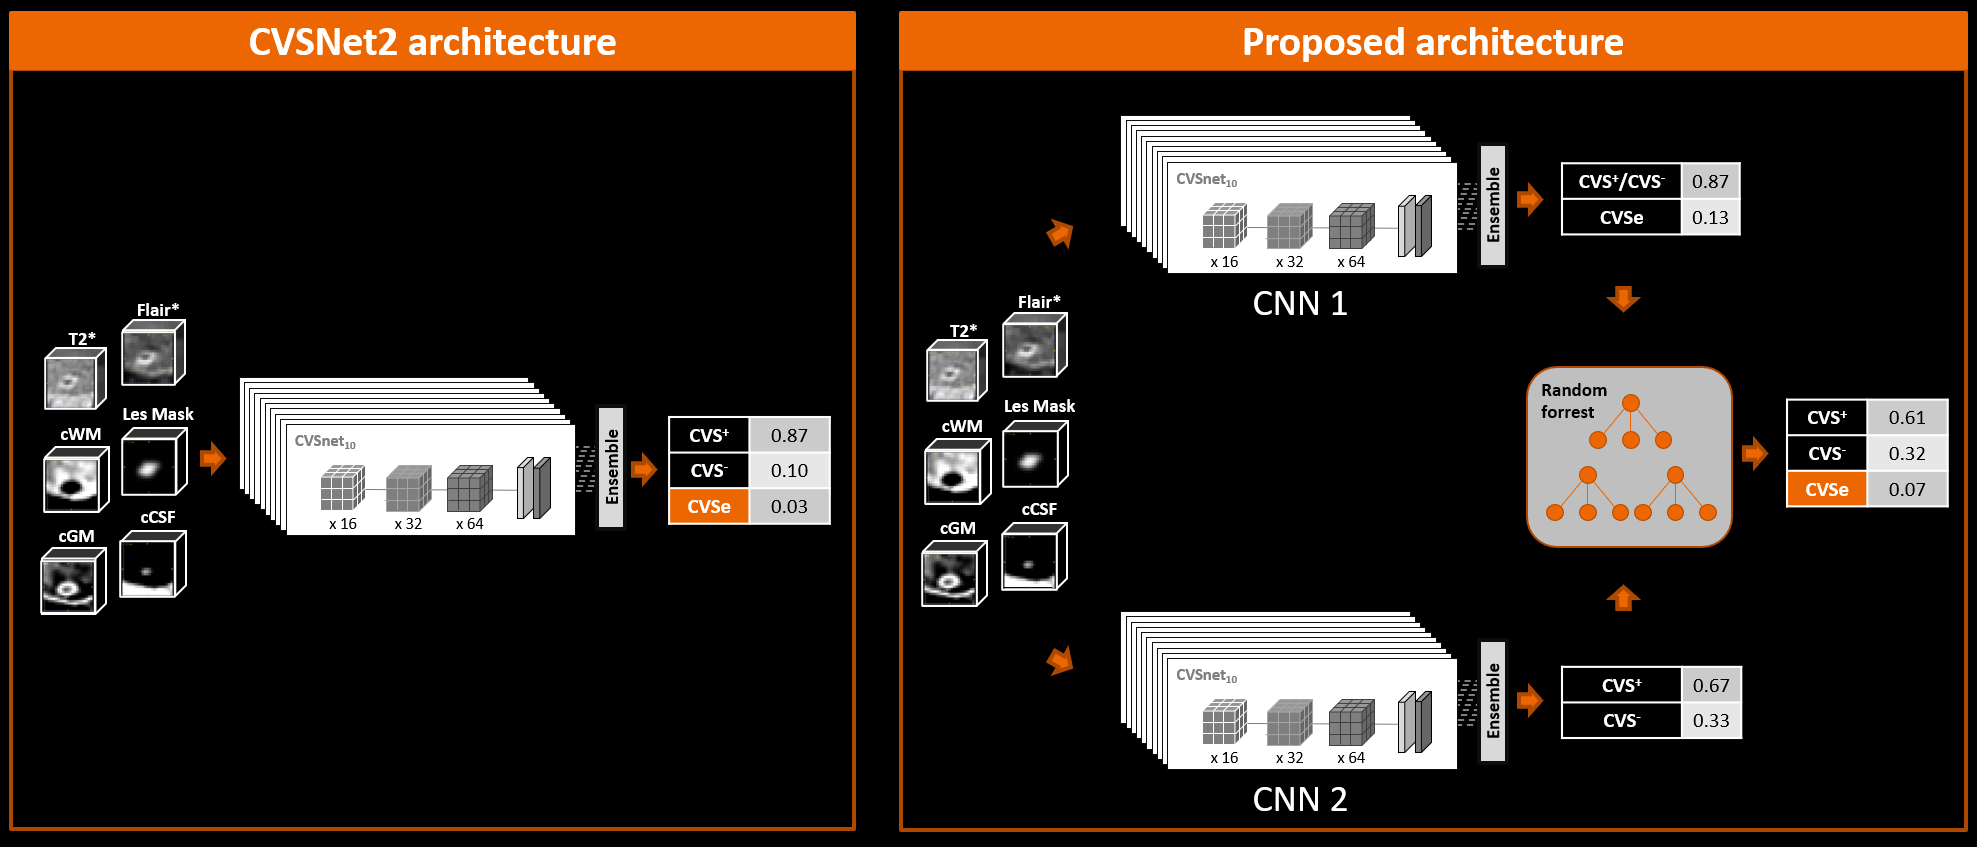
Figure 1 illustrates the workflow. 145 patients with established MS, CIS, or RIS diagnosis or an MS mimic (RRMS 71; SPMS 17; PPMS 27; CIS 5; RIS 2; MS mimic 23; mean±SD age: 49±11 yrs; 53m/92f), and healthy controls (n=17; age: 44±11 yrs; 6m/11f) were included. Subjects underwent 3T brain MRI (MAGNETOM Skyra, Siemens Healthcare, Erlangen, Germany, or Achieva, Philips Healthcare, Best, Netherlands). 3D T1w MPRAGE, 3D T2-FLAIR, and 3D T2*w segmented EPI acquisitions were performed. Images were rigidly registered to the FLAIR space, and FLAIR* images were generated11. Brain lesions, were automatically segmented12 and quality-controlled by a single rater. CVS assessment was conducted on FLAIR* images by two raters, according to the NAIMS guidelines, yielding 3458 CVS+, 2570 CVS−, and 3408 excluded lesions (CVSe). Two classification architectures were compared: A convolutional neural network (CNN) based on the CVSNet architecture7 and a new model using a combination of two CVSNet type CNNs for classification of: (I) CVS+/CVS- vs. CVSe; and (II) CVS+ vs. CVS- followed by a random forest second level classifier with 500 trees using the outputs of the CNNs as input for a final classification (classifier ensembling by stacking) (Figure 2). Both model architectures were trained using 8007 lesion samples (2914 CVS+, 2180 CVS−, 2913 CVSe) from 115 subjects and evaluated in 1429 randomly chosen samples (544 CVS+, 390 CVS−, 495 CVSe, from 30 unseen subjects (RRMS 14, SPMS 3, PPMS 5, CIS 1, MS mimic 4, healthy controls 3). For training the CNN (II), all lesions with veins were considered CVS+ even if CVSe. All CNNs used small 3D patches extracted around each lesion from the following contrasts as separate input channels: FLAIR*, T2*, lesion mask, and CSF and gray/white matter concentration maps obtained from a partial-volume estimation algorithm13. Lesion-wise classification performance was evaluated for both classification architectures by calculating per-class sensitivity, specificity, and accuracy together with overall accuracy. For the multi-level architecture, performance was also evaluated subject-wise.Results
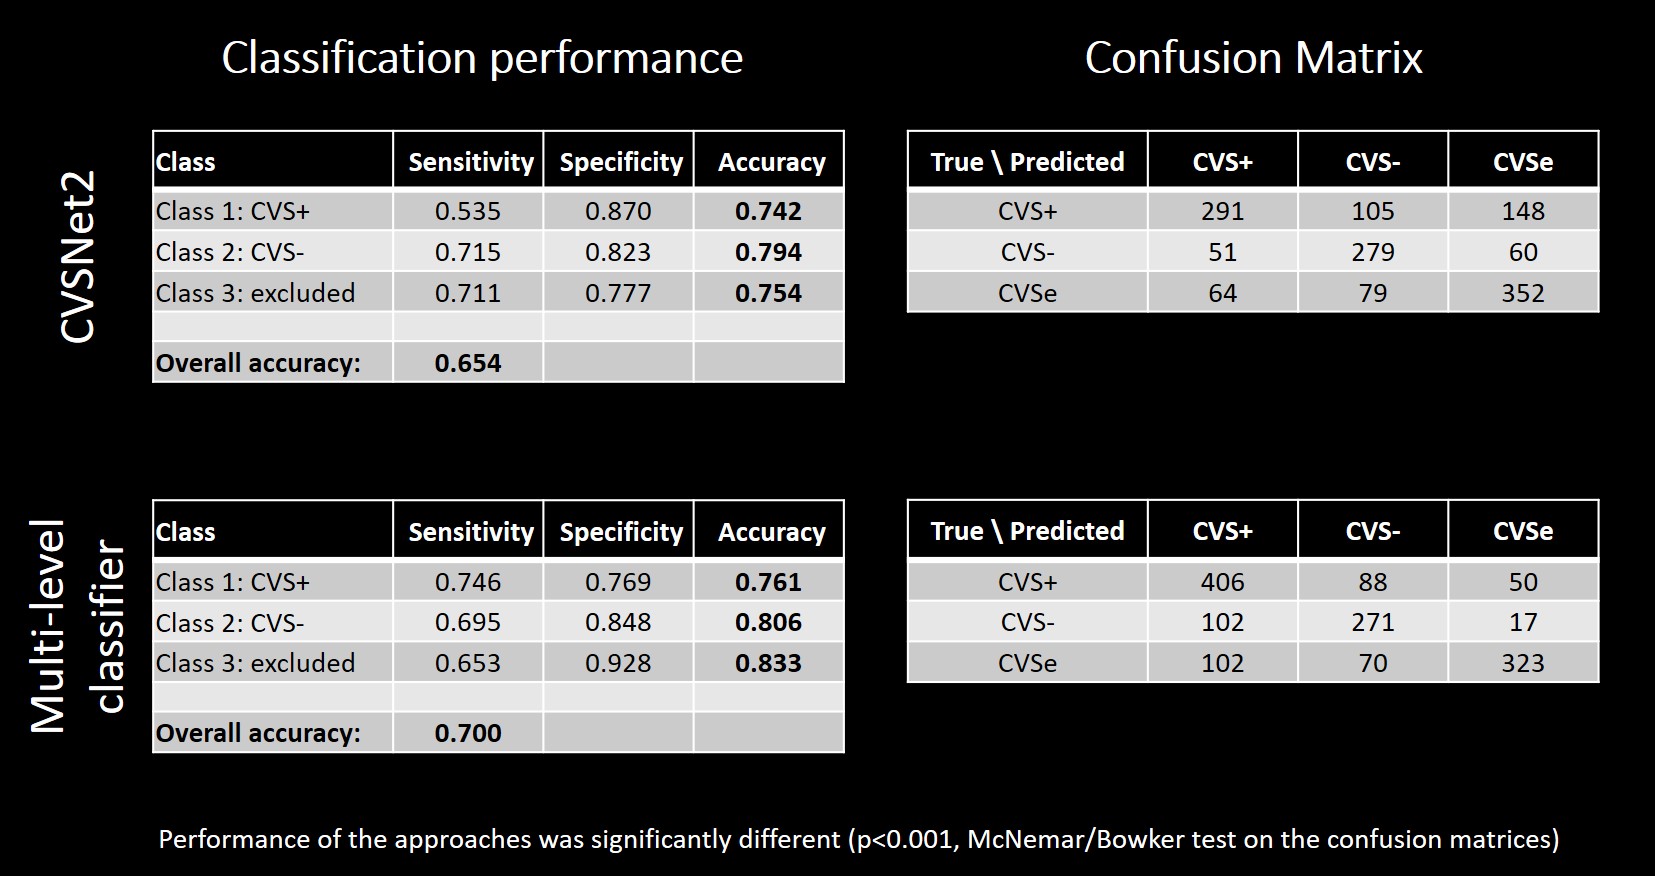
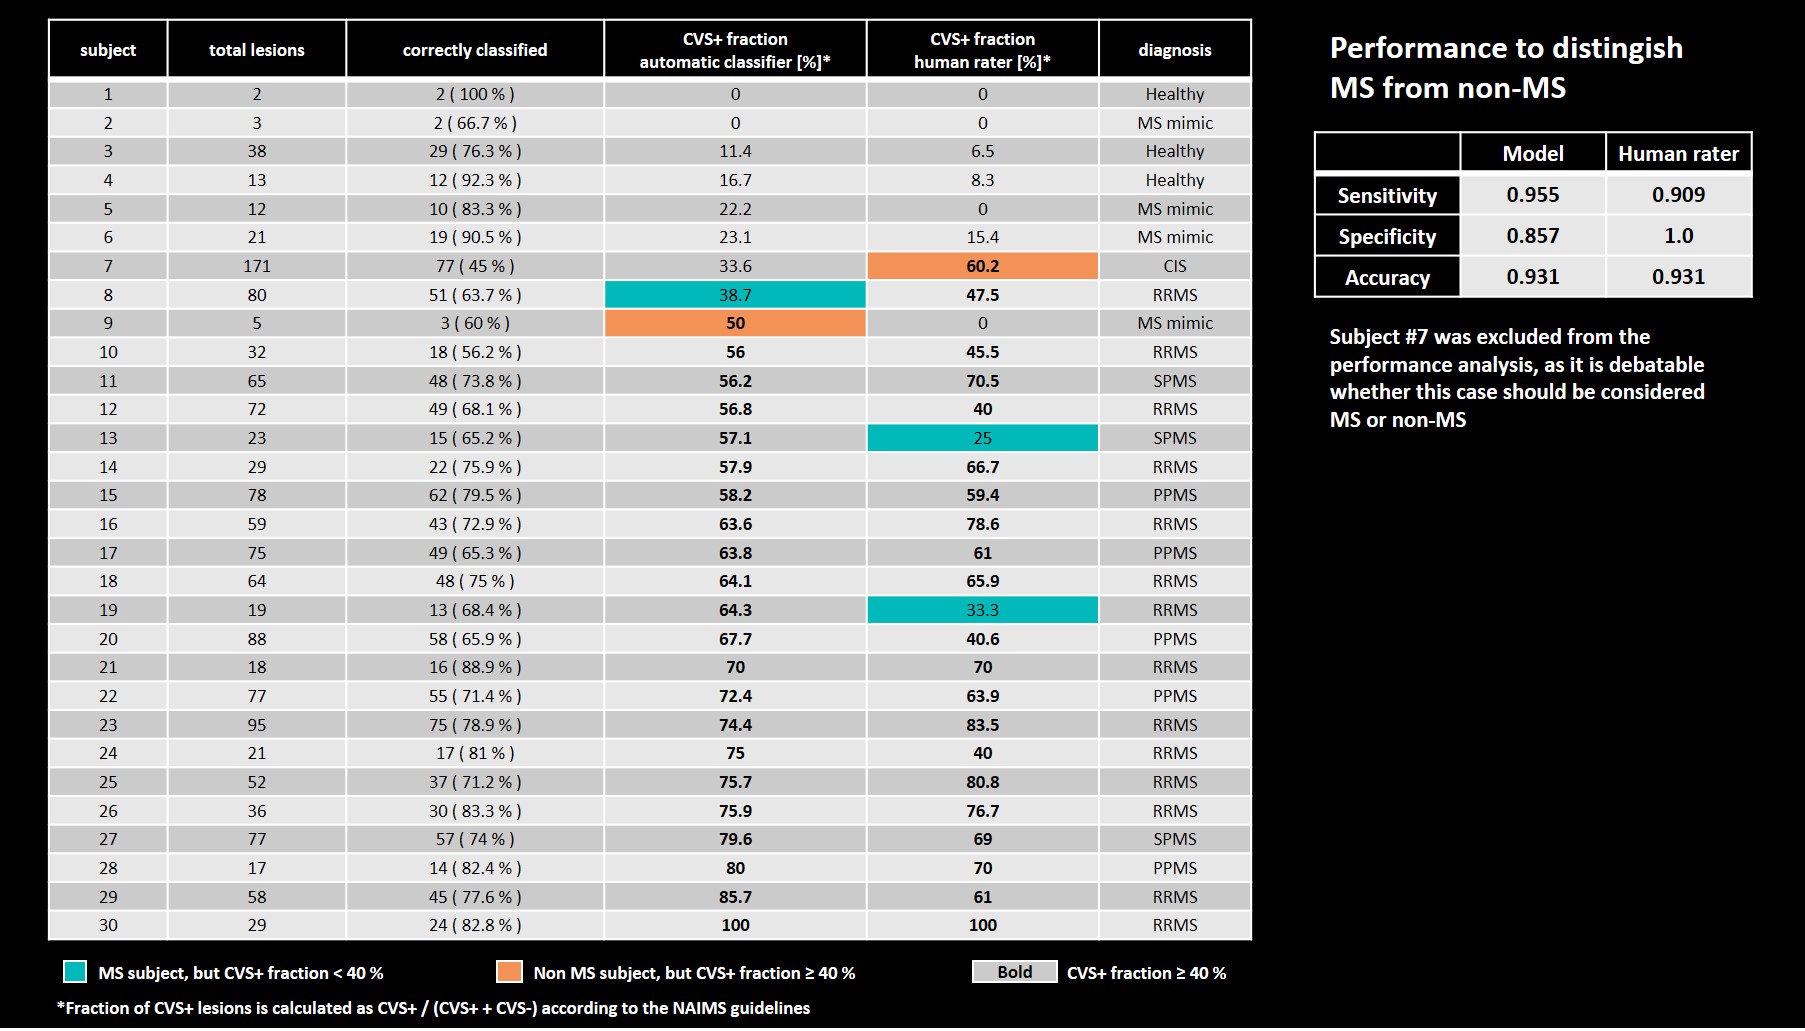
On a per-lesion level, the proposed architecture outperformed the classic CVSNet architecture in the pure testing set in overall accuracy as well as per-class accuracies (Table 1). Per-class accuracies were (multi-level-classifier, classic architecture): CVS+ — (76.1%, 74.2%); CVS− — (80.6%, 79.4%); CVSe — (83.3%, 75.4%). Overall accuracy was significantly better for the new model at 70.0% compared to 65.4% (p<0.001, McNemar/Bowker test on the confusion matrices, Table 1). Subject-wise performance (Table 2) was relatively similar across subjects, with the mean fraction of correctly classified lesions/subject being 74.5%±11.4%, range=45%–100%, despite a large variety in individual lesion load. Using a threshold of ≥40% CVS+ lesion fraction as criterion for MS14, the automated model correctly identified all but two test subjects as MS or non-MS respectively, compared to two misclassifications based on the human raters’ CVS assessment. The corresponding performance metrics to identify MS patients were (multi-level-classifier, human raters): sensitivity — (95.5%, 90.9%); specificity — (85.7%, 100.0%); accuracy — (93.1%, 93.1%) (Table 2).Discussion and Conclusions
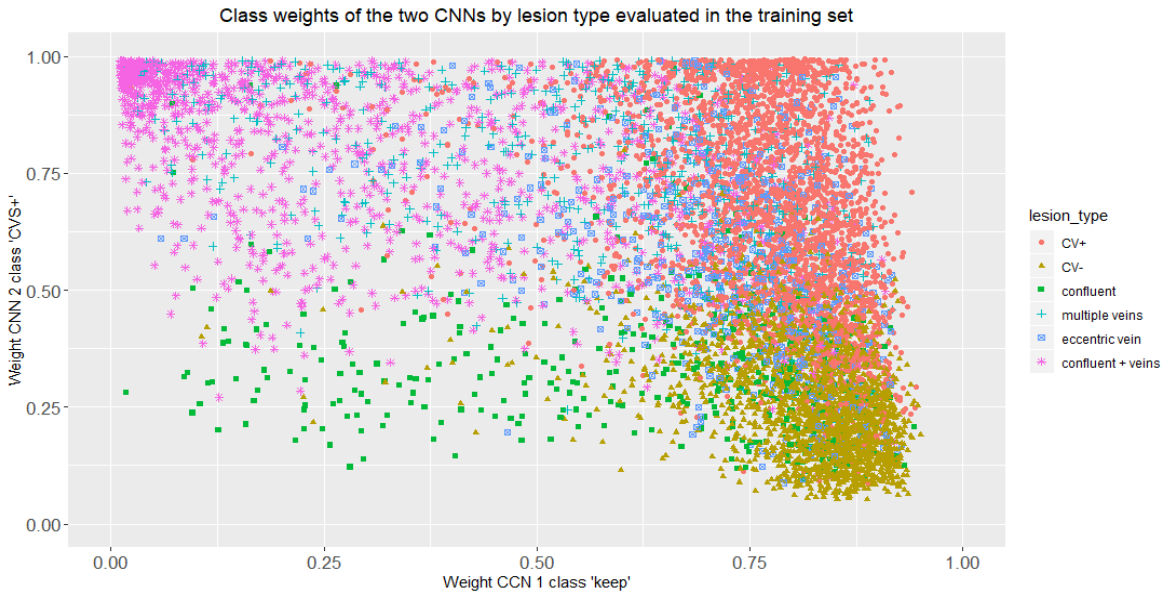
We introduced a novel multi-level classification architecture for automated CVS assessment. Unlike previous models, the task of classifying lesion types is separated into two sub-tasks of identifying CVSe lesions and distinguishing CVS+ and CVS-, followed by a third classification step that uses the results of the first two classifiers as input. This architecture provides superior performance on a per-lesion level and performs on par with human rater assessment on a per-subject level. These results suggest that separating the tasks of excluding lesions and assessment of CVS can improve automated CVS assessment. The distribution of the CNN output weights for the training samples with overlapping clusters shown in Figure 3, illustrates the motivation of using a second level classifier. Despite the more complex architecture, the proposed method can still be run within few seconds/case. With per-class accuracies of 76.1%–83.3%, the performance approaches levels of human inter-rater agreement estimated at 83%15, an important benchmark when considering an unsupervised application of the method. The similar subject-level performance for cases with few and many lesions underlines the robustness of the method. The high accuracy of the method in identifying MS case suggests that it could support MS diagnosisAcknowledgements
The authors gratefully acknowledge the contributions of Mário João Fartaria to this work.References
1. Solomon AJ, Bourdette DN, Cross AH, et al. The contemporary spectrum of multiple sclerosis misdiagnosis. Neurology 2016;87:1393–1399 doi: 10.1212/WNL.0000000000003152.
2. Wuerfel J, Sinnecker T, Ringelstein EB, et al. Lesion morphology at 7 Tesla MRI differentiates Susac syndrome from multiple sclerosis. Mult. Scler. J. 2012 doi: 10.1177/1352458512441270.
3. Solomon AJ, Schindler MK, Howard DB, et al. “Central vessel sign” on 3T FLAIR* MRI for the differentiation of multiple sclerosis from migraine. Ann. Clin. Transl. Neurol. 2016 doi: 10.1002/acn3.273.
4. Cortese R, Magnollay L, Tur C, et al. Value of the central vein sign at 3T to differentiate MS from seropositive NMOSD. Neurology 2018 doi: 10.1212/WNL.0000000000005256.
5. Maggi P, Absinta M, Grammatico M, et al. Central vein sign differentiates Multiple Sclerosis from central nervous system inflammatory vasculopathies. Ann. Neurol. 2018 doi: 10.1002/ana.25146.
6. Fartaria MJ. Cvsnet: A deep learning-based approach for automated detection of the central vein sign. Mult. Scler. J. 2019.
7. Maggi P, Fartaria MJ, Jorge J, et al. CVSnet: A machine learning approach for automated central vein sign assessment in multiple sclerosis. NMR Biomed. 2020 doi: 10.1002/nbm.4283.
8. Dworkin JD, Sati P, Solomon A, et al. Automated integration of multimodal MRI for the probabilistic detection of the central vein sign in white matter lesions. Am. J. Neuroradiol. 2018 doi: 10.3174/ajnr.A5765.
9. Sati P, Oh J, Todd Constable R, et al. The central vein sign and its clinical evaluation for the diagnosis of multiple sclerosis: A consensus statement from the North American Imaging in Multiple Sclerosis Cooperative. Nat. Rev. Neurol. 2016 doi: 10.1038/nrneurol.2016.166.
10. Levasseur VA, Xiang B, Salter A, Yablonskiy DA, Cross AH. Stronger Microstructural Damage Revealed in Multiple Sclerosis Lesions with Central Vein Sign by Quantitative Gradient Echo MRI. medRxiv 2021:2021.07.17.21260663 doi: 10.1101/2021.07.17.21260663.
11. Sati P, George IC, Shea CD, Gaitán MI, Reich DS. FLAIR*: A combined MR contrast technique for visualizing white matter lesions and parenchymal veins. Radiology 2012 doi: 10.1148/radiol.12120208.
12. Roy S, Butman JA, Reich DS, Calabresi PA, Pham DL. Multiple sclerosis lesion segmentation from brain MRI via fully convolutional neural networks. arXiv: 1803.09172 2018.
13. Roche A, Forbes F. Partial Volume Estimation in Brain MRI Revisited BT - Medical Image Computing and Computer-Assisted Intervention – MICCAI 2014: 17th International Conference, Boston, MA, USA, September 14-18, 2014, Proceedings, Part I. In: Golland P, Hata N, Barillot C, Hornegger J, Howe R, editors. Cham: Springer International Publishing; 2014. pp. 771–778. doi: 10.1007/978-3-319-10404-1_96.
14. Tallantyre EC, Dixon JE, Donaldson I, et al. Ultra-high-field imaging distinguishes MS lesions from asymptomatic white matter lesions. Neurology 2011 doi: 10.1212/WNL.0b013e31820b7630.
15. Unpublished data. Small internal study based on two raters and ten MS subjects with a total of 503 lesions (CVS+,CVS-,CVSe). Readers were blinded to the clinical characteristics when reviewing the lesions.
Figures