0198
In pursuit of the central vein sign in multiple sclerosis in the cervical spinal cord at 7T1Philips, Nashville, TN, United States, 2Radiology and Radiological Sciences, Vanderbilt University Medical Center, Nashville, TN, United States, 3Vanderbilt University Institute of Imaging Sciences, Nashville, TN, United States, 4Vanderbilt University School of Medicine, Nashville, TN, United States, 5Vanderbilt University Medical Center, Nashville, TN, United States
Synopsis
Central vein sign is believed to be a specific marker for the diagnosis of multiple sclerosis (MS) but has not yet been reported in the spine. This work used SWI in the cervical spinal cord of MS patients and healthy controls at 7T to look for evidence of central veins. SWI hypointensities were observed frequently around the cord periphery, between the white and grey matter within the cord, and along nerve roots. Hypointensities were also observed within spinal cord lesions, providing candidate evidence of central veins in lesions of the spinal cord.
Introduction
The central vein sign (CV) refers to the visualization of a vein within a white matter lesion and is increasingly believed to be a specific marker for the diagnosis of multiple sclerosis (MS)1. In the brain, CV is visualized using susceptibility weighted imaging (SWI) to generate a venous map, which is often overlaid on a FLAIR image. However, despite spinal cord involvement in the majority of MS patients2, CV has not been reported in the spinal cord1. Beyond the difficulty in imaging the spinal cord caused by its small size, physiological motion, and an inhomogeneous environment, it is also not obvious that CV will have the same appearance/presence in the spinal cord due to the spinal venous distribution and MS lesions that seem to ignore grey and white matter boundaries. As such, work is needed to investigate the appearance of SWI venous signals in the spinal cord of MS patients. This work examines SWI in the cervical spinal cord at 7T in patients with MS and healthy controls and evaluates the appearance of SWI signal hypointensities to better understand how CV might manifest in the cord.Methods
All scans were performed following informed consent and under approval of the local IRB. Data were acquired on a Philips 7T Achieva system using a Nova 16-channel spine array coil. Single-echo 2D gradient echo data were obtained in the cervical spine (centered on the C3 vertebral body) of 8 patients with relapsing-remitting MS (RRMS) and in 5 healthy controls. Acquisition parameters were as follows, FOV =150x150 mm2, Voxel size = 0.6x0.6x2.0 mm3, slices = 13-16, TR/TE = 400/14 ms, flip angle = 25, averages = 4, SENSE factor = 1.5, scan time = 6 minutes and 51 seconds.The spinal cord and canal were manually segmented on a slice-by-slice basis. SWI processing often makes use of homodyne filtering to remove background phase from the phase image, which can lead to signal voids from phase wraps in areas of rapidly changing susceptibility3. For this study, image phase data were instead unwrapped using FSL’s PRELUDE4,5. The unwrapped phase data were then loaded into GPI6 and high pass Gaussian filtered in the Fourier domain to remove the background phase. An SWI negative phase mask was then generated according to the conventionally used
$$ \begin{cases} \frac{\phi + \pi}{\pi}, & \phi \le 0 \\ 1, &\phi > 0 \end{cases} $$
For this study, the phase mask was raised to the power of 10 and then multiplied by the magnitude data to yield the final enhanced SWI image. Quantitative susceptibility mapping (QSM) data were also generated from the same single-echo gradient echo data. QSM processing was accomplished using the SEPIA package7 in Matlab using Laplacian phase unwrapping8, the Laplacian boundary value approach for background field removal9, and thresholded k-space division10 to calculate the QSM maps. Data from one patient were excluded due to severe motion artifacts.
Results
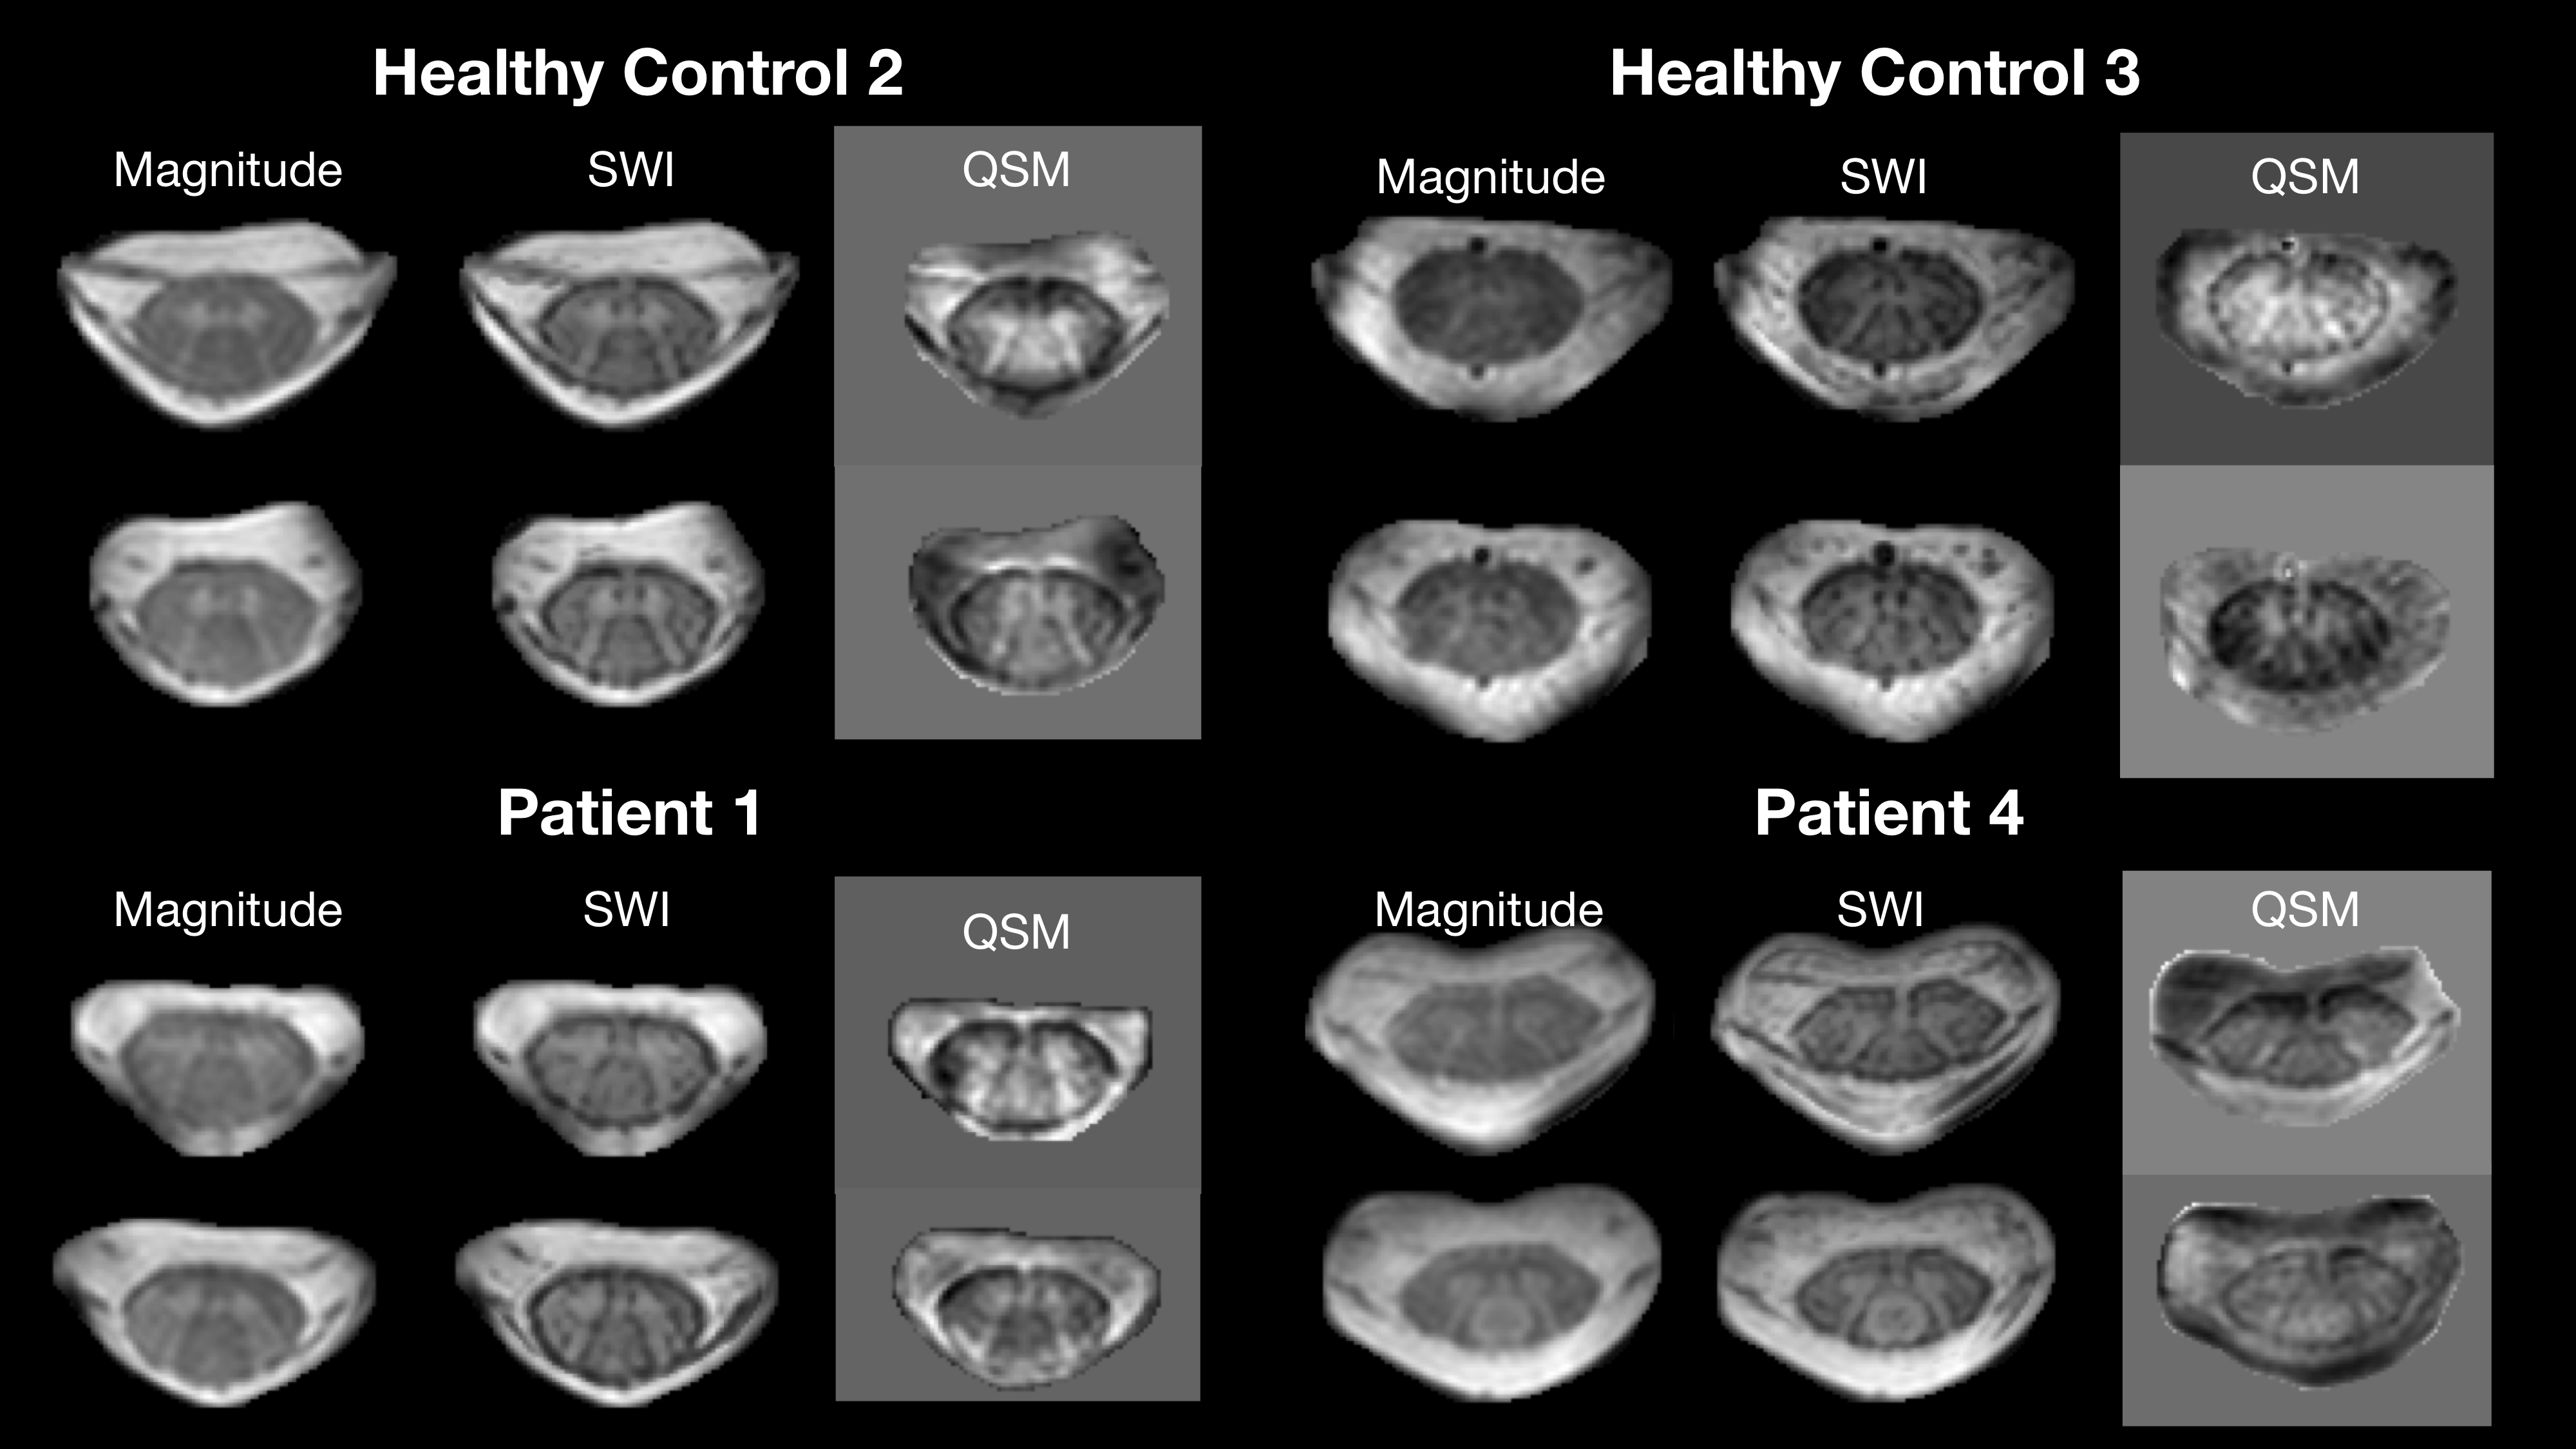
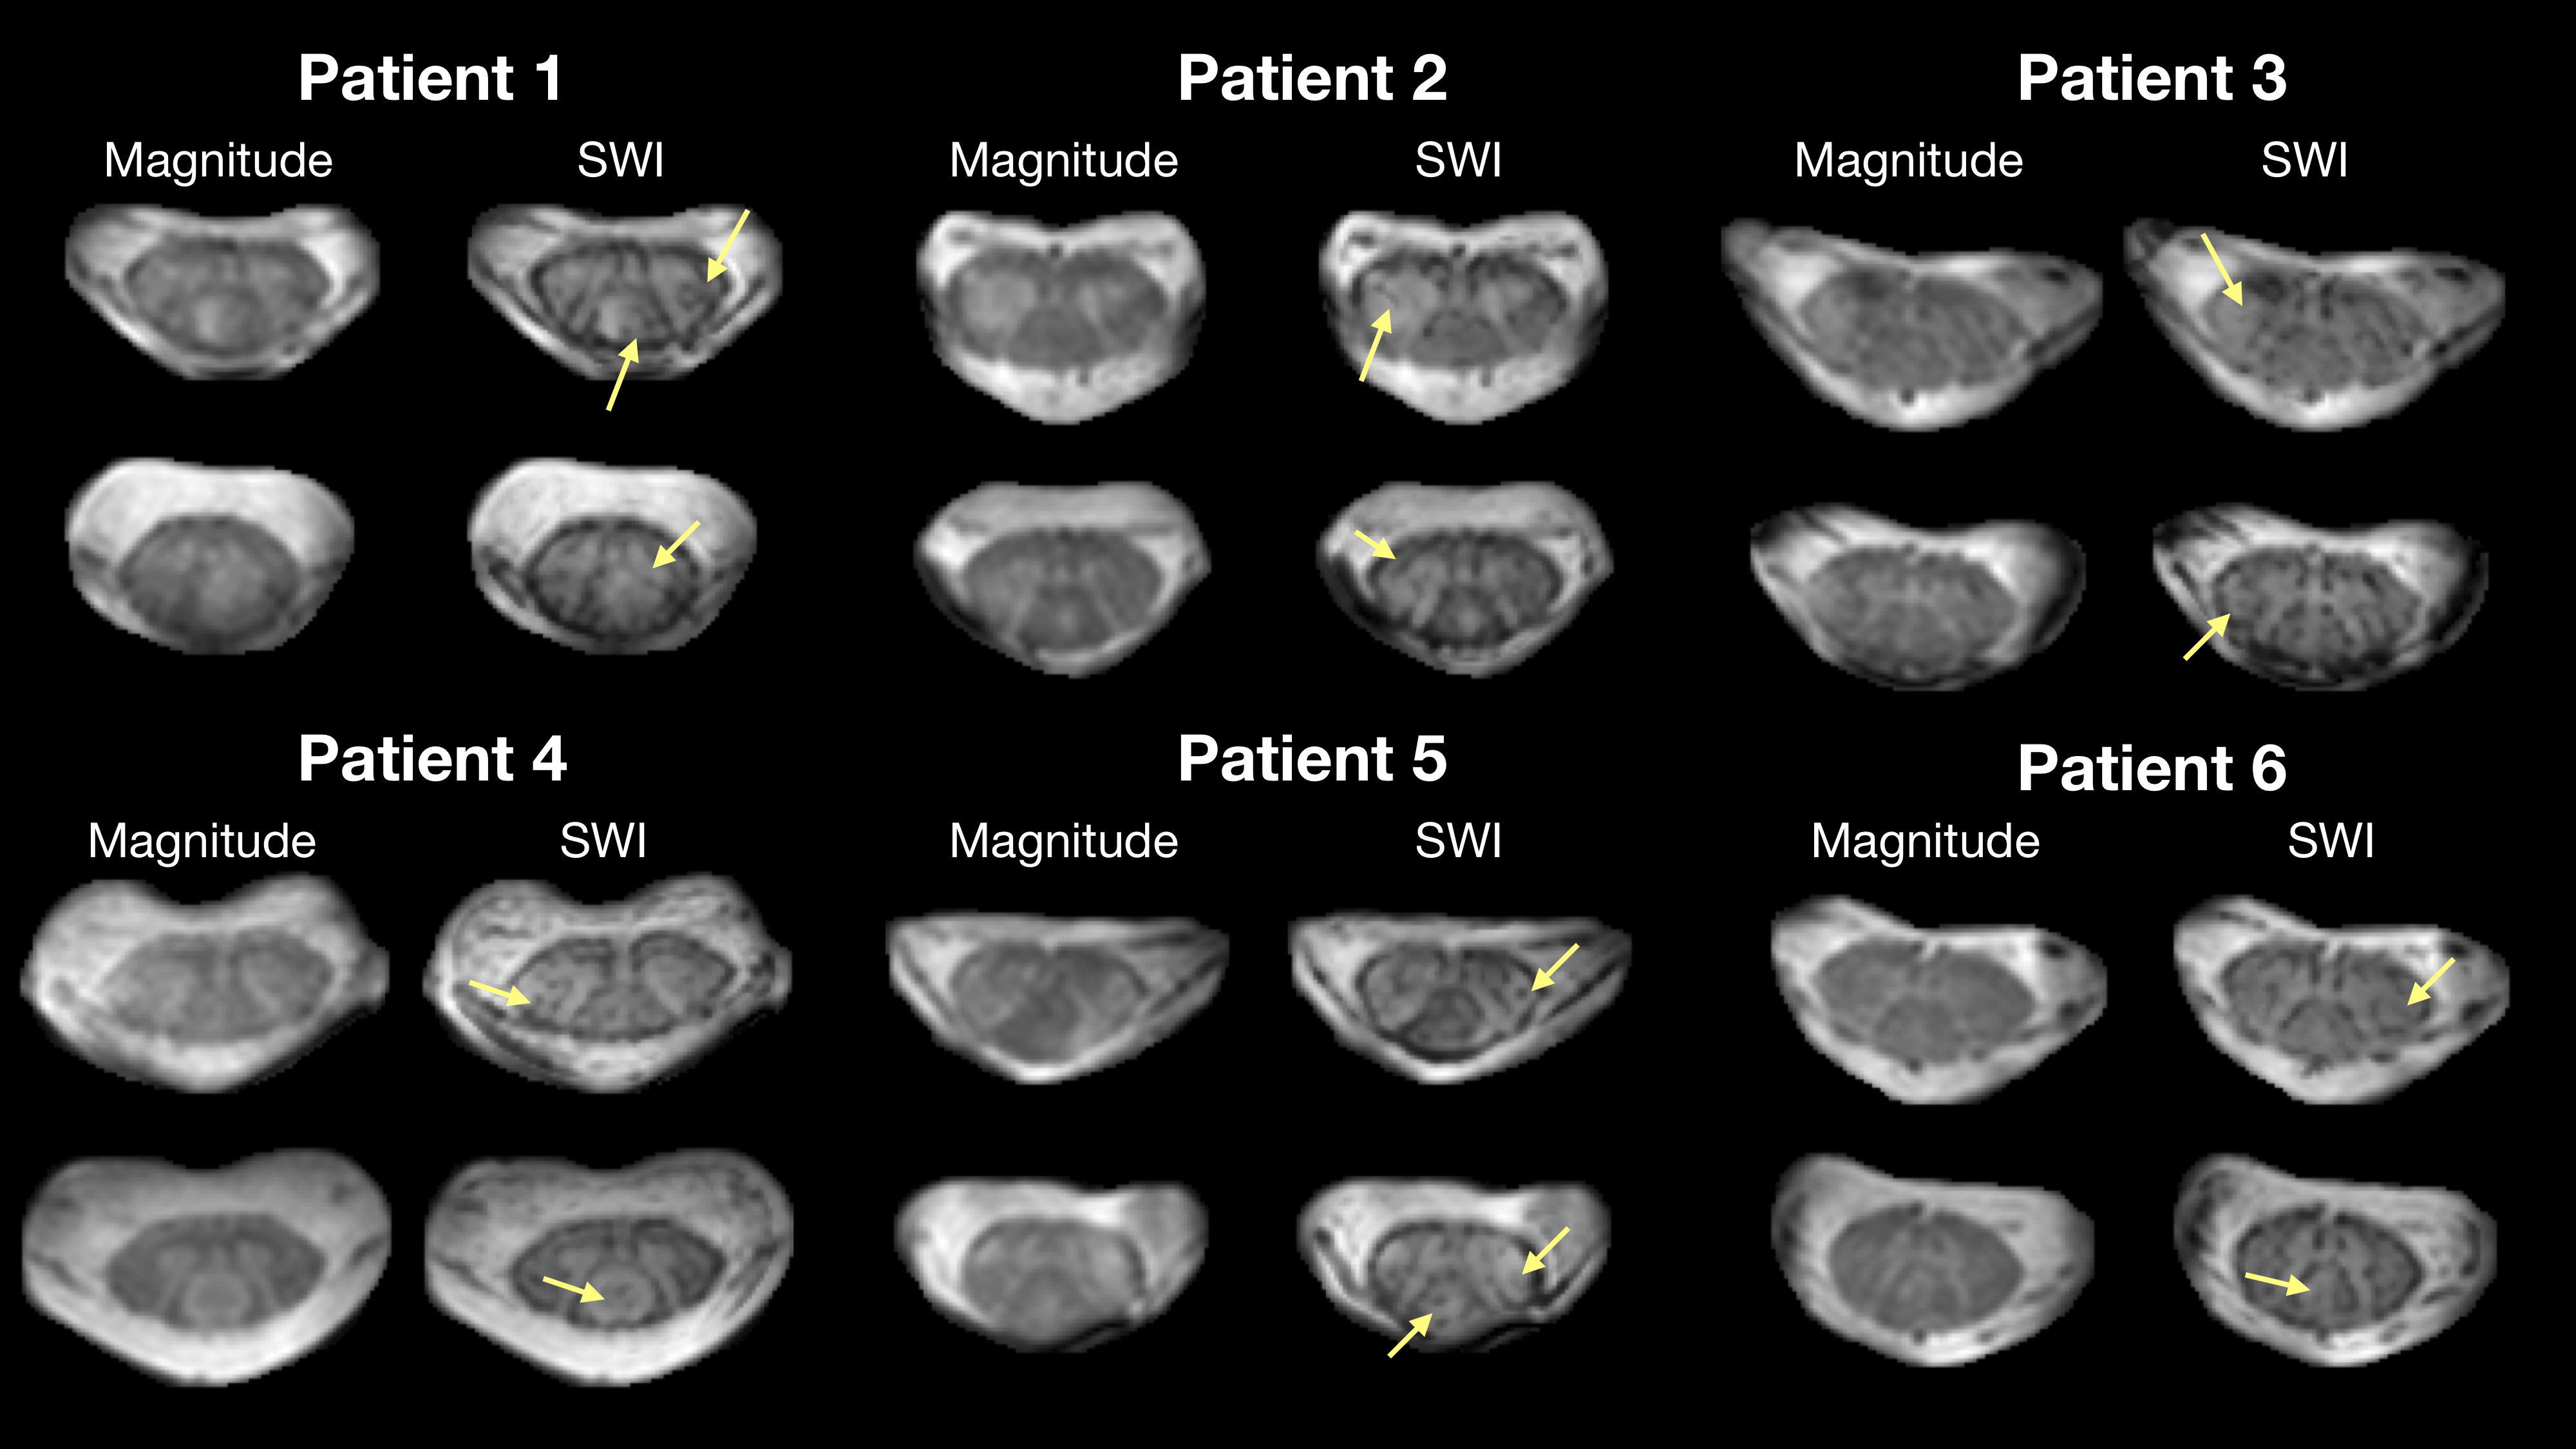
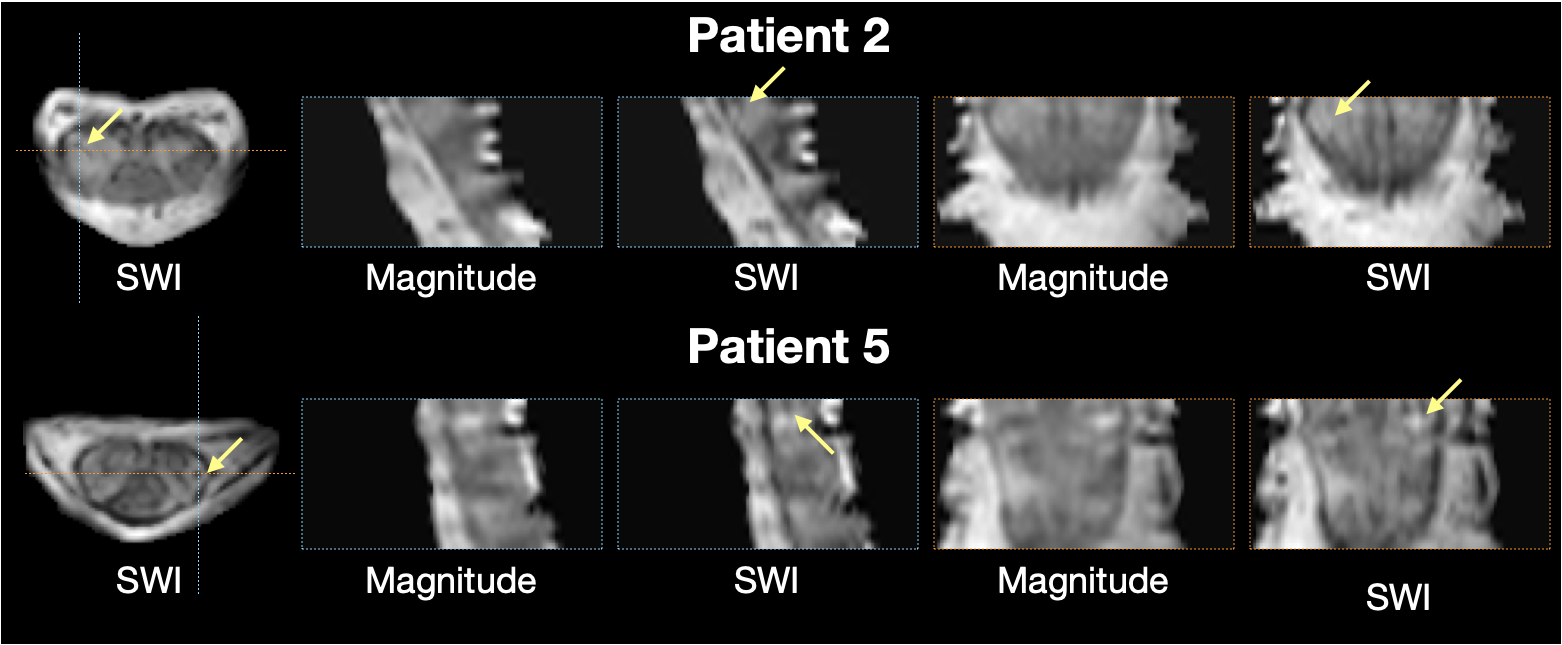
Observations from the SWI data in RRMS patients and healthy controls are summarized in figures 1-4. Figure 1 shows example magnitude, SWI, and QSM data for 2 healthy controls and 2 RRMS patients. Increased hypointensities in the SWI data appear to correspond with regions of negative susceptibility in the QSM maps. Hypointensities can be observed around the periphery of the cord, between white and grey matter structures in the cord, in the CSF along some nerve roots, and sporadically through the white matter and CSF. Figure 2 highlights specific slices from 6 RRMS patients where hypointensities are observed within apparent lesions, serving as candidate evidence of CV in spinal cord lesions. Figure 3 provides sagittal and coronal reformats through potential central veins in 2 of the RRMS patients. These images demonstrate that hypointensities continue through multiple slices. Figure 4 highlights the benefit of background phase removal approach used in this work. As shown, the homodyne filtering method occasionally resulted in signal voids within some image slices.Discussion
There are several challenges when interpreting spinal cord SWI data. First, the small scale of spinal cord structures requires very high resolution, limiting SNR and increasing scan time. Second, physiological motion can produce severe artifacts. Finally, there are multiple potential sources of negative phase accumulation in a gradient echo image including deoxyhemoglobin within venous structures, iron accumulation, and fiber orientation. Large hypointensities observed around the periphery of the cord correspond with known venous structures. Hypointensities between the grey and white matter and along the nerve roots are likely related to both venous structures and changes in fiber orientation. Hypointensities within spinal cord lesions could be venous in nature. They might also be structural, related to iron accumulation, or even the result of image noise. As shown in the sagittal and coronal reformats of data from 2 RRMS patients, it is possible to trace hypointensities through multiple slices, suggesting a venous origin in at least these specific cases.Conclusion
SWI at 7T has the potential to aid our understanding of the mechanisms, development, and progression of MS spinal cord lesions. With improved image quality and analysis, spinal cord SWI might provide an additional criterion in MS diagnosis. Additional work is needed to validate these observations and improve confidence in the results.Acknowledgements
The authors would like to acknowledge funding from the following sources: R01 NS 117816-01A1, R01 NS109114-04, and K01EB030039.
References
1. Sati P, Oh J, Constable R et al. The central vein sign and its clinical evaluation for the diagnosis of multiple sclerosis: a consensus statement from the North American Imaging in Multiple Sclerosis Cooperative. Nat Rev Neurol. 2016; 12:714-722.
2. Dula AN, Pawate S, Dortch RD et al. Magnetic resonance imaging of the cervical spinal cord in multiple sclerosis at 7T. Multiple Sclerosis Journal. 2016; 22(3):320-328.
3. Li N, Wang W, Sati P et al. Quantitative assessment of susceptibility weighted imaging processing methods. J Magn Reson Imaging. 2014; 40(6):1463-1473.
4. Jenkinson M, Beckmann CF, Behrens TE et al. FSL. Neuroimage. 2012; 62(2): 782-790.
5. Jenkinson M. Fast, automated, N-dimensional phase unwrapping algorithm. Magn Reson Med. 2003; 49:193-197.
6. Zwart NR, Pipe JG. Graphical programming interface: a development environment for MRI methods. Magn Reson Med 2015; 74:1449-1460.
7. Chan K-S, Marques JP. SEPIA-susceptibility mapping pipeline tool for phase images. Neuroimage. 2021; doi: 10.1016/j.neuroimage.2020.117611.
8. Li W, Wu B, Liu C. Quantitative susceptibility mapping of human brain reflects spatial variation in tissue composition. Neuroimage. 2011; 55:1645-1656.
9. Zhou D, Liu T, Spincemaille P, Wang Y. Background field removal by solving the Laplacian boundary value problem. NMR Biomed. 2014; 27:312-319.
10. Wharton S, Shafer A, Bowtell R. Susceptibility mapping in the human brain using threshold-based k-space division. Magn Reson Med. 2010; 63:1292-1304.
Figures