0197
Diffusely abnormal white matter microstructural changes are similar across the clinical phenotypes of multiple sclerosis1University of British Columbia, Vancouver, BC, Canada, 2International Collaboration on Repair Discoveries, Vancouver, BC, Canada, 3MSMRI Research Group, Vancouver, BC, Canada
Synopsis
Diffusely abnormal white matter (DAWM) is commonly found on conventional brain MRI in all stages of multiple sclerosis (MS). Blood markers associated with prior or ongoing myelin and axonal damage were not found to be elevated in people with DAWM relative to people without DAWM. Within areas of DAWM, no differences between MS phenotypes were found possibly suggesting that the tissue abnormalities within DAWM are similar across the clinical course, from early to late stages of MS.
Introduction
Diffusely abnormal white matter (DAWM) is a common, yet understudied, entity found on brain MRI in people with multiple sclerosis (MS). DAWM is defined as diffuse areas of white matter with mildly increased proton density (PD) and T2-weighted signal, similar to grey matter and less hyperintense than focal lesions, with post-mortem histology showing myelin changes, axonal loss and blood-brain barrier breakdown1-5. DAWM is visible in all phenotypes of MS, but it is unknown if the underlying damage varies across the spectrum of disease.MRI biomarkers may give more information about DAWM tissue pathology. Myelin water fraction (MWF6) reflects the fraction of water within myelin bilayers and has been histologically validated as a marker for myelin7. T1 relaxation is closely related to water content8 and geometric mean T2 (GMT2) relaxation is related to water mobility and tissue structure. Diffusion basis spectrum imaging (DBSI) models myelinated and demyelinated axons as anisotropic diffusion tensors, and cells/extracellular space as isotropic diffusion tensors9. DBSI-derived metrics include axial diffusivity (AD, related to axonal integrity), radial diffusivity (RD, modulated by myelin10) and fibre fraction (FF, axon density11).
Blood biomarkers in MS are gaining recognition because of their relative ease in sample collection, and newer techniques that allow for more sensitive quantification of molecules. A prime example is neurofilament light chain (NfL), a non-specific fluid biomarker of axonal injury12. Since DAWM is associated with myelin and axon abnormalities, levels of axonal neurofilaments and myelin components including gangliosides, phospholipids and cholesterol may be elevated in people with DAWM.
Both MRI and fluid biomarkers can be used to examine tissue damage in people with MS. Studies including participants with broad demographic characteristics have the potential to provide insight into pathological changes associated with DAWM from early to late-stage MS, information which is currently lacking in the literature.
Objective
To characterise MRI and blood marker differences between people with and without DAWM across the spectrum of MS.Methods
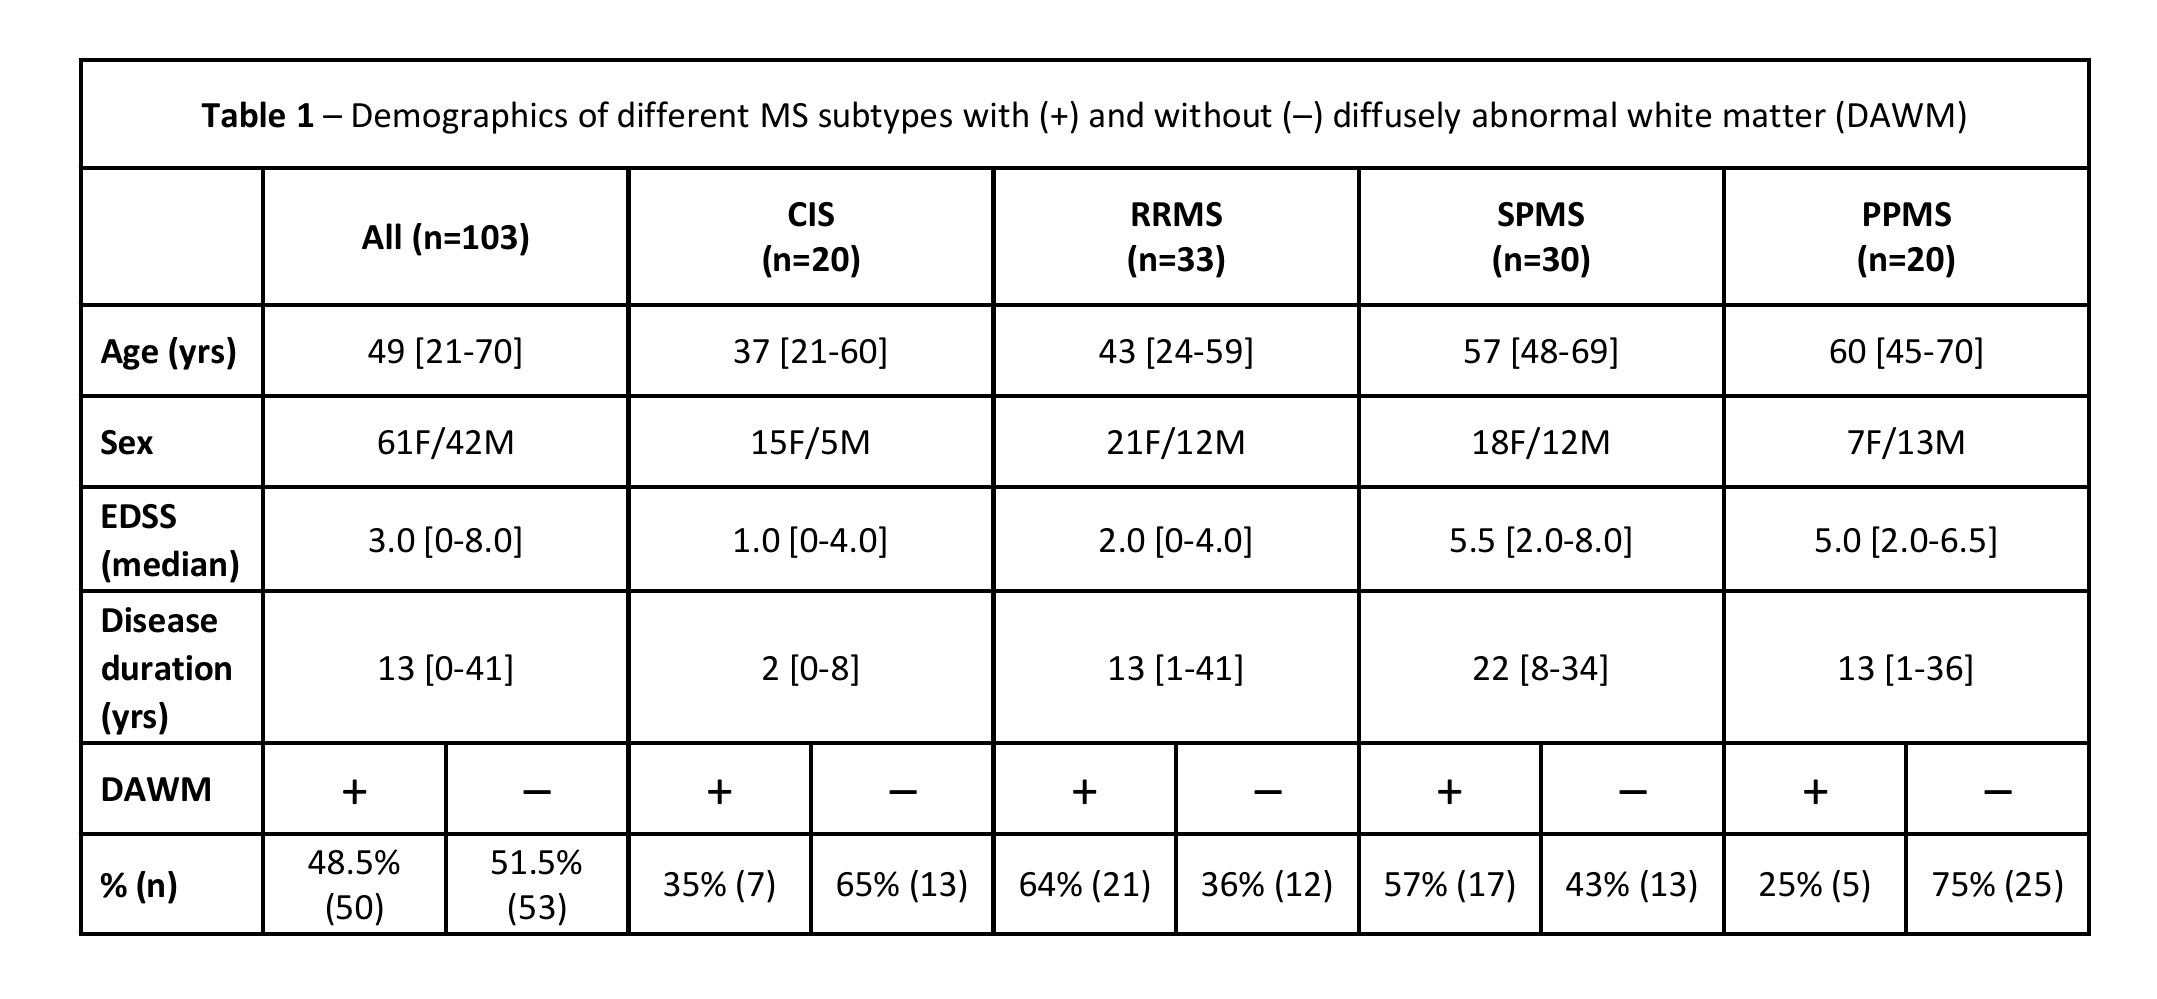
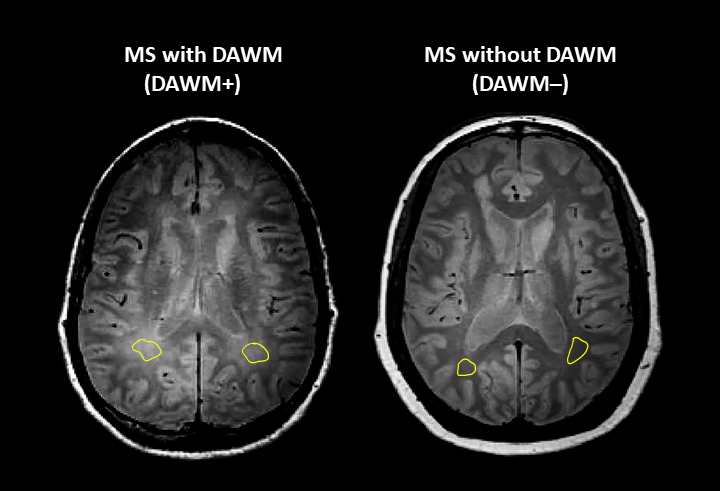
Subjects and MR Experiments: 103 MS participants were scanned at 3T (Philips Achieva) (demographics in Figure 1). Scanning sequences included 48-echo GRASE T2 relaxation (TR/TE=1073/8ms, 1x1x2.5mm3, slices=40)13, inversion recovery T1 (TIs=150,400,750,1200,2100ms, TR=3000ms, 1x1x2.5mm3, slices=40), DBSI (99 directions, b values=0-1500, TR/TE=4798/79ms, 2x2x2mm3, slices=40)11, PD/T2-weighted (TR/TE1/TE2=2900/8.42/80ms, 1x1x3mm3), and 3DT1-MPRAGE (TR/TE/TI=3000/3.5/926ms, 1x1x1mm3). Serum and plasma was isolated from blood collected the day of MRI and stored at -70°C until analysis.Data Analysis: Voxel-wise T2 distributions were calculated using non-negative least squares14,15. MWF was the fraction of signal with T2<40ms and GMT2 of intra/extracellular water was 40<T2<200ms. T1 was fit to a single exponential. DBSI data was analysed to calculate FF, AD and RD maps11. MRI metric maps were registered to 3DT1 images using FLIRT (FSL toolbox)16. Normal-appearing white matter (NAWM) masks were created using FAST17 on the 3DT1. Lesions were automatically segmented using seed points18. Participants with DAWM (DAWM+) and without DAWM (DAWM–) were identified by two experienced MRI researchers working independently. DAWM and similarly located NAWM areas in the DAWM– subjects were delineated (Figure 2). Masks were overlaid onto registered MRI metric maps to obtain mean measurements.
Serum NfL was quantified by single molecule array technology (SIMOA, Quanterix). Enzyme-linked immunosorbent assay measured: serum anti-phospholipid antibodies (IgM and IgG) levels to β2-Glycoprotein I, Cardiolipin, Phosphatidyl-choline, -ethanolamine, -inositol, -serine, and Sphingomyelin, anti-ganglioside antibodies (IgM/IgG) to gangliosides (GA1, GM1, GM2, GD1a, GD1b, GQ1b), serum phosphorylated neurofilament heavy chain, cholesterol and high-density lipoprotein.
Statistics: Unpaired t-tests (p<0.01) compared DAWM– and DAWM+ MRI and blood measures. ANOVA compared MR measures between MS phenotypes within DAWM+ participants.
Results
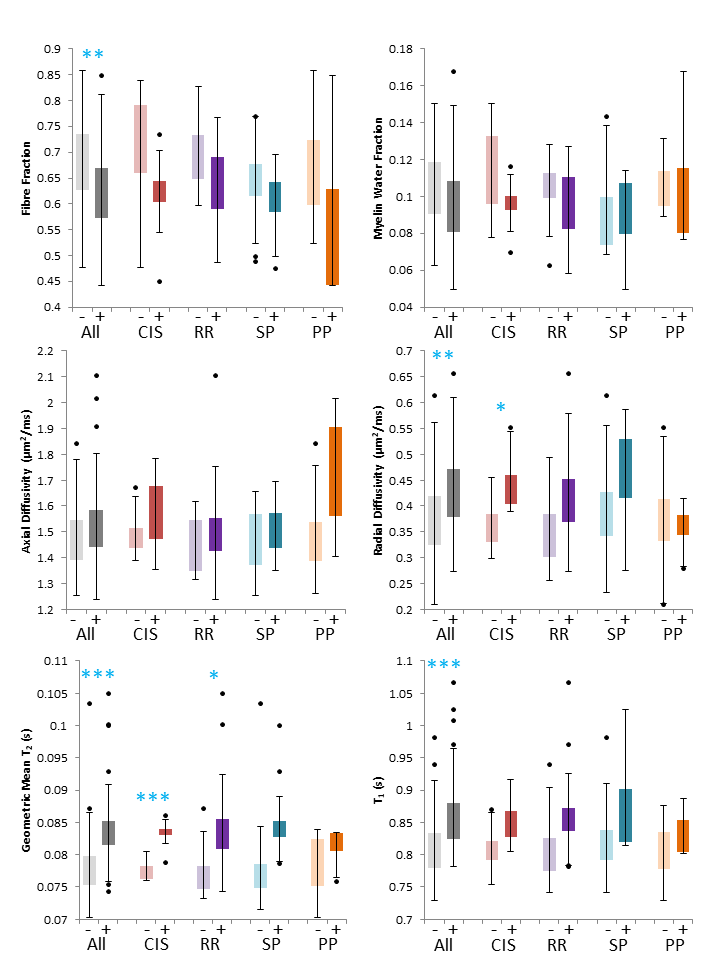
No differences in blood markers were found except for NfL in CIS (DAWM–=6.4 vs DAWM+=12.0pg/mL; p=0.0035). Comparing DAWM and NAWM ROIs across the entire cohort, FF, RD, GMT2 and T1 were significantly different (Figure 3). Means from global NAWM and lesion masks between DAWM+ and DAWM– were not significantly different. When separated by phenotype, DAWM in CIS showed increased RD and GMT2 and DAWM in RRMS showed increased GMT2 (Figure 3). No significant differences in MR measures were detected within DAWM ROIs across phenotypes (Figure 3).Discussion
DAWM is an MRI finding that is associated with decreased axonal density (smaller FF), decreased myelin content (higher RD) and increased water content (higher GMT2 and T1) compared to similar areas of NAWM. These differences were most apparent in the earlier stages of MS such as CIS and RRMS. However, when comparing DAWM metrics between phenotypes, there were no differences. Blood markers showed similar concentrations in DAWM+ vs DAWM– participants except for elevated NfL levels in CIS with DAWM, which has been previously reported19.Conclusion
DAWM is present from the earliest clinical presentations of MS, including CIS. Blood markers associated with myelin and axonal damage are not different between people with and without DAWM. Within areas of DAWM, no differences with advanced MRI measures between phenotypes were found possibly suggesting that the tissue abnormalities within DAWM are similar from early to late stages of MS. Due to this inherent stability, using DAWM as an imaging target for remyelination studies could be considered.Acknowledgements
We would like to thank the MS volunteers and the staff at the UBC MRI Research Centre and UBC MS Clinic. This study was funded by the Multiple Sclerosis Society of Canada and by the VGH and UBC Hospital Foundation. This work was conducted on the traditional, ancestral, and unceded territories of Coast Salish Peoples, including the territories of the xwməθkwəy̓əm (Musqueam), Skwxwú7mesh (Squamish), Stó:lō and Səl̓ílwətaʔ/Selilwitulh (Tsleil- Waututh) Nations.References
1. Laule C, Pavlova V, Leung E, Zhao G, MacKay AL, Kozlowski P, Traboulsee AL, Li DK, Moore GR. Diffusely abnormal white matter in multiple sclerosis: further histologic studies provide evidence for a primary lipid abnormality with neurodegeneration. J Neuropathol Exp Neurol. 2013; 72: 42-52.
2. Moore GR, Laule C, Mackay A, Leung E, Li DK, Zhao G, Traboulsee AL, Paty DW. Dirty-appearing white matter in multiple sclerosis: preliminary observations of myelin phospholipid and axonal loss. J Neurol. 2008; 255: 1802-11.
3. Vos CM, Geurts JJ, Montagne L, van Haastert ES, Bö L, van der Valk P, Barkhof F, de Vries HE. Blood-brain barrier alterations in both focal and diffuse abnormalities on postmortem MRI in multiple sclerosis. Neurobiol Dis. 2005; 20: 953-60.
4. Vertinsky AT, Li DKB, Vavasour IM, Miropolsky V, Zhao G, Zhao Y, Riddehough A, Moore GRW, Traboulsee A, Laule C. Diffusely Abnormal White Matter, T2 Burden of Disease, and Brain Volume in Relapsing-Remitting Multiple Sclerosis. J Neuroimaging. 2019; 29: 151-159.
5. Vrenken H, Seewann A, Knol DL, Polman CH, Barkhof F, Geurts JJ. Diffusely abnormal white matter in progressive multiple sclerosis: in vivo quantitative MR imaging characterization and comparison between disease types. AJNR Am J Neuroradiol. 2010; 31: 541-8.
6. MacKay A, Whittall K, Adler J, et al. In vivo visualization of myelin water in brain by magnetic resonance. Magn Reson Med. 1994; 31(6): 673-677.
7. Laule C, Kozlowski P, Leung E, et al. Myelin water imaging of multiple sclerosis at 7 T: correlations with histopathology. Neuroimage. 2008; 40(4): 1575-1580.
8. Fatouros PP, Marmarou A, Kraft KA, et al. In Vivo Brain Water Determination by T1 Measurements: Effect of Total Water Content, Hydration Fraction, and Field Strength. Magn Reson Med. 1991; 17(2): 402-413.
9. Wang Y, Wang Q, Haldar JP, et al. Quantification of increased cellularity during inflammatory demyelination. Brain. 2011; 134: 3590–3601.
10. Song SK, Sun SW, Ju WK, et al. Diffusion tensor imaging detects and differentiates axon and myelin degeneration in mouse optic nerve after retinal ischemia. Neuroimage. 2003; 20: 1714–22.
11. Wang Y, Sun P, Wang Q, et al. Differentiation and quantification of inflammation, demyelination and axon injury or loss in multiple sclerosis. Brain. 2015; 138: 1223–1238.
12. Kuhle J, Kropshofer H, Haering DA, et al. Blood neurofilament light chain as a biomarker of MS disease activity and treatment response. Neurology. 2019; 92: e1007-e1015.
13. Zhang J, Vavasour I, Kolind S, et al. Advanced Myelin Water Imaging Techniques for Rapid Data Acquisition and Long T2 Component Measurements. ISMRM. 2015; p824.
14. Prasloski T, Mädler B, Xiang Q-S, et al. Applications of stimulated echo correction to multicomponent T2 analysis. Magn Reson Med. 2012; 67: 1803–1814.
15. Whittall KP and MacKay AL. Quantitative interpretation of NMR relaxation data. J Magn Reson. 1989; 84: 134–152.
16. Jenkinson M, Bannister PR, Brady JM, and Smith SM. Improved optimisation for the robust and accurate linear registration and motion correction of brain images. NeuroImage. 2002; 17(2):825-841.
17. Zhang Y, Brady M, Smith S. Segmentation of brain MR images through a hidden Markov random field model and the expectation-maximization algorithm. IEEE Trans Med Imag. 2001; 20(1):45-57, 2001.
18. McAusland J, Tam RC, Wong E, et al. Optimizing the Use of Radiologist Seed Points for Improved Multiple Sclerosis Lesion Segmentation. IEEE TransBiomed Eng. 2010;57:2689–2698.
19. Vavasour IM, Becquart P, Gill J, et al. Diffusely abnormal white matter in clinically isolated syndrome is associated with parenchymal loss and elevated neurofilament levels (abstract). Mult Scler 2021;27:P454.
Figures