0181
Multi-echo Complex QSM+qBOLD (mcQQ) for Oxygen Extraction Fraction (OEF) mapping1Radiology, Weill Cornell Medicine, New York, NY, United States, 2Biomedical Engineering, Cornell University, Ithaca, NY, United States
Synopsis
Quantitative mapping of oxygen extraction fraction (OEF) is critical to evaluate brain tissue viability and function in neurologic disorders. An integrated model of QSM and qBOLD (QSM+qBOLD or QQ) has been developed to map OEF from a routine gradient echo MRI without the need for vascular challenges, and QQ inversion can be obtained using deep learning. This study proposes a multi-echo complex QQ (mcQQ) that improves fidelity to data noise characteristics using complex domain. The proposed mcQQ provided more accurate OEF in simulation and an improved sensitivity to OEF abnormalities in ischemic stroke patients, compared to the current QQ method.
Introduction
Quantitative mapping of oxygen extraction fraction (OEF) is critical to evaluate brain tissue viability and function in stroke1-3. An integrated model of quantitative susceptibility mapping and quantitative blood oxygen level dependent magnitude (QSM+qBOLD or QQ) has been developed to consider the OEF effect on both magnitude and phase of a widely available multi-echo gradient echo (mGRE) data4-8, and validated against calibrated fMRI4 and 15O-PET7. With removing clinically impractical vascular challenges, its clinical feasibility has already been shown in ischemic stroke9, 10, multiple sclerosis11, and brain cancer12. Recently, deep learning allowed to further improve the robustness of QQ against noise and the reconstruction speed13. The current QQ optimization assumes Gaussian noise for both QSM and mGRE magnitude5, 6, 8, 13, which may not be valid especially in low SNR regions, e.g., stroke lesions, due to QSM estimation by multi nonlinear steps from mGRE phase signal with non-Gaussian noise14-16 and Rician noise in mGRE magnitude17. We formulated a novel QQ using the assumption of Gaussian noise in multi-echo complex mGRE data with a deep learning solver (mcQQ-NET) and compared it with the current deep learning based QQ (QQ-NET)13 in simulation and ischemic stroke patients.Theory and Methods
Multi-echo complex QQ (mcQQ)The mcQQ model combines the QSM-based and qBOLD based OEF mapping methods using a nonlinear complex formulation to estimate OEF$$$=1-Y/Y_{a}$$$ with venous oxygenation ($$$Y$$$) and arterial oxygenation ($$$Y_{a}$$$= 0.98)8. $$Y^{*},v^{*},R_{2}^{*},S_{0}^*,\chi_{n}^{*}=\begin{array}{c}argmin\\Y,v,R_{2},S_0,\chi_{nb}\end{array}\left\{ \begin{array}{c}\begin{array}{c}||S_{j}-F_{qBOLD}\left(S_{0,},Y,v,R_{2,}\chi_{n},t_{j}\right)e^{i\omega_{0}t_{j}d*F_{QSM}\left(Y,v,R_{2,}\chi_{n}\right)}||_{2}^{2}+R\end{array}\end{array}\right\}$$ Here, $$$S_{j}$$$ is the complex signal at the j’th echo with removal of the initial phase and background phase18, 19, $$$\omega_{0}$$$ Larmor frequency, $$$d$$$ the dipole kernel, $$$*$$$ the convolution operator. For robust parameter determination, we imposed total variation on $$$Y$$$($$$R$$$). The QSM-based model separates voxel-wise susceptibility into the contribution of deoxy-hemoglobin in venous blood, i.e., OEF effect, and non-blood neural tissue susceptibility ($$$\chi_{n}$$$). $$F_{QSM}(Y,v,\chi_{n})=\left[\frac{\chi_{ba}}{\alpha}+\psi_{Hb}\cdot\Delta\chi_{Hb}\cdot\left(-Y+\frac{1-\left(1-\alpha\right)\cdot Y_{a}}{\alpha}\right)\right]\cdot v + \left(1-\frac{v}{\alpha}\right)\cdot \chi_{n}$$ where $$$\chi_{ba}=-0.108 ppb$$$ the fully oxygenated blood susceptibility assuming tissue hematocrit $$$Hct =0.357$$$20, $$$\alpha=0.77$$$ the ratio between the venous blood volume ($$$v$$$) and total blood volume21, $$$\psi_{Hb}=0.0909$$$ the hemoglobin volume fraction with $$$Hct=0.357$$$22-25, $$$\Delta\chi_{Hb}=12522 ppb$$$ the susceptibility difference between deoxy- and oxyhemoglobin26, 27. The qBOLD model describes the OEF effect on the mGRE magnitude8: $$F_{qBOLD}\left(S_{0,},Y,v,R_{2,}\chi_{n},t_{j}\right)=S_0\cdot e^{-R_2\cdot t_{j}}\cdot F_{BOLD}\left(Y,v,\chi_{n},t_{j}\right)\cdot G(t_{j})$$ where $$$S_{0}$$$ is signal intensity at $$$t=0$$$, $$$R_{2}$$$ is the transverse relaxation rate, $$$F_{BOLD}\left(Y,v,\chi_{n},t\right)=exp\left(-v\cdot f_{s}\left(\delta\omega\cdot t\right)\right)$$$28 where $$$f_s$$$ is the signal decay by the presence of the blood vessel network29 and $$$\delta\omega$$$ is the characteristic frequency due to the susceptibility difference between deoxygenated blood and the surrounding tissue8: $$$\delta \omega\left(Y,\chi_{n}\right)=\frac{1}{3}\cdot \gamma \cdot B_{0}\cdot \left[Hct\cdot \Delta \chi_{0}\cdot \left(1-Y\right) + \chi_{ba}-\chi_{n}\right]$$$ with $$$\gamma =267.51 rad s^{-1}T^{-1}$$$ the gyromagnetic ratio, and $$$B_{0}$$$ the main magnetic field strength. $$$G(t_{j})$$$ is the macroscopic field inhomogeneity contribution to mGRE signal decay8.
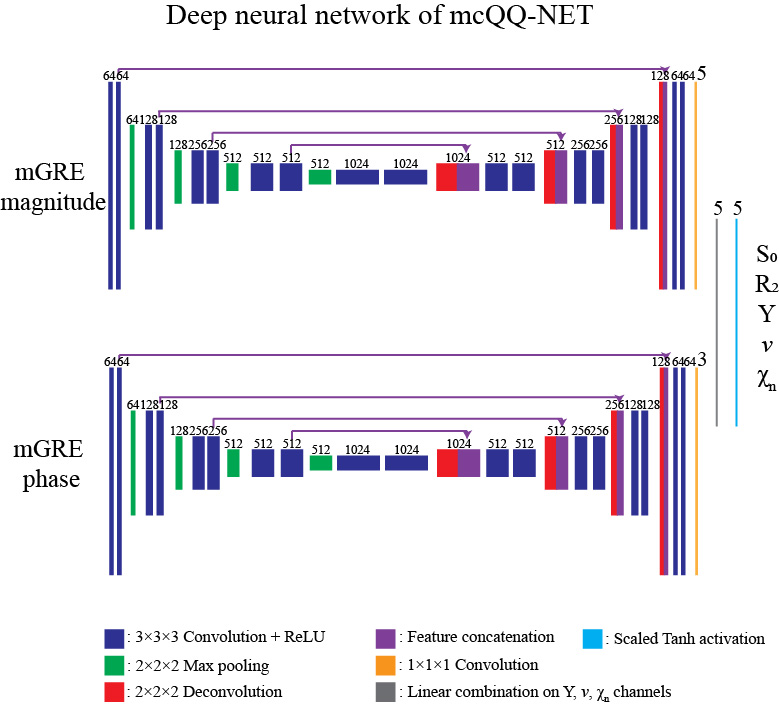
mcQQ is solved using a deep neural network, mcQQ-NET, consisting of 2 fully 4D (3D with multiple channels corresponding to the model parameters) convolutional subnetworks based on U-net30, 31, each for mGRE phase and magnitude input, respectively (Figure 1). mcQQ-NET was trained with simulated data based on the QQ solution5 as ground truth after adding gaussian noise to the simulated complex mGRE. The loss function was weighted sum of 1) L1 difference between the truth and output of mcQQ, 2) model loss (Eq. 1), and 3) L1 difference of Y spatial gradient. mcQQ-NET was implemented using Pytorch 1.4.032 with performing optimization by ADAM33, and training was stopped at 240 epochs as the validation loss became stable.
Validation
mcQQ was compared with the prior QQ solved using deep neural network13 in 1) simulated stroke brains (Figure 2) and 2) 30 real ischemic stroke patients in which 3D mGRE (0.47x0.47x2.0 mm3 voxel size, TE1/ΔTE/TE8 = 4.5/5/39.5 ms, TR= 42.8 ms) and DWI (0.94x0.94x3.2 mm3 voxel size, 0, 1000 s/mm2 b-values) was acquired. The stroke patients were classified into 2 groups based on the time interval between stroke onset and MRI scan34: acute (6-24 hours, N=5) and subacute (1-14 days, N=25) phase (Figures 3 and 4). Five-fold cross-validation was performed in all experiments to ensure no overlap between training and test data13.
Results
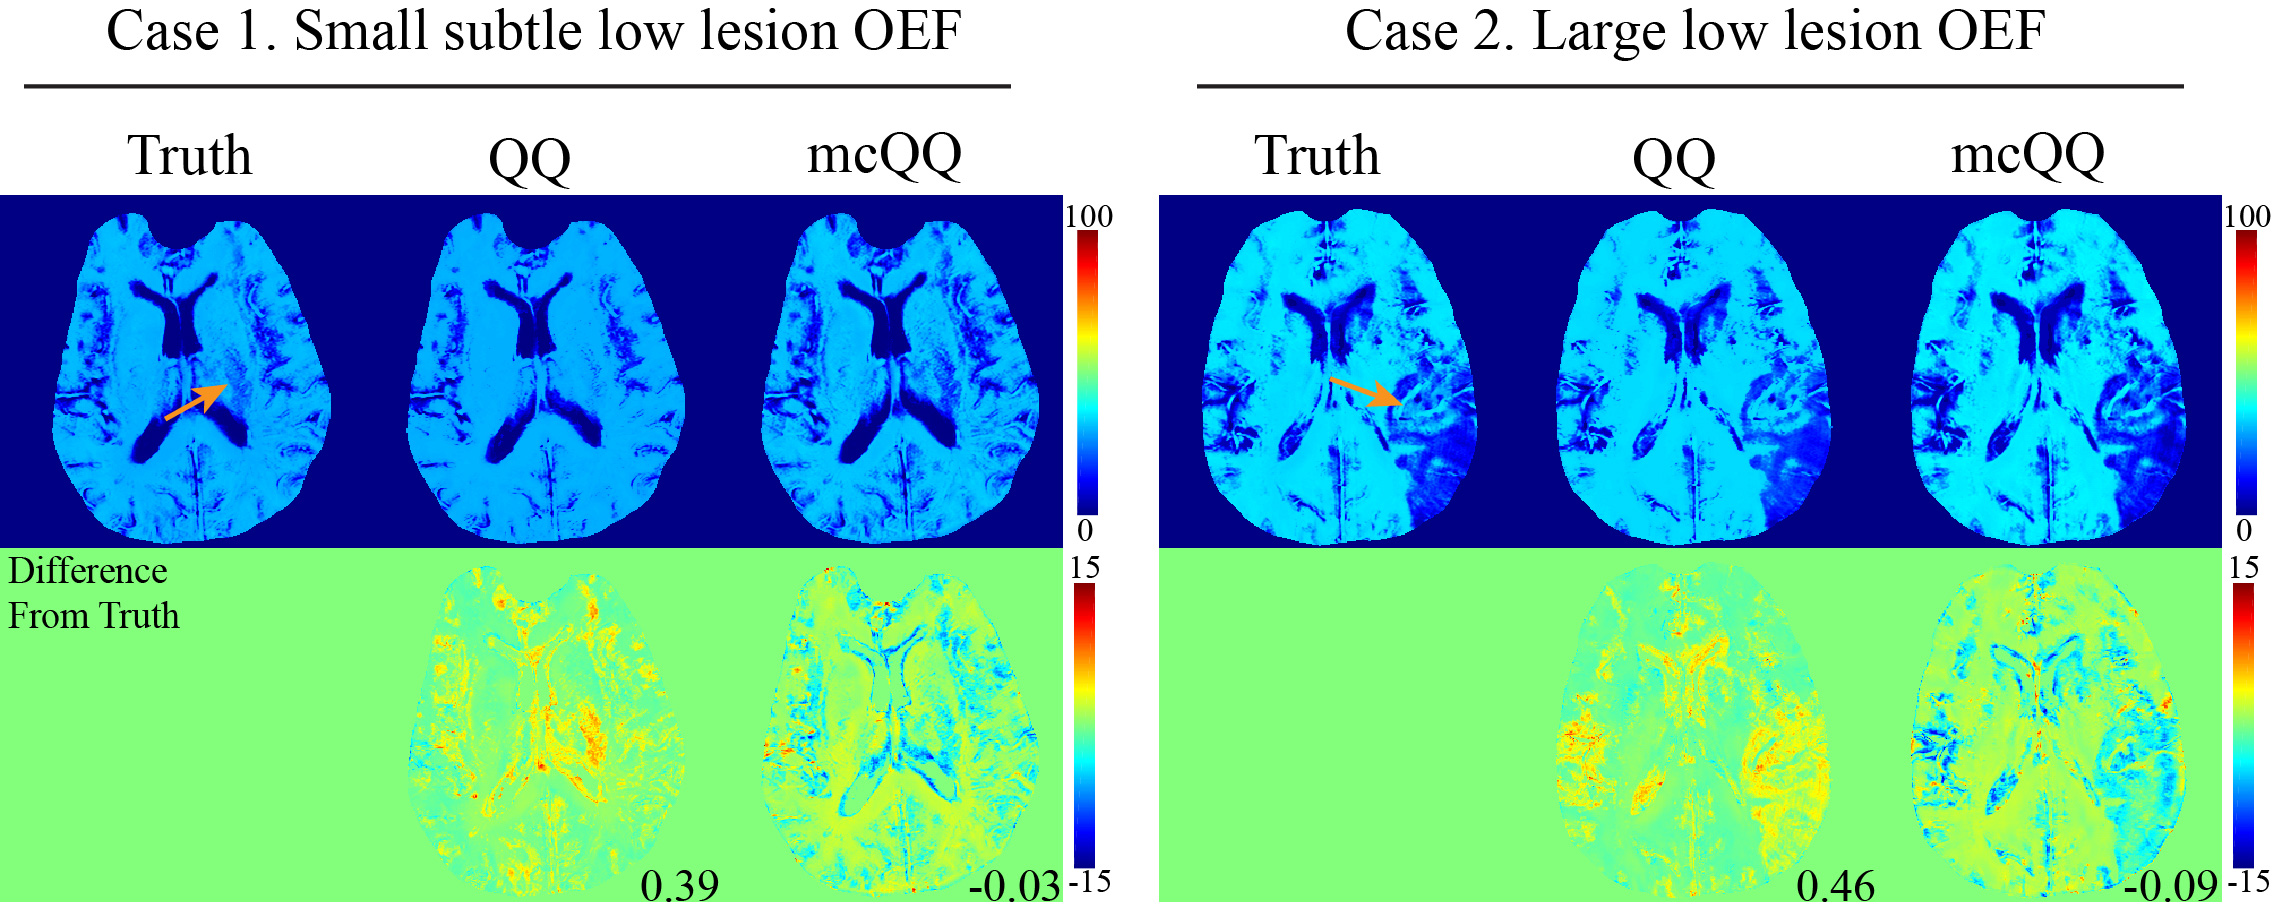
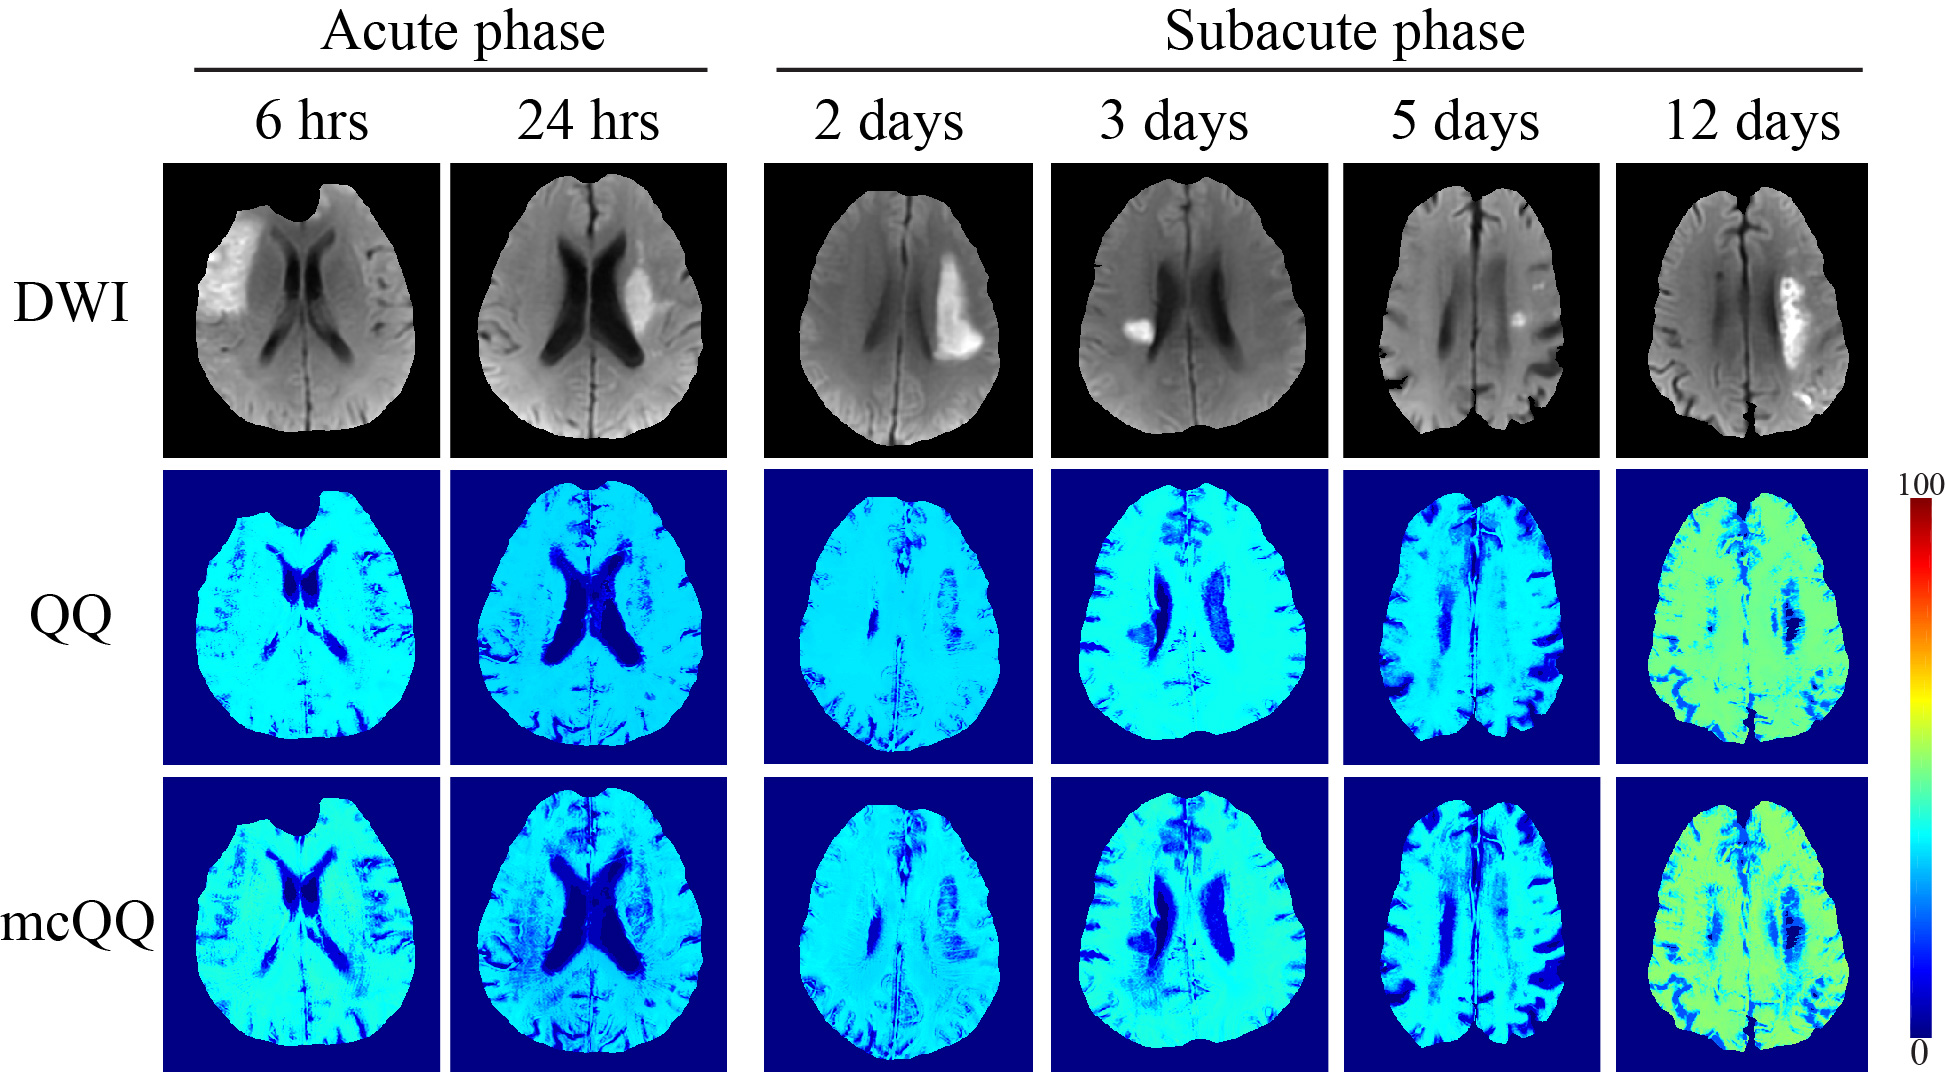
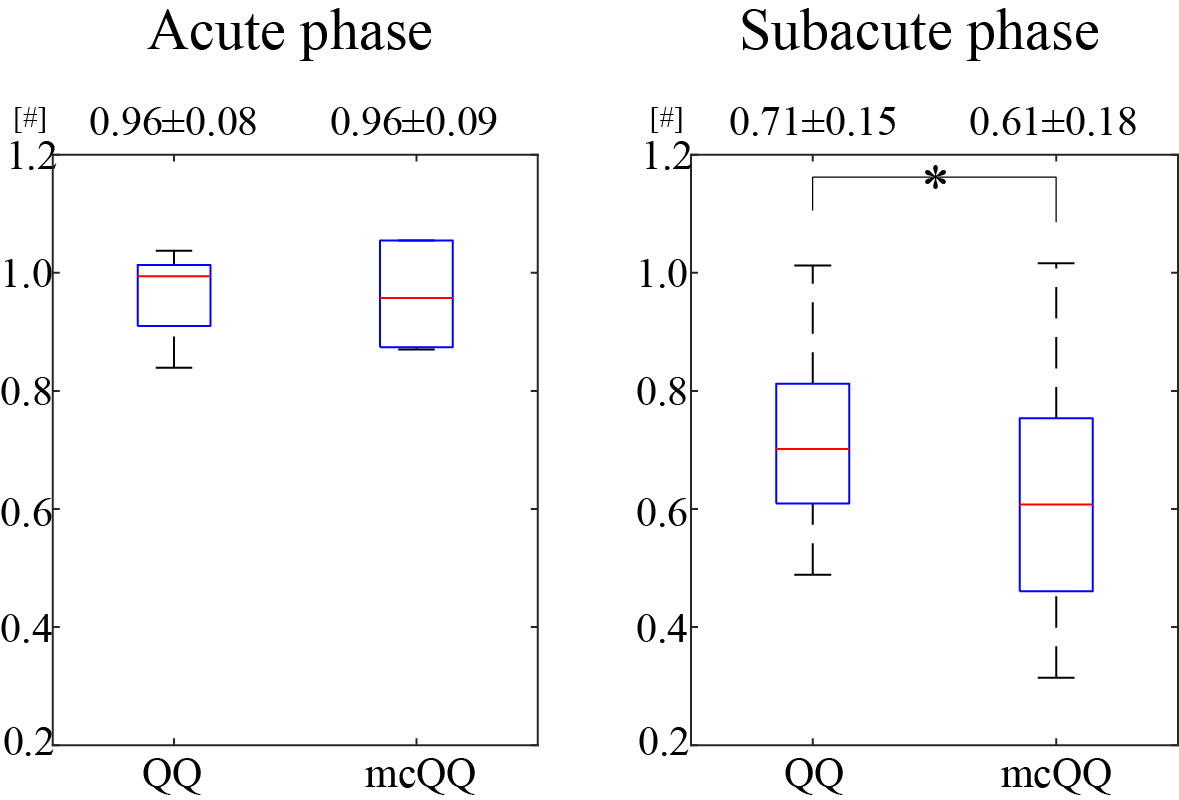
mcQQ showed more accurate OEF in simulation with a smaller mean error compared to QQ (Figure 2) with better depicting low lesion OEF abnormalities (orange arrows). In the stroke patients, mcQQ showed improved spatial overlap between low OEF regions and DWI-defined lesions in the subacute phase (Figure 3). In Figure 4, mcQQ provided significantly lower OEF ratio between lesion and its contralateral normal tissue than QQ in the subacute phase, 0.71 ± 0.15 vs. 0.61 ± 0.18 (p<0.001, Wilcoxon signed rank test), but similar OEF ratio in the acute phase, 0.96 ± 0.08 vs. 0.96 ± 0.09 (p=1.000).Discussion
This study demonstrated the feasibility of a multi-echo complex signal modeling approach for QQ (mcQQ). The improved physics model led to 1) improved OEF accuracy in simulation (Figure 2), especially in the low OEF lesions, and 2) better depiction of OEF abnormalities in subacute stroke patients (Figures 3 and 4). The more realistic data noise consideration in mcQQ is particularly beneficial in low SNR regions. With improved sensitivity to OEF abnormality, mcQQ can be readily applied to investigate tissue variability in neurologic disorders including Alzheimer’s disease35, 36 and multiple sclerosis37.Acknowledgements
No acknowledgement found.References
1. Derdeyn CP, Videen TO, Yundt KD, et al. Variability of cerebral blood volume and oxygen extraction: stages of cerebral haemodynamic impairment revisited. Brain : a journal of neurology 2002; 125: 595-607. 2002/03/02.
2. Gupta A, Chazen JL, Hartman M, et al. Cerebrovascular reserve and stroke risk in patients with carotid stenosis or occlusion: a systematic review and meta-analysis. Stroke 2012; 43: 2884-2891. 2012/10/24. DOI: 10.1161/strokeaha.112.663716.
3. Gupta A, Baradaran H, Schweitzer AD, et al. Oxygen Extraction Fraction and Stroke Risk in Patients with Carotid Stenosis or Occlusion: A Systematic Review and Meta-Analysis. American Journal of Neuroradiology 2014; 35: 250-255. DOI: 10.3174/ajnr.A3668.
4. Cho J, Ma Y, Spincemaille P, et al. Cerebral oxygen extraction fraction: Comparison of dual-gas challenge calibrated BOLD with CBF and challenge-free gradient echo QSM+qBOLD. Magnetic resonance in medicine 2021; 85: 953-961. DOI: https://doi.org/10.1002/mrm.28447.
5. Cho J, Spincemaille P, Nguyen TD, et al. Temporal clustering, tissue composition, and total variation for mapping oxygen extraction fraction using QSM and quantitative BOLD. Magnetic resonance in medicine 2021 2021/06/11. DOI: 10.1002/mrm.28875.
6. Cho J, Zhang S, Kee Y, et al. Cluster analysis of time evolution (CAT) for quantitative susceptibility mapping (QSM) and quantitative blood oxygen level-dependent magnitude (qBOLD)-based oxygen extraction fraction (OEF) and cerebral metabolic rate of oxygen (CMRO2) mapping. 2020; 83: 844-857. DOI: 10.1002/mrm.27967.
7. Cho J, Lee J, An H, et al. Cerebral oxygen extraction fraction (OEF): Comparison of challenge-free gradient echo QSM+qBOLD (QQ) with 15O PET in healthy adults. Journal of Cerebral Blood Flow & Metabolism 2020: 0271678X20973951. DOI: 10.1177/0271678X20973951.
8. Cho J, Kee Y, Spincemaille P, et al. Cerebral metabolic rate of oxygen (CMRO2) mapping by combining quantitative susceptibility mapping (QSM) and quantitative blood oxygenation level-dependent imaging (qBOLD). Magnetic resonance in medicine 2018; 80: 1595-1604. DOI: doi:10.1002/mrm.27135. 9. Zhang S, Cho J, Nguyen TD, et al. Initial Experience of Challenge-Free MRI-Based Oxygen Extraction Fraction Mapping of Ischemic Stroke at Various Stages: Comparison With Perfusion and Diffusion Mapping. Frontiers in Neuroscience 2020;14. Original Research. DOI: 10.3389/fnins.2020.535441.
10. Wu D, Zhou Y, Cho J, et al. The Spatiotemporal Evolution of MRI-Derived Oxygen Extraction Fraction and Perfusion in Ischemic Stroke. Frontiers in Neuroscience 2021; 15. Original Research. DOI: 10.3389/fnins.2021.716031.
11. Cho J, Nguyen TD, Huang W, et al. Brain oxygen extraction fraction mapping in patients with multiple sclerosis. Journal of cerebral blood flow and metabolism : official journal of the International Society of Cerebral Blood Flow and Metabolism 2021: 271678x211048031. 2021/09/25. DOI: 10.1177/0271678x211048031.
12. Shen N, Zhang S, Cho J, et al. Application of Cluster Analysis of Time Evolution for Magnetic Resonance Imaging -Derived Oxygen Extraction Fraction Mapping: A Promising Strategy for the Genetic Profile Prediction and Grading of Glioma. Frontiers in Neuroscience 2021;
15. Original Research. DOI: 10.3389/fnins.2021.736891. 13. Cho J, Zhang J, Spincemaille P, et al. QQ-NET - using deep learning to solve quantitative susceptibility mapping and quantitative blood oxygen level dependent magnitude (QSM+qBOLD or QQ) based oxygen extraction fraction (OEF) mapping. Magnetic resonance in medicine 2021 2021/11/01. DOI: 10.1002/mrm.29057.
14. Jiang D, Deng S, Franklin CG, et al. Validation of T2-based oxygen extraction fraction measurement with 15O positron emission tomography. Magnetic resonance in medicine 2021; 85: 290-297. DOI: https://doi.org/10.1002/mrm.28410.
15. Liu Z, Spincemaille P, Yao Y, et al. MEDI+0: Morphology enabled dipole inversion with automatic uniform cerebrospinal fluid zero reference for quantitative susceptibility mapping. Magnetic resonance in medicine 2018; 79: 2795-2803. 2017/10/13. DOI: 10.1002/mrm.26946.
16. Liu J, Liu T, de Rochefort L, et al. Morphology enabled dipole inversion for quantitative susceptibility mapping using structural consistency between the magnitude image and the susceptibility map. NeuroImage 2012; 59: 2560-2568. DOI: http://dx.doi.org/10.1016/j.neuroimage.2011.08.082.
17. Gudbjartsson H and Patz S. The Rician distribution of noisy MRI data. Magnetic resonance in medicine 1995; 34: 910-914. DOI: 10.1002/mrm.1910340618.
18. Liu T, Wisnieff C, Lou M, et al. Nonlinear formulation of the magnetic field to source relationship for robust quantitative susceptibility mapping. Magnetic resonance in medicine 2013; 69: 467-476. DOI: 10.1002/mrm.24272.
19. Liu T, Khalidov I, de Rochefort L, et al. A novel background field removal method for MRI using projection onto dipole fields (PDF). NMR in biomedicine 2011; 24: 1129-1136.
20. Zhang J, Zhou D, Nguyen TD, et al. Cerebral metabolic rate of oxygen (CMRO2) mapping with hyperventilation challenge using quantitative susceptibility mapping (QSM). Magnetic resonance in medicine 2017; 77: 1762-1773. DOI: 10.1002/mrm.26253.
21. An H and Lin W. Cerebral venous and arterial blood volumes can be estimated separately in humans using magnetic resonance imaging. Magnetic resonance in medicine 2002; 48: 583-588. 2002/09/28. DOI: 10.1002/mrm.10257.
22. Zhang J, Cho J, Zhou D, et al. Quantitative susceptibility mapping-based cerebral metabolic rate of oxygen mapping with minimum local variance. Magnetic resonance in medicine 2017 2017/03/16. DOI: 10.1002/mrm.26657.
23. Sakai F, Nakazawa K, Tazaki Y, et al. Regional cerebral blood volume and hematocrit measured in normal human volunteers by single-photon emission computed tomography. Journal of cerebral blood flow and metabolism : official journal of the International Society of Cerebral Blood Flow and Metabolism 1985; 5: 207-213. 1985/06/01. DOI: 10.1038/jcbfm.1985.27.
24. Savicki JP, Lang G and Ikeda-Saito M. Magnetic susceptibility of oxy- and carbonmonoxyhemoglobins. Proceedings of the National Academy of Sciences 1984; 81: 5417-5419.
25. Hoffman R. Hematology: Basic Principles and Practice. Churchill Livingstone, 2005.
26. Spees WM, Yablonskiy DA, Oswood MC, et al. Water proton MR properties of human blood at 1.5 Tesla: magnetic susceptibility, T(1), T(2), T*(2), and non-Lorentzian signal behavior. Magnetic resonance in medicine 2001; 45: 533-542. 2001/04/03.
27. Zhang J, Liu T, Gupta A, et al. Quantitative mapping of cerebral metabolic rate of oxygen (CMRO2) using quantitative susceptibility mapping (QSM). Magnetic resonance in medicine 2015; 74: 945-952. DOI: 10.1002/mrm.25463.
28. Yablonskiy DA, Sukstanskii AL and He X. BOLD-based Techniques for Quantifying Brain Hemodynamic and Metabolic Properties – Theoretical Models and Experimental Approaches. NMR in biomedicine 2013; 26: 963-986. DOI: 10.1002/nbm.2839.
29. Ulrich X and Yablonskiy DA. Separation of cellular and BOLD contributions to T2* signal relaxation. Magnetic resonance in medicine 2016; 75: 606-615. 2015/03/11. DOI: 10.1002/mrm.25610.
30. Çiçek Ö, Abdulkadir A, Lienkamp SS, et al. 3D U-Net: Learning Dense Volumetric Segmentation from Sparse Annotation. In: Medical Image Computing and Computer-Assisted Intervention – MICCAI 2016 (eds Ourselin S, Joskowicz L, Sabuncu MR, et al.), Cham, 2016// 2016, pp.424-432. Springer International Publishing.
31. Ronneberger O, Fischer P and Brox T. U-Net: Convolutional Networks for Biomedical Image Segmentation. In: Medical Image Computing and Computer-Assisted Intervention – MICCAI 2015 (eds Navab N, Hornegger J, Wells WM, et al.), Cham, 2015// 2015, pp.234-241. Springer International Publishing.
32. Paszke A, Gross S, Chintala S, et al. Automatic differentiation in PyTorch. Conference Proceedings 2017.
33. Kingma DP and Ba J. Adam: A Method for Stochastic Optimization. arXiv e-prints 2014: arXiv:1412.6980.
34. Fung SH, Roccatagliata L, Gonzalez RG, et al. MR diffusion imaging in ischemic stroke. Neuroimaging Clin N Am 2011; 21: 345-377, xi. 2011/06/07. DOI: 10.1016/j.nic.2011.03.001.
35. Sun X, He G, Qing H, et al. Hypoxia facilitates Alzheimer's disease pathogenesis by up-regulating BACE1 gene expression. Proceedings of the National Academy of Sciences of the United States of America 2006; 103: 18727-18732. 2006/11/24. DOI: 10.1073/pnas.0606298103.
36. Acosta-Cabronero J, Williams GB, Cardenas-Blanco A, et al. In vivo quantitative susceptibility mapping (QSM) in Alzheimer's disease. PloS one 2013; 8: e81093. 2013/11/28. DOI: 10.1371/journal.pone.0081093.
37. Trapp BD and Stys PK. Virtual hypoxia and chronic necrosis of demyelinated axons in multiple sclerosis. The Lancet Neurology 2009; 8: 280-291. 2009/02/24. DOI: 10.1016/s1474-4422(09)70043-2.
Figures