0180
Is the intra-axonal T2 relaxation time related to the axonal calibre? A diffusion-relaxation and histological data study1Translational Imaging in Neurology (ThINk) Basel, Department of Biomedical Engineering, University Hospital Basel and University of Basel, Basel, Switzerland, 2MS Center and Research Center for Clinical Neuroimmunology and Neuroscience Basel, University Hospital Basel and University of Basel, Basel, Switzerland, 3Cardiff University Brain Research Imaging Centre, Cardiff University, Cardiff, Wales, United Kingdom, 4Signal Processing Laboratory 5 (LTS5), École Polytechnique Fédérale de Lausanne, Lausanne, Switzerland, 5Department of Applied Mathematics and Computer Science, Technical University of Denmark, Kgs. Lyngby, Denmark, 6Radiology Department, Centre Hospitalier Universitaire Vaudois and University of Lausanne, Lausanne, Switzerland, 7Centre d’Imagerie Biomédicale (CIBM), EPFL, Lausanne, Switzerland, 8Mary MacKillop Institute for Health Research, Faculty of Health Sciences, Australian Catholic University, Melbourne, Australia
Synopsis
The main limitation of current axon diameter mapping techniques is that the diffusion MRI (dMRI) signals from axons smaller than 2.0 μm are practically undistinguished from each other, even for the most advanced human scanners. Consequently, there is a resolution limit for the in vivo estimation of axon diameters from dMRI data. Therefore, it would be desirable to find another source of MRI contrast sensitive to the axonal calibre. This proof-of-concept study used a surface-based relaxation model to investigate whether the intra-axonal T2 estimated in a human brain is related to the inner axon radius measured from histological data.
Introduction
The inner axon diameter is a fundamental brain tissue microstructure parameter that may be inferred from diffusion MRI (dMRI) data. The accurate measurement of axon diameters is important because conduction velocity along axons depends on their calibres1, with larger axons conducting faster than axons with small diameters2,3. The dMRI signal is sensitive to axon diameters if strong magnetic field diffusion gradients (i.e., 300 mT/m in Connectom ‘super-scanners’5 and 1500 mT/m in animal preclinical scanners) are used6–14. However, the main limitation of current axon diameter mapping techniques is that the signals from axons smaller than 2.0 μm are practically indistinguishable from each other, even when the most advanced human Connectom scanners are employed for data acquisition15. Consequently, there is a resolution limit for the in vivo estimation of axon diameters, and unfortunately, most axons have diameters below that limit, i.e., between 0.2 and 2.0 μm16. For these reasons, the estimated axon diameters are overestimated17. As the resolution limit in dMRI depends on the maximum achievable amplitude of the diffusion gradients15, it is desirable to find another source of MRI contrast sensitive to the axonal calibre, not affected by diffusion gradients. Interestingly, various studies in porous media demonstrated that the interaction between the water molecules and the confining pore surface reduces the transversal T2 relaxation time18. This surface-based relaxation mechanism allows pore size to be estimated19–22. A similar relaxation model relating the T2 and the size of cells was proposed23, which could also be employed to estimate axon size. Inspired by these previous findings, we investigate whether the T2 of the intra-axonal space is related to the inner axon radius calculated from histological data.Methods
Data acquisition: Human data were acquired in vivo from one healthy volunteer on a Siemens Connectom 3T system (Cardiff University Brain Research Centre, Wales, UK). The ethics committee approved the study, and the participant provided written informed consent. The diffusion-relaxation protocol comprised four complete sets of 4 images with b=0 s/mm2 and 48 diffusion directions at b=6000 s/mm2 for each of the following echo times: TE=73, 93, 118, and 150 ms. The diffusion times were fixed to 22 ms and 8 ms, respectively, and the voxel size was 2x2x2 mm3.Estimation: The intra-axonal T2 was estimated by using the direction-averaged method proposed in24, as implemented in25. We assumed that for b=6000 s/mm2, the signal arising from the extra-axonal space is practically zero24. The spherical mean dMRI signals for all TEs were used to estimate the intra-axonal T2 by assuming a mono-exponential relaxation model, which was transformed to a linear problem after taking the logarithm25.
Histology: the intra-axonal T2 values in the corpus callosum (CC) were compared with postmortem measurements from previous studies14,26. Axons stained for myelin were measured in CC sectors crossed by axons connecting the prefrontal, motor, parietal and visual cortices. The volume-weighted mean axon radius in each CC sector was estimated14.
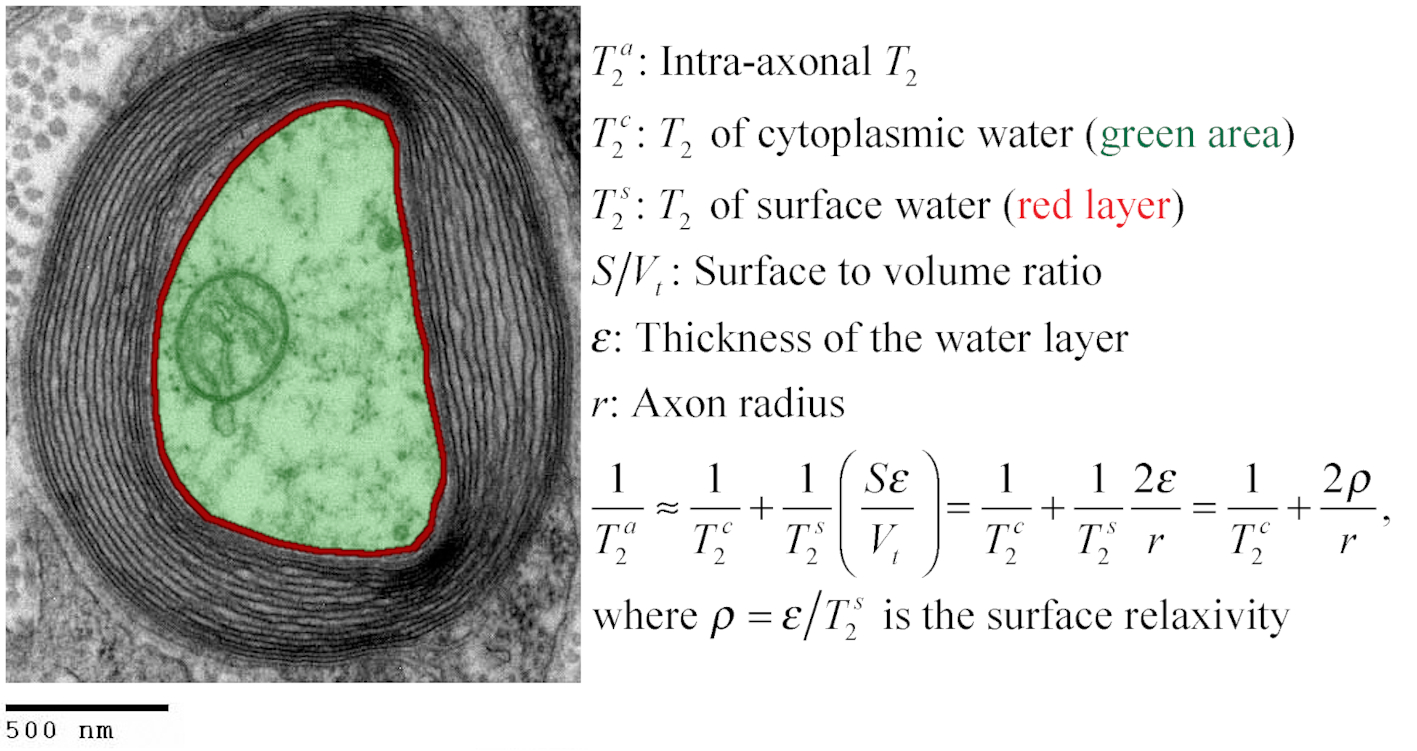
Correlation: the intra-axonal T2 values and the volume-weighted mean axon radius were related using the surface-based relaxation model represented in Figure 1. Moreover, we correlated the volume-weighted mean axon radius and the mean axon diameter index estimated from diffusion MRI data using values reported in a previous publication that employed the same CC sectors in three healthy volunteers14.
Results
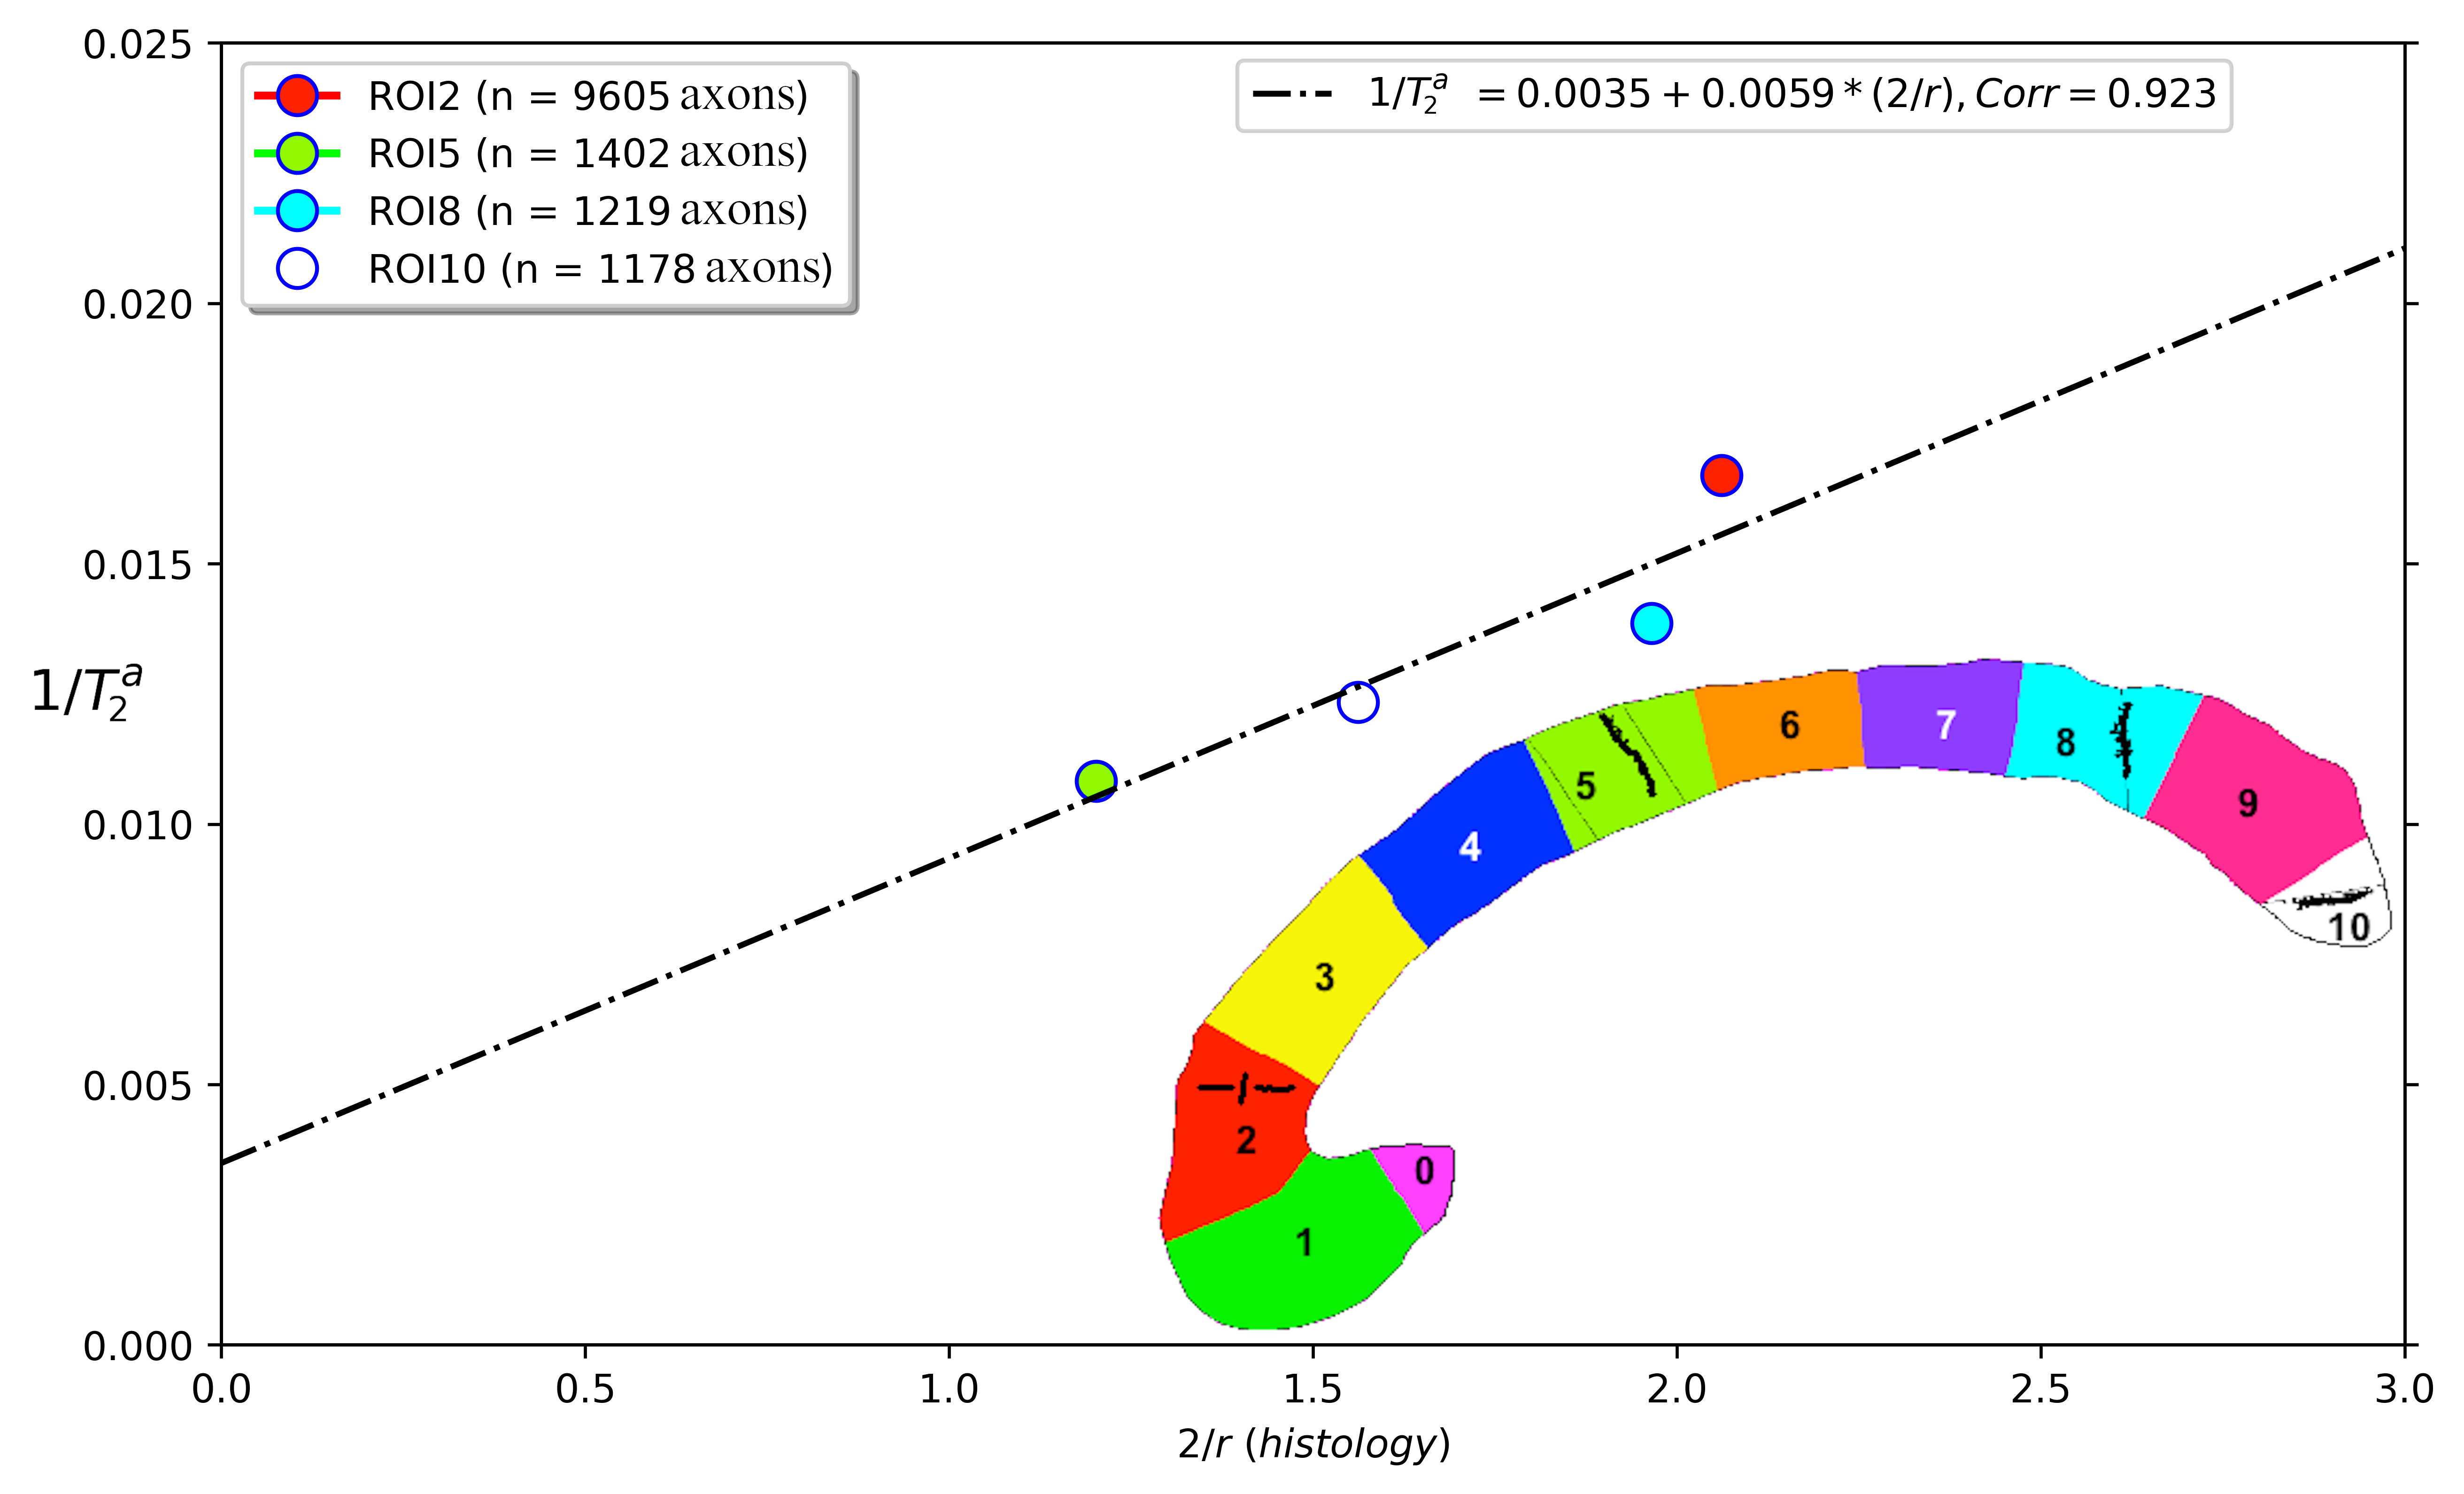
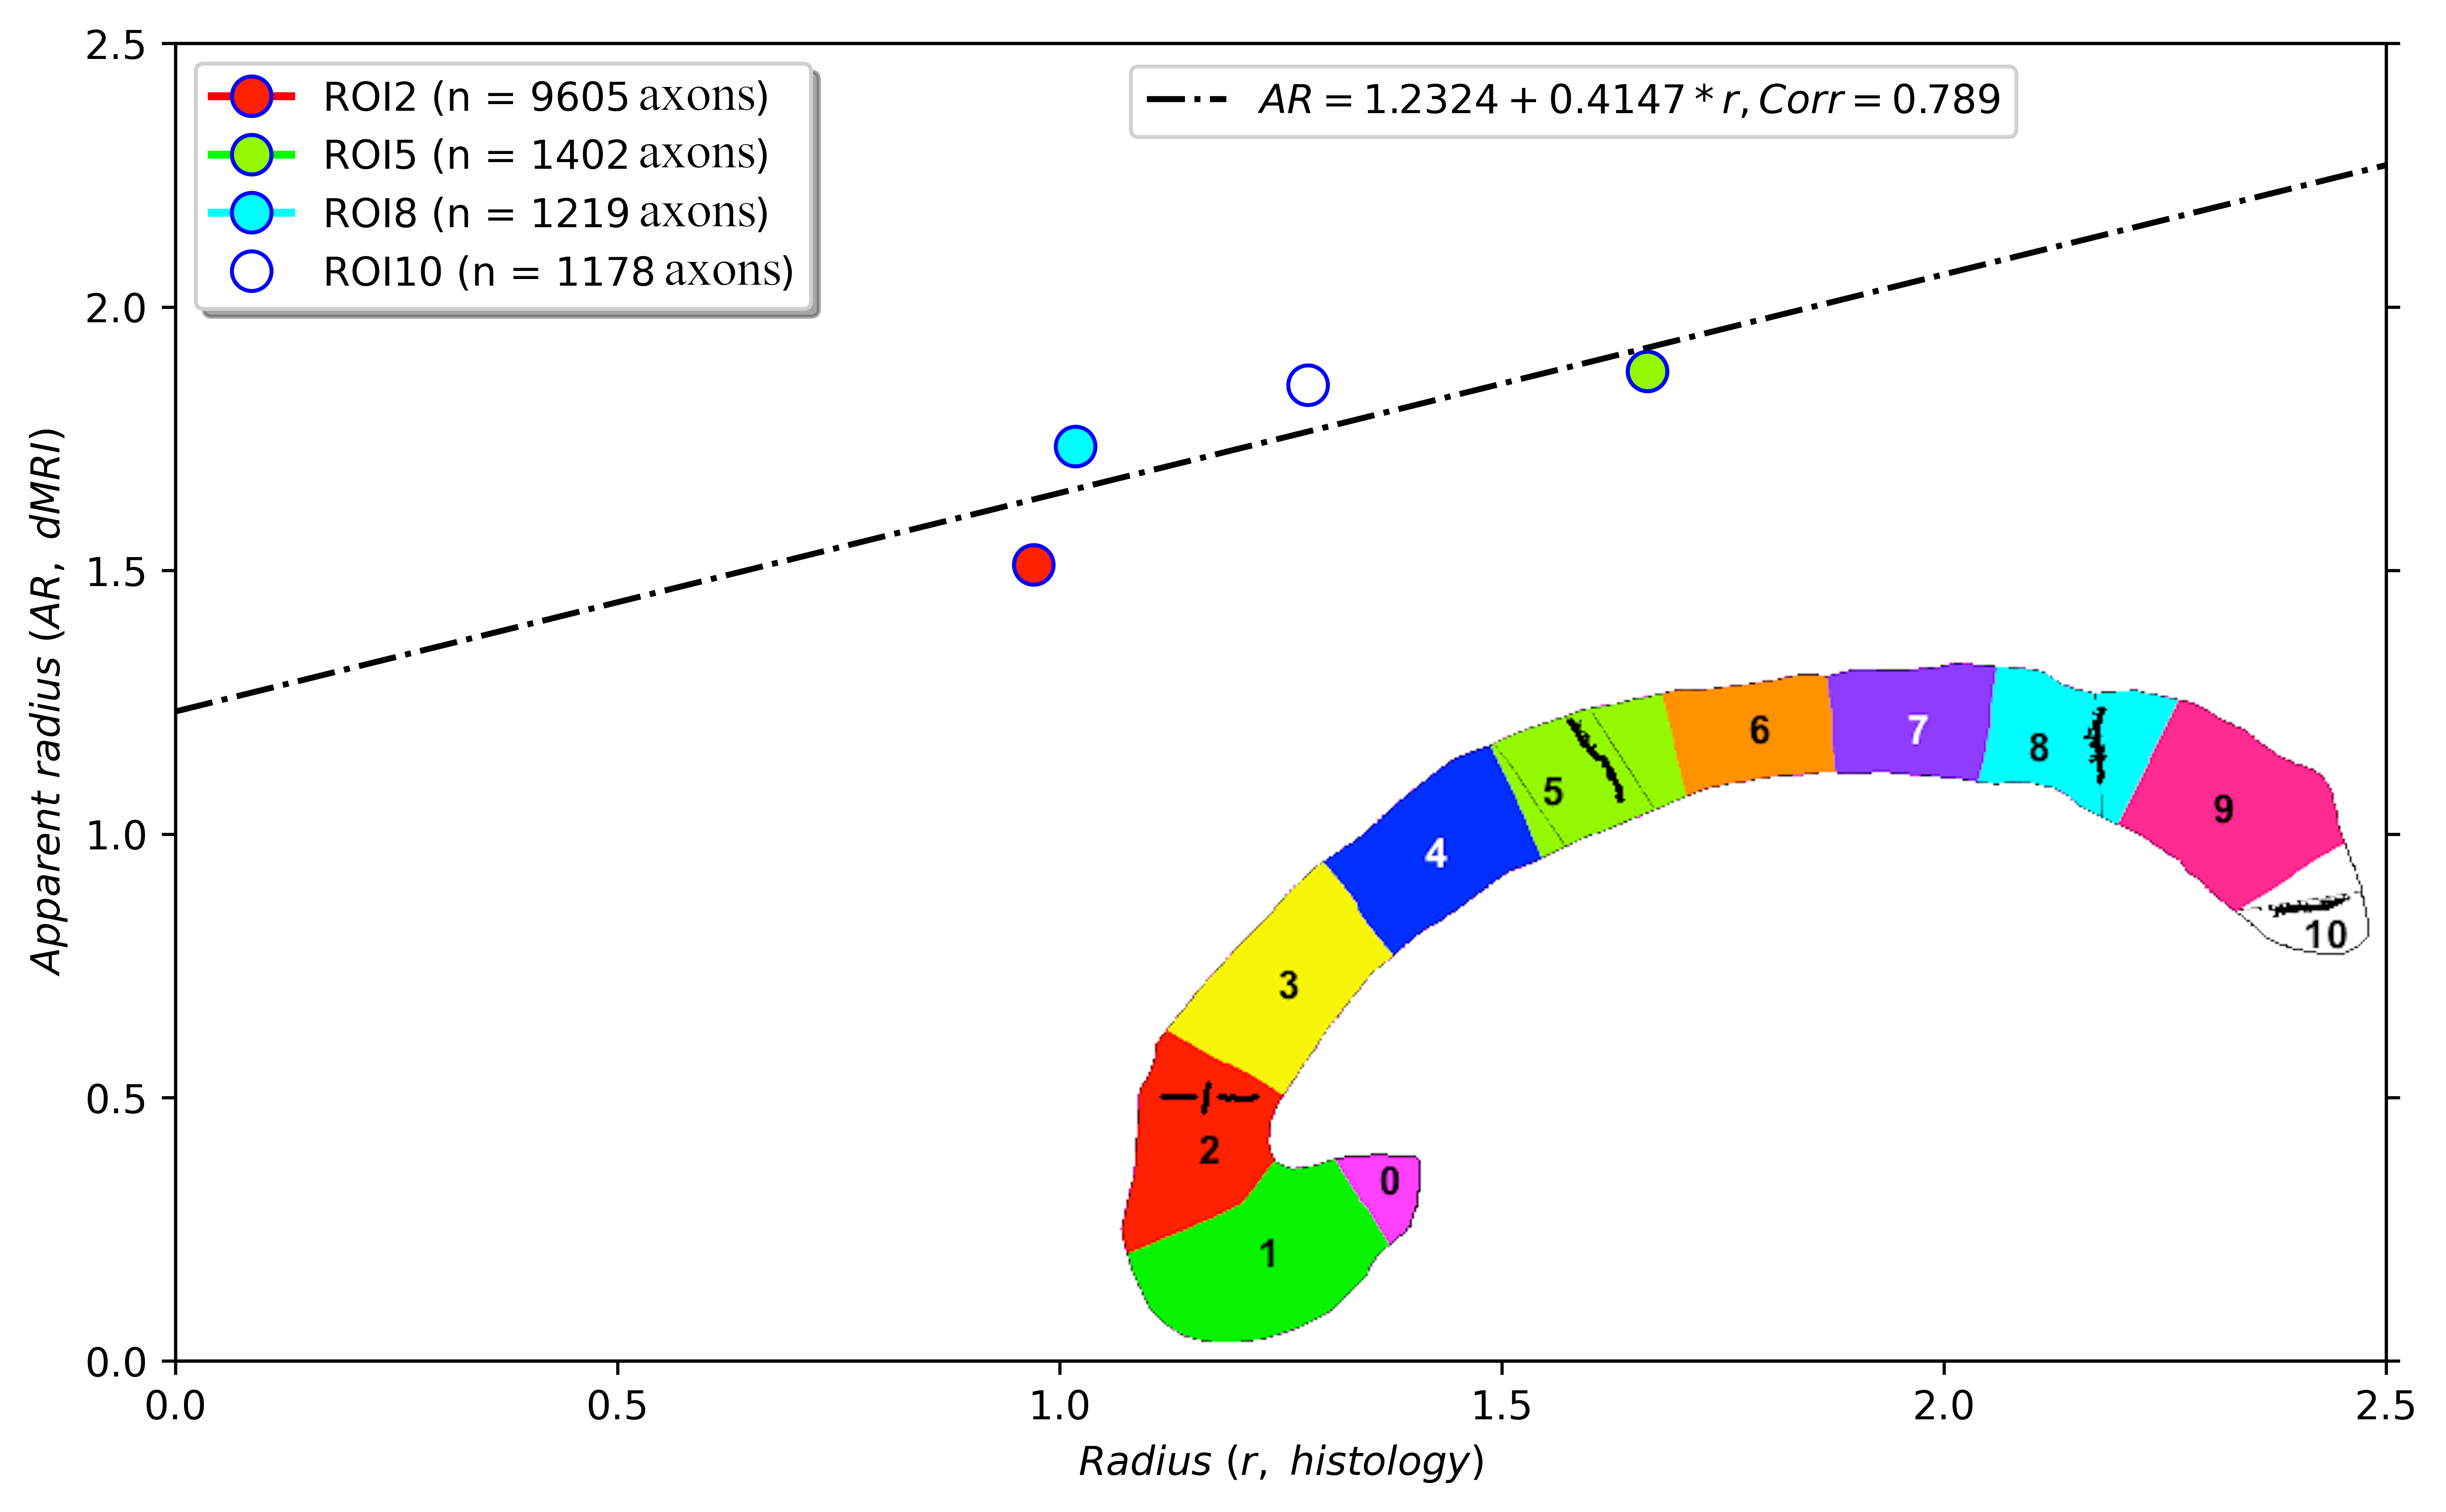
Figure 2 shows the regression line fitting the intra-axonal T2 and mean radius from four CC regions (for more details, see Figure 1). The correlation coefficient between both data was 0.923. From the estimated coefficients, we found that $$$T_{2}^{c}$$$=286 ms and $$$\rho$$$≈6*10-3 µm/ms (i.e., 6.0 µm/s). The linear relationship between the histological mean radius and the apparent radius estimated from dMRI data is depicted in Figure 3. In this case, the correlation coefficient was 0.789.Discussion and Conclusion
This proof-of-concept study shows that the intra-axonal T2 is highly related to the axon radius measured in histological data. Conspicuously, the correlation was higher than that observed between the histology and the axon diameter index derived from dMRI data, which showed a bias in the estimated radius (i.e., intercept of the regression line) slightly higher than the resolution limit (i.e., radius overestimation of 1.23 µm). Future studies should extend our work to other white matter tracts. Although the intra-axonal T2 may depend on the fibre orientation, its orientational dependence is much weaker than that of the extra-axonal space28; thus, considering other tracts is plausible. Another possible extension is to estimate bundle-specific intra-axonal T2 values within a voxel25, which may be used to resolve multiple axonal calibres. Furthermore, as the intra-axonal T2 may not be affected by the magnitude of the diffusion gradients, it could be employed to predict the mean axon radius in clinical scanners beyond the current resolution limit. The validation of these hypotheses in ex vivo datasets is the object of future works.We note that a previous theoretical study already suggested inferring the axon radius from T2 values29; however, the surface relaxivity and $$$T_{2}^{c}$$$ were fixed by hand to values that do not agree with our experimental results. Notably, our estimated cytoplasmic water $$$T_{2}^{c}$$$ is similar to that reported in27 for a squid giant axon, i.e., 326 ms +/- 25 ms.
Acknowledgements
The Swiss National Science Foundation (SNSF) supports this project (Ambizione grant PZ00P2_185814 to EJC-R). MP was supported by the European Union’s Horizon 2020 research and innovation programme under the Marie Skłodowska-Curie grant (agreement No 754462). DKJ is supported by a Wellcome Trust Investigator Award (096646/Z/11/Z) and a Wellcome Trust Strategic Award (104943/Z/14/Z). The presented study is a tribute to Professor Giorgio Innocenti.References
1. Goldstein, S. S. & Rall, W. Changes of Action Potential Shape and Velocity for Changing Core Conductor Geometry. Biophys. J. 14, 731–757 (1974).
2. Costa, A. R., Pinto-Costa, R., Sousa, S. C. & Sousa, M. M. The Regulation of Axon Diameter: From Axonal Circumferential Contractility to Activity-Dependent Axon Swelling. Front. Mol. Neurosci. 0, 319 (2018).
3. Drakesmith, M. et al. Estimating axon conduction velocity in vivo from microstructural MRI. Neuroimage 203, 116186 (2019).
4. Huang, S. Y. et al. Corpus callosum axon diameter relates to cognitive impairment in multiple sclerosis. Ann. Clin. Transl. Neurol. 6, 882 (2019).
5. Jones, D. K. et al. Microstructural imaging of the human brain with a ‘super-scanner’: 10 key advantages of ultra-strong gradients for diffusion MRI. Neuroimage (2018). doi:10.1016/j.neuroimage.2018.05.047
6. De Santis, S., Jones, D. K. & Roebroeck, A. Including diffusion time dependence in the extra-axonal space improves in vivo estimates of axonal diameter and density in human white matter. Neuroimage 130, 91–103 (2016).
7. Veraart, J. et al. Noninvasive quantification of axon radii using diffusion MRI. doi:10.7554/eLife.49855
8. Duval, T. et al. In vivo mapping of human spinal cord microstructure at 300 mT/m. Neuroimage 118, 494–507 (2015).
9. Dyrby, T. B., Søgaard, L. V., Hall, M. G., Ptito, M. & Alexander, D. C. Contrast and stability of the axon diameter index from microstructure imaging with diffusion MRI. Magn. Reson. Med. 70, 711–721 (2013).
10. Assaf, Y. et al. AxCaliber: a method for measuring axon diameter distribution from diffusion MRI. Magn. Reson. Med. 59, 1347–1354 (2008).
11. Alexander, D. C. A general framework for experiment design in diffusion MRI and its application in measuring direct tissue-microstructure features. Magn Reson Med 60, 439–448 (2008).
12. Assaf, Y. & Basser, P. J. Composite hindered and restricted model of diffusion (CHARMED) MR imaging of the human brain. Neuroimage 27, 48–58 (2005).
13. Assaf, Y., Freidlin, R. Z., Rohde, G. K. & Basser, P. J. New modeling and experimental framework to characterize hindered and restricted water diffusion in brain white matter. Magn. Reson. Med. 52, 965–978 (2004).
14. Barakovic, M. et al. Bundle-Specific Axon Diameter Index as a New Contrast to Differentiate White Matter Tracts. Front. Neurosci. 0, 687 (2021).
15. Nilsson, M. et al. Resolution limit of cylinder diameter estimation by diffusion MRI: The impact of gradient waveform and orientation dispersion. NMR Biomed. 30, (2017).
16. Edgar, J. M. & Griffiths, I. R. White Matter Structure: A Microscopist’s View. Diffus. MRI From Quant. Meas. to vivo Neuroanat. Second Ed. 127–153 (2014). doi:10.1016/B978-0-12-396460-1.00007-X
17. Alexander, D. C. et al. Orientationally invariant indices of axon diameter and density from diffusion MRI. Neuroimage 52, 1374–1389 (2010).
18. Brownstein, K. R. & Tarr, C. E. Spin-lattice relaxation in a system governed by diffusion. J. Magn. Reson. 26, 17–24 (1977).
19. Müller-Petke, M., Dlugosch, R., Lehmann-Horn, J. & Ronczka, M. Nuclear magnetic resonance average pore-size estimations outside the fast-diffusion regime. GEOPHYSICS (2015). doi:10.1190/geo2014-0167.1
20. Sørland, G. H., Djurhuus, K., Widerøe, H. C., Lien, J. R. & Skauge, A. Absolute pore size distribution from NMR. Diffus. Fundam. (2007).
21. Mohnke, O. & Hughes, B. Jointly deriving NMR surface relaxivity and pore size distributions by NMR relaxation experiments on partially desaturated rocks. Water Resour. Res. 50, 5309–5321 (2014).
22. Slijkerman, W. F. J. & Hofman, J. P. Determination of surface relaxivity from NMR diffusion measurements. in Magnetic Resonance Imaging (1998). doi:10.1016/S0730-725X(98)00058-7
23. Brownstein, K. R. & Tarr, C. E. Importance of classical diffusion in NMR studies of water in biological cells. Phys. Rev. A 19, 2446–2453 (1979).
24. McKinnon, E. T. & Jensen, J. H. Measuring intra-axonal T2 in white matter with direction-averaged diffusion MRI. Magn. Reson. Med. 81, 2985–2994 (2019).
25. Barakovic, M. et al. Resolving bundle-specific intra-axonal T2 values within a voxel using diffusion-relaxation tract-based estimation. Neuroimage 227, 117617 (2021).
26. Caminiti, R., Ghaziri, H., Galuske, R., Hof, P. R. & Innocenti, G. M. Evolution amplified processing with temporally dispersed slow neuronal connectivity in primates. Proc. Natl. Acad. Sci. U. S. A. 106, 19551 (2009).
27. Chang, D. C. & Hazlewood, C. F. Nuclear magnetic resonance study of squid giant axon. Biochim. Biophys. Acta - Gen. Subj. 630, 131–136 (1980).
28. Tax, C. M. W. et al. Measuring compartmental T2-orientational dependence in human brain white matter using a tiltable RF coil and diffusion-T2 correlation MRI. Neuroimage 236, 117967 (2021).
29. Kaden, E. & Alexander, D. C. Can T2-spectroscopy resolve submicrometer axon diameters? Inf. Process. Med. Imaging 23, 607–618 (2013).
30. Zimmerman, J. R. & Brittin, W. E. Nuclear magnetic resonance studies in multiple phase systems: Lifetime of a water molecule in an adsorbing phase on silica gel. J. Phys. Chem. 61, 1328–1333 (1957).
31. Le Bihan, D. The ‘wet mind’: water and functional neuroimaging. Phys Med Biol 52, R57-90 (2007).
32. RM, L., CM, C. & AJ, S. Elemental composition and water content of myelinated axons and glial cells in rat central nervous system. Brain Res. 549, 253–259 (1991).
Figures