0179
Further insight on T1 relaxation in fat-water mixtures1Medical Imaging, McGill University Health Center, Montreal, QC, Canada, 2Medical Physics Unit, McGill University, Montreal, QC, Canada, 3Research Institute of McGill University Health Center, Montreal, QC, Canada
Synopsis
The impact of the fat fraction in fat-water mixtures on the fat and water T1s is an open question, with variable observations reported in phantoms, in vivo in bone marrow, and in liver. This work investigated variations of fat and water T1 as a function of fat content in phantoms in the presence of a water relaxation enhancing agent (MnCl2). Fat fraction and MnCl2 impacted both the water and fat T1s, in different ways. Our observations may shed light on variable trends of fat and water T1 as a function of fat content reported in the literature.
INTRODUCTION
Fat and water T1 decrease with increasing fat content in different fat-water phantoms and in vivo in bone marrow1–3. A model has recently been demonstrated to describe this dependence of fat and water T1 on the fat content in fat-water mixtures3. Conflicting observations have been reported in vivo in liver, where fat and water T1 did not correlate with fat content4–6. One hypothesis to explain this discrepancy is that iron in liver reduces the T2* and T1 of tissue7,8, thus competing with variations of fat and water T1 as a function of the fat content. This work investigates the dependence of fat and water T1 in fat-water phantoms on fat content in the presence of a relaxation enhancing agent, to mimic the relaxation effects of iron in liver7,9,10.METHODS
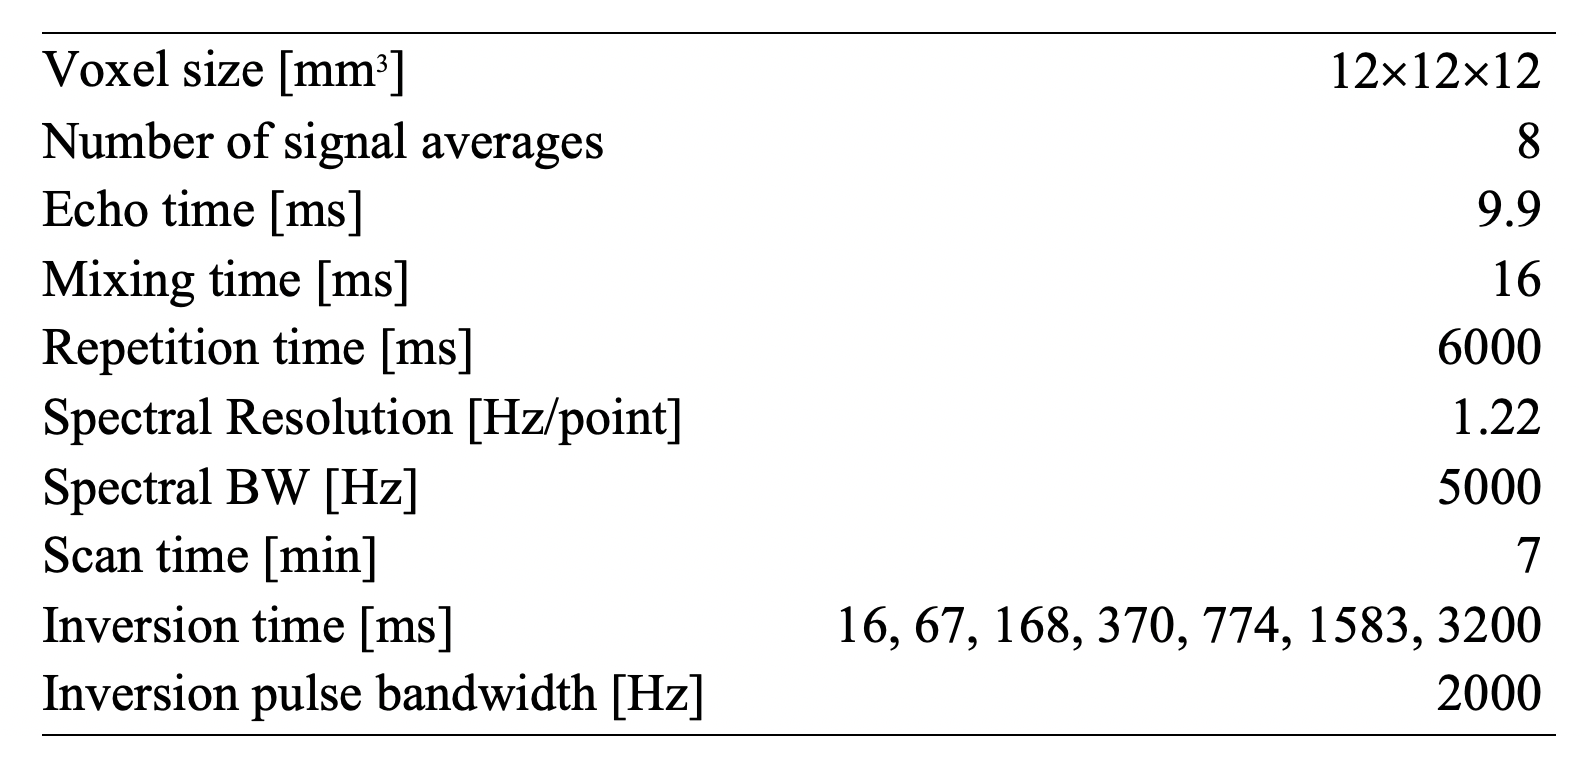
A safflower oil emulsion with a fat mass fraction of 52.30% (Microlipid, Nestle Inc.) was diluted in 50-ml vials with distilled deionized water to produce five different fat mass fractions (Ftrue) (3.15, 12.67, 25.60, 38.81 and 52.30%). Manganese chloride (Sigma-Aldrich Inc.) was added to the vials at four different concentrations ([MnCl2] = 0.05, 0.2, 0.5, and 0.8 mM) to modulate the T2* and T1 of the emulsion. MnCl2 reportedly modulates the T2* of water but not fat11. Four vials of distilled deionized water were also prepared at the same [MnCl2]. The vials were placed in a large container (~20 cm diameter) filled with a solution of distilled deionized water doped with a gadolinium-based contrast agent (0.10 mM) and NaCl (85mM).Measurements were performed using a 3 T system (Ingenia, Philips Healthcare) with a 15-channel head coil, in five experiments grouping the vials by fat mass fraction. A single voxel inversion-recovery stimulated echo acquisition mode (IR-STEAM) MR spectroscopy (MRS) sequence was used to acquire data in each phantom vial. The acquisition parameters are described in Table 1. The phantom temperature was measured before and after each experiment.
Raw MRS data were processed using custom software in Matlab (The Mathworks, USA, R2019b). A zero-order phase correction was performed in the time domain, followed by a least-squares fit to a spectral model with nine resonances (water + eight fat resonances). MRS fits with a coefficient of determination (R2) smaller than 0.7 were excluded. The absolute area of resonances was fitted as a function of the inversion time to estimate the T1 of each resonance, accounting for the finite TR, imperfect inversion, and polarity restoration, as previously proposed3.
T1 variations were investigated as a function of Ftrue and [MnCl2]. The longitudinal relaxivity of MnCl2 in water (r1,MnCl2) was taken as the slope of a linear fit to the water R1 (=1/T1) measurements as a function of [MnCl2] in the water-only vials.
RESULTS AND DISCUSSION
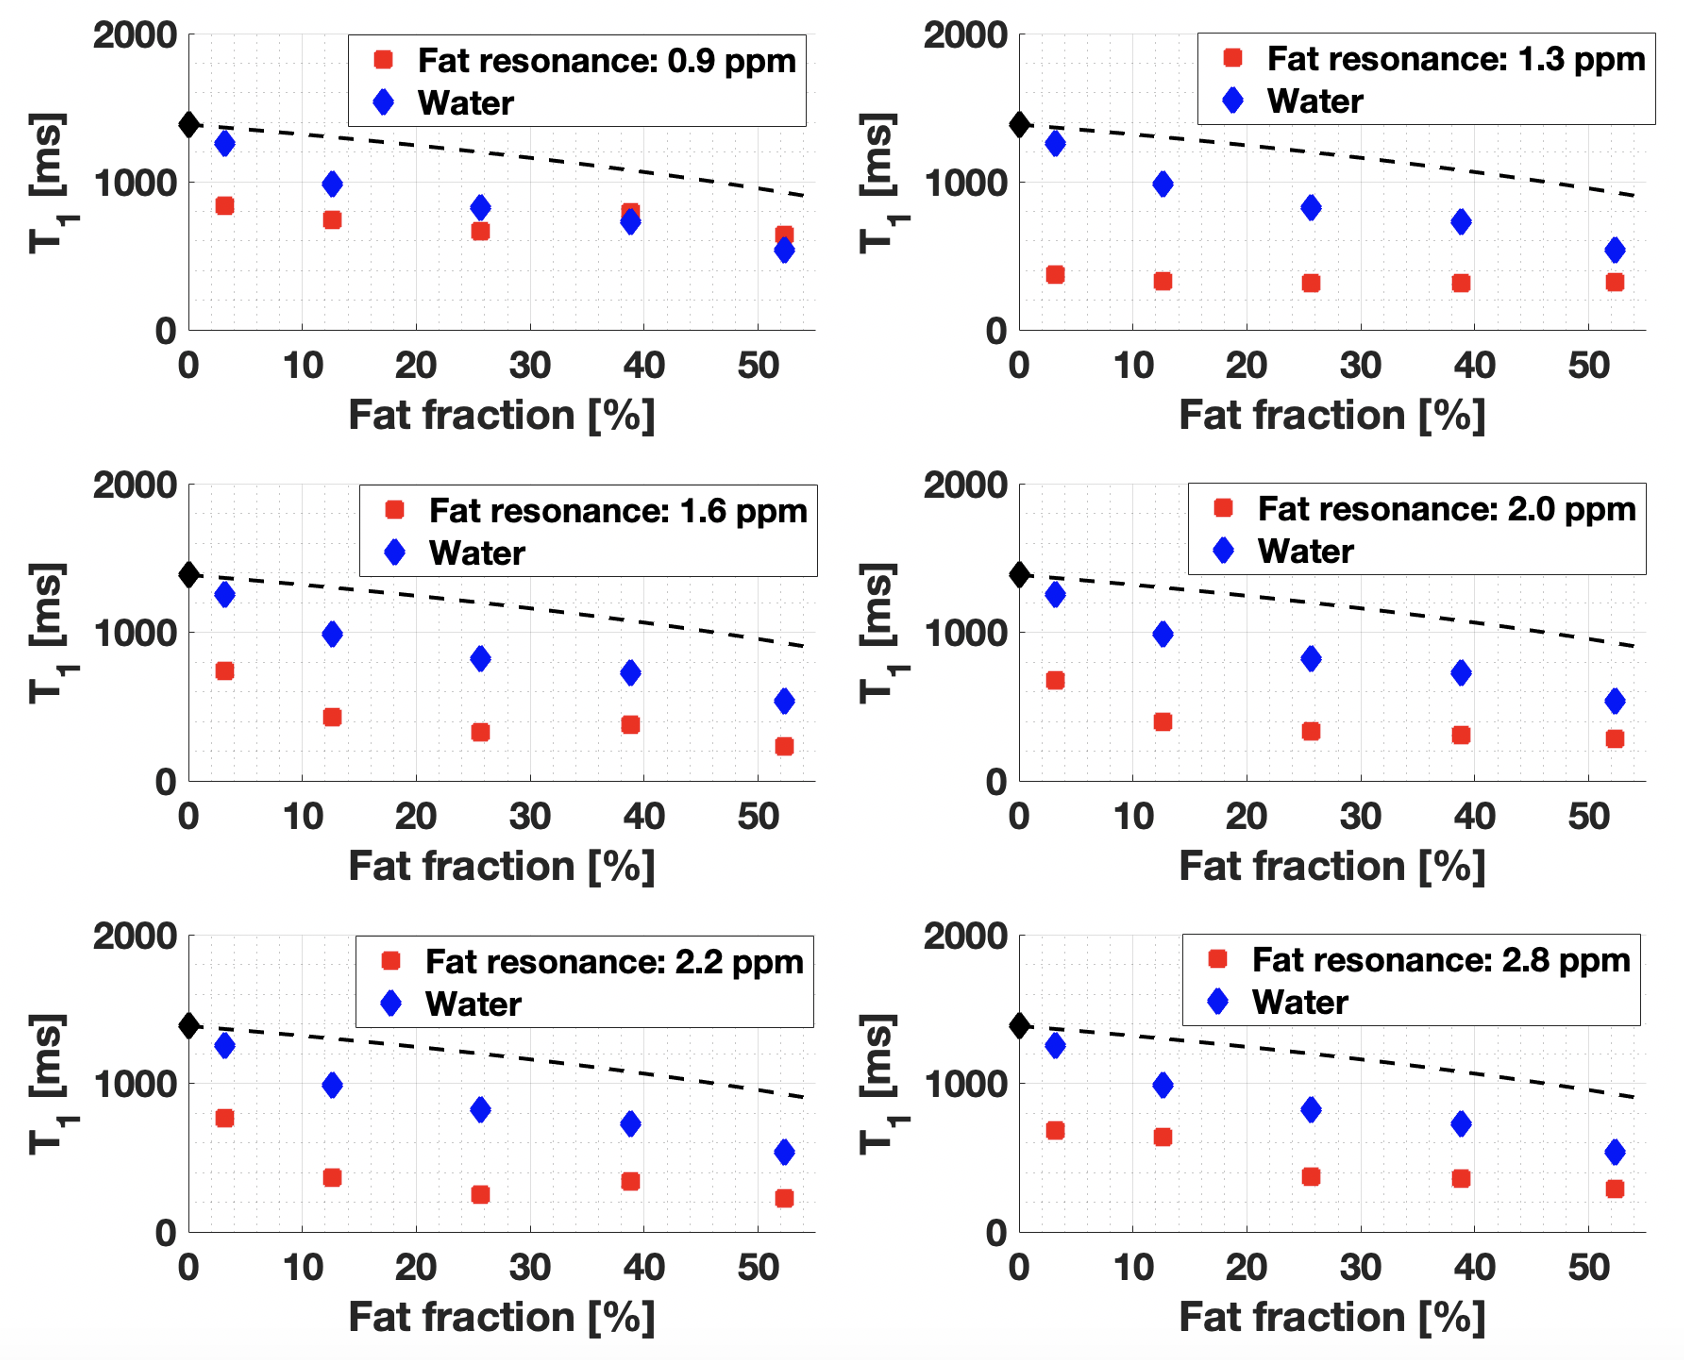
The phantom temperature varied between 21.9 and 23.0°C over all experiments. 7.8% of all measurements performed in fat-water emulsions were excluded based on the low R2 of the MRS fit. A r1,MnCl2 of 6.52 s-1mM-1 was measured in water, consistent with literature9.At low [MnCl2], the trends of fat and water T1 as a function of Ftrue were the same as previously reported3 (Figure 1). As the [MnCl2] increased, and thus the water T1 and T2* decreased, the variation of water T1 as a function of Ftrue remained nearly linear (Figure 2). MnCl2 relaxation effects became dominant when water T1 was reduced below fat T1, as shown in Figure 2 where the measurements follow more and more closely the dashed lines as [MnCl2] is increased. This suggests that the impact of Ftrue on water T1 depends on the native T1 and T2* of water. This might suggest a mechanism for the absence of correlation in liver between water T1 and fat content4–6.
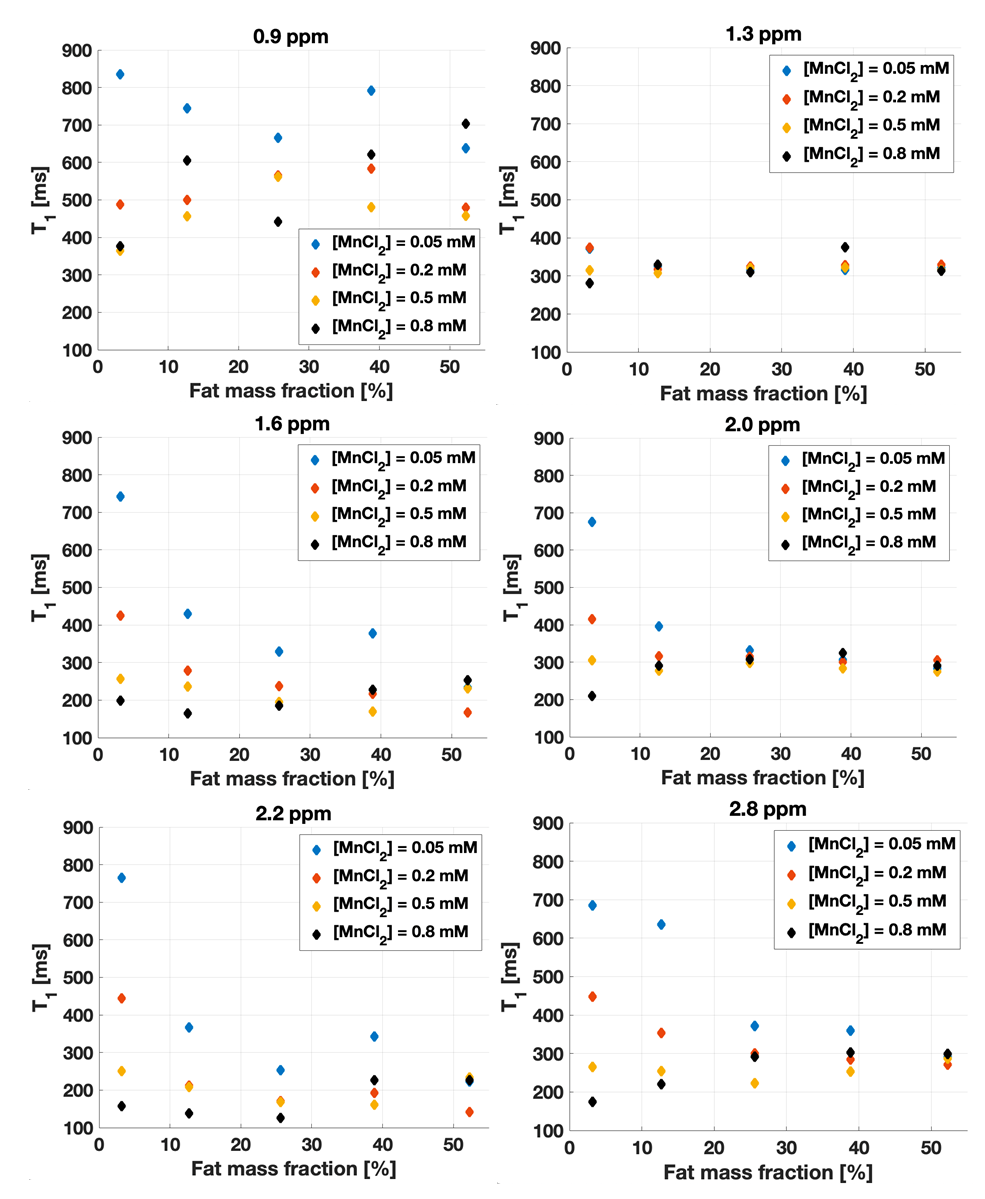
For most fat resonances, fat T1 was stable at high fat content, while it was influenced by the water T1 at low Ftrue (Figure 3), which varied with changing [MnCl2]. The influence of the water T1 on fat T1 becomes obvious when the T1 of water is independently modulated by a relaxing agent. These interactions between the fat T1 and the water T1 might also suggest a mechanism for the absence of correlation between fat T1 and fat content in liver4,5.
CONCLUSION
Phantom experiments demonstrated variations of fat and water T1 as a function of the fat content that are affected by MnCl2, which enhances water relaxation. These observations support an influence of the water T1 (and possibly T2*) on the fat T1, but mainly at low fat fraction, which might explain the inconsistent trends reported in the literature for T1 variations versus fat content. Future work will focus on measurements at larger fat content and on modeling the observed fat and water T1 variations.Acknowledgements
The authors acknowledge the Body Magnetic Resonance research group (Technical University of Munich) for sharing their MRS processing software, Dr. Caroline Reinhold (McGill University Health Center) for phantoms materials, and Guillaume Gilbert (Philips Healthcare, Inc.), Atiyah Yahya (University of Alberta), and Jamie Near (University of Toronto) for useful discussion. This work was funded by the Natural Science and Engineering Research Council of Canada (NSERC) and the Fonds de Recherche du Québec - Santé (FRQS - Programme de chercheurs boursiers).References
1. Le Ster C, Lasbleiz J, Kannengiesser S, Guillin R, Gambarota G, Saint-Jalmes H. A fast method for the quantification of fat fraction and relaxation times: Comparison of five sites of bone marrow. Magn Reson Imaging. 2017;39:157-161. doi:10.1016/j.mri.2017.03.001
2. Hu HH, Nayak KS. Change in the proton T1 of fat and water in mixture. Magn Reson Med. 2010;63(2):494-501. doi:10.1002/mrm.22205
3. Fortier V, Levesque IR. Longitudinal relaxation in fat-water mixtures and its dependence on fat content at 3 T. NMR Biomed. 2021;(August):1-13. doi:10.1002/nbm.4629
4. Thompson RB, Chow K, Mager D, Pagano JJ, Grenier J. Simultaneous proton density fat-fraction and R2* imaging with water-specific T1 mapping (PROFIT1 ): application in liver. Magn Reson Med. 2021;85(1):223-238. doi:10.1002/mrm.28434
5. Hamilton G, Schlein AN, Middleton MS, Loomba R, Sirlin CB. Relation between T1 and T2 of liver water and fat and Proton Density Fat Fraction estimated by a flip angle corrected multi-TR , multi-TE single breath-hold 1H MRS STEAM sequence. In: Proceedings of the 27th Annual Meeting of ISMRM, Montreal, Quebec, Canada, 2019. Abstract 1763.
6. Simchick G, Zhao R, Hamilton G, Reeder S, Hernando D. Multi-Parametric Relationships in Subjects with Liver Iron Overload Obtained using STEAM-MRS at 1 . 5T and. In: Proceedings of the Virtual Meeting of ISMRM, 2021. Abstract #1872.
7. Yokoo T, Yuan Q, Sénégas J, Wiethoff AJ, Pedrosa I. Quantitative R2∗ MRI of the liver with rician noise models for evaluation of hepatic iron overload: Simulation, phantom, and early clinical experience. J Magn Reson Imaging. 2015;42(6):1544-1559. doi:10.1002/jmri.24948
8. Tosk JM, Holshouser BA, Aloia RC, et al. Effects of the interaction between ferric iron and L‐dopa melanin on T1 and T2 relaxation times determined by magnetic resonance imaging. Magn Reson Med. 1992;26(1):40-45. doi:10.1002/mrm.1910260105
9. Thangavel K, Saritaş EÜ. Aqueous paramagnetic solutions for MRI phantoms at 3 T: A detailed study on relaxivities. Turkish J Electr Eng Comput Sci. 2017;25(3):2108-2121. doi:10.3906/elk-1602-123
10. St. Pierre TG, Clark PR, Chua-Anusorn W, et al. Noninvasive measurement and imaging of liver iron concentrations using proton magnetic resonance. Blood. 2005;105(2):855-861. doi:10.1182/blood-2004-01-0177
11. Zhao R, Hamilton G, Brittain JH, Reeder SB, Hernando D. Design and evaluation of quantitative MRI phantoms to mimic the simultaneous presence of fat, iron, and fibrosis in the liver. Magn Reson Med. 2020;(March):1-14. doi:10.1002/mrm.28452
Figures