0178
R1ρ Dispersion Imaging of Normal Tissues in Human Subjects at 3T1Vanderbilt University Institute of Imaging Science, Nashville, TN, United States, 2Department of Radiology and Radiological Sciences, Vanderbilt University Medical Center, Nashville, TN, United States, 3Department of Biomedical Engineering, Vanderbilt University, Nashville, TN, United States
Synopsis
R1ρ dispersion over a range of weak locking fields has the potential to reveal information on microvascular geometry and density based on diffusion effects. Using an efficient protocol for data acquisition and theoretical fits to a simple model we present estimates of novel parameters derived from R1ρ dispersion measurements that are in the range expected for microvasculature structure. Our in vivo results support the application of R1ρ dispersion at low locking fields in human studies. However, further validation such as ex vivo studies need to be performed.
INTRODUCTION:
The spin-lattice relaxation rate in the rotating frame, R1ρ, is sensitive to local field fluctuations of relatively low frequency. Spin lock measurements using an applied locking pulse have been used extensively to study relatively slow molecular motions. The value of R1ρ depends on the spin-locking field amplitude (FSL), which determines the degree to which transverse dephasing may be reversed. The measurement of the variation (or dispersion) of R1ρ with locking field allows the derivation of intrinsic tissue parameters. We have shown that R1ρ dispersion between 0 to ≈300 Hz (R1ρDiff) may be dominated by the effects of diffusion in intrinsic field gradients that arise in inhomogeneous biological tissues containing spatial variations of magnetic susceptibility.1,2 The magnitude and spatial extents of field gradients depend on the spacings and sizes of magnetic inhomogeneities, which in tissues may originate from the vasculature. Thus, R1ρ dispersion data at weak locking fields have the potential to reveal information on microvascular geometry and density.3,4 We have previously reported such effects in animal models and in vitro samples.2 Here we provide in vivo measurements of the variation of R1ρ with locking field in several organs in normal human subjects at 3T. Using an efficient protocol for data acquisition and theoretical fits to a simple model we present estimates of novel parameters derived from R1ρ dispersion measurements.MATERIALS & METHODS:
Theory of R1ρ dispersion at low FSL: The interpretation of R1ρDiff is based on an analytical relationship between the R1ρ dispersion and the rate of diffusion within spatially varying local field gradients. Diffusion exposes spins to slowly varying fields that cause irreversibly dephasing. Application of a locking field reduces this dephasing and so the transverse decay rate is also reduced. For random diffusion, R1ρDiff can be estimated using R1ρ=R2+(γ2g2D)/((q2D)2+ω12), where D is the self-diffusion coefficient, ω1 is the FSL and q is a spatial frequency that characterizes the gradient field distribution. Images acquired with different values of ω1 can be analyzed to derive q which is a direct measure of the sizes and spacings of the magnetic susceptibility inhomogeneities. For D=2.5x10⁻⁵ cm2/s, dispersion over the range of 23–363 Hz is expected for inhomogeneities of diameters 20–5 mm, respectively.MRI acquisition: 2D T1ρ weighted images were acquired using a 3T Ingenia-CX MRI scanner (Philips Healthcare) with a TSE readout following a 90x-τ/2y-180y-τ/2−y-90x pulse preparation and SENSE factor of 2. Healthy young female volunteers (age 24-34 years) were recruited to participate in this study. Images of calf muscle were collected with a knee coil, TR/TE = 3000/10 ms, a voxel size of 1x1x5 mm3 with 8 TSL; 2, 12, 22, 32, 43, 52, 62, and 72 ms resulting in a scan time of 300 sec for each FSL. Thigh muscle images were acquired with a flexible anterior coil, TR/TE=3000/10 ms and a voxel size of 1x1x8 mm3 with 4 TSL; 2, 12, 28, 64 ms resulting in a scan time of 130 sec for each FSL. Brain images were acquired with a 32-channel head coil, TR/TE=3000/10 ms, and a voxel size of 1x1x4 mm3 with 8 TSL; 2, 12, 22, 32, 42, 52, 62, 72 ms resulting in a scan time of 99 sec for each FSL. Abdomen images were acquired with a flexible anterior coil and a TFE readout, TR/TE=4.7/1.3 ms and a voxel size of 2x2x8 mm3 with 5 TSL; 2, 16, 32, 52, 75 ms resulting in a scan time of 45 sec for each FSL. For each scan a B0 map was calculated using images obtained with a TFE sequence at two different echo times. Auto and volume shimming were used in brain and body imaging, respectively.
RESULTS & DISCUSSION:
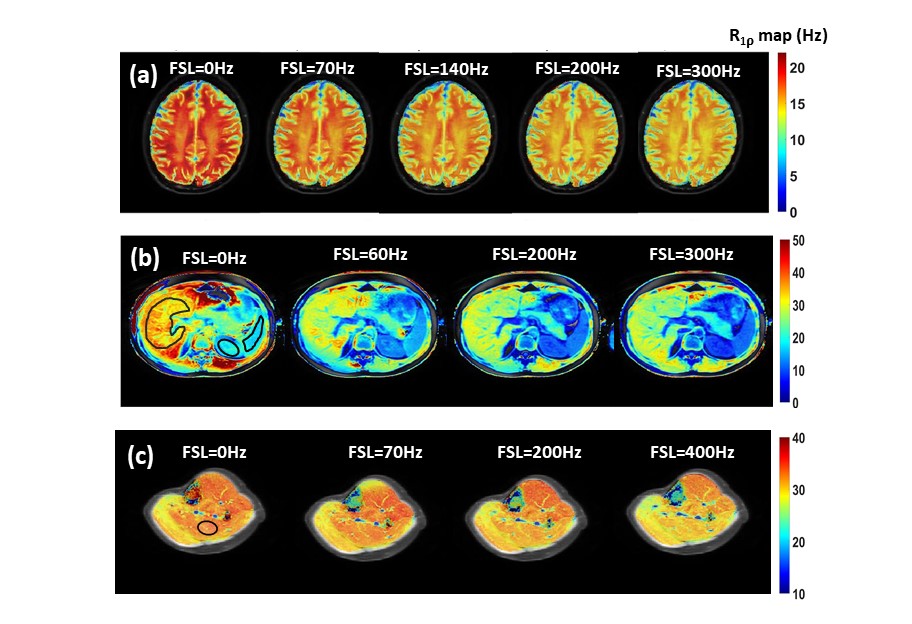
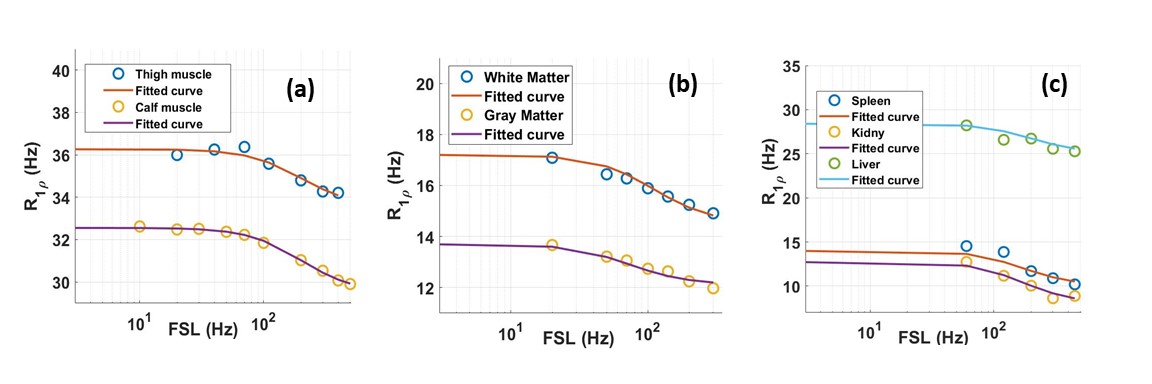
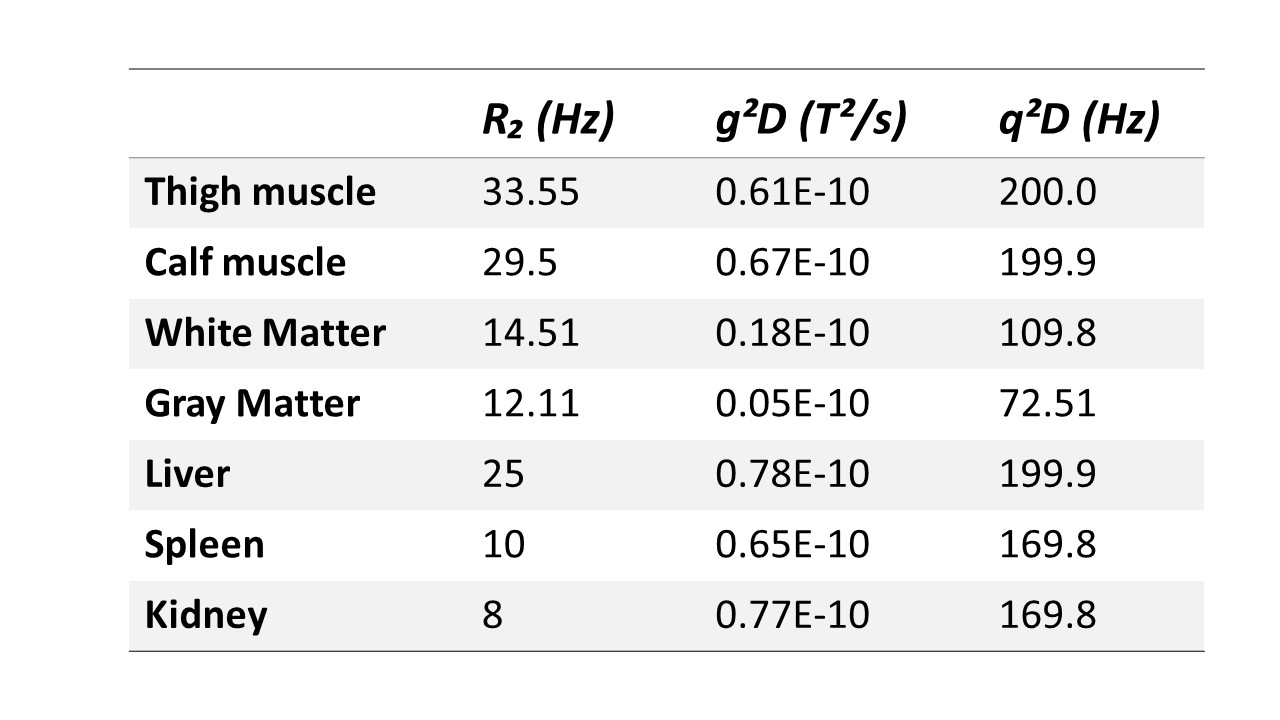
RESULTS & DISCUSSION: Fig.1 shows calculated R1ρ maps obtained in vivo. There is a slight decrease in R1ρ values at increasing spin locking fields as predicted. The quantitative R1ρ dispersion curves and the fitted curves from selected ROIs in different tissues are shown in Fig.2. Fitted parameters from dispersion curves depicted in Fig. 2 are listed in Table 1. R1ρ dispersions obtained from skeletal muscle reveal similar spatial frequency and magnetic gradient strength in calves and thighs. Assuming D=2x10⁻⁵ cm2/s, the derived length scale characterizing the intrinsic gradients is d≈10 μm which is close to the dimensions of microvasculature in skeletal muscle.5 R1p dispersion in brain was significantly different between white and gray matter. If we assume D = 2x10⁻⁵ cm2/s, then the values of the fitted parameters correspond to the microvessels are in the order of 5-15 microns, while the gradients correspond to susceptibility differences consistent with intravascular deoxyhemoglobin. The R1p values measured in liver, spleen, and kidney also show a dispersion at weak FSLs and the extracted parameters are in the range expected for microvasculature.CONCLUSION:
The in vivo results presented in this work demonstrate that R1ρ dispersion at low locking field amplitudes may be applied in human studies to derive new types of parametric image information based on diffusion effects including geometrical properties of the microvasculature such as microvascular sizes and spacings. However, because of the complexity and contribution of B0 and B1 inhomogeneities to the R1ρ dispersion, further validation such as ex vivo studies need to be performed.Acknowledgements
No acknowledgement found.References
1. Spear JT, Gore JC. New insights into rotating frame relaxation at high field. NMR Biomed. Sep 2016;29(9):1258-1273.
2. Adelnia F, Zu Z, Spear JT, et al. Tissue characterization using R1rho dispersion imaging at low locking fields. J Magn Reson Imaging. May 2021; 84:1-11.
3. Spear JT, Zu Z, Gore JC. Dispersion of relaxation rates in the rotating frame under the action of spin-locking pulses and diffusion in inhomogeneous magnetic fields. Magn Reson Med. May 2014;71(5):1906-1911.
4. Spear J, Gore J. Effects of diffusion in magnetically inhomogeneous media on rotating frame spin-lattice relaxation. J Magn Reson. 2014;249: 80–87.
5. Krogh A. The number and distribution of capillaries in muscles with calculations of the oxygen pressure head necessary for supplying the tissue. J Physiol. May 1919;52(6):409-415.
Figures