0174
Deep learning-based high-resolution pseudo-CT to detect cranial bone abnormalities for pediatric patients using MRI1Washington University in Saint Louis, Saint Louis, MO, United States
Synopsis
Head trauma is common in the pediatric population. Craniosynostosis is abnormal early fusion of a cranial suture, causing an irregular-shaped cranium.3D high-resolution head CT scans are commonly used in these pediatric patients to identify skull fractures and sutures. However, CT exposespediatric patients to ionizing radiationand increases risk of cancer. We developed a robust and automated deep learning method to convert MR images to pseudo-CT (pCT) that can facilitate translating MR cranial bone imaging into clinical practice. An average Dice Coefficient of 0.89 and mean absolute error of 72.45 HU between pCT and CT were achieved.
Introduction
Each year, 2.2 million pediatric head CT scans utilizing ionizing radiation are performed in the USA. Pediatric patients are more vulnerable to radiation exposure when compared to adults1-6 . Head trauma and craniosynostosis are two of the most common pediatric conditions requiring head CT scans, which provide 3D high-resolution pediatric cranial images7,8. MRI does not use ionizing radiation and can be a safe alternative to CT.“Black bone” MRI methods rely on a diminished bone signal in a standard gradient echo sequence to image the skull9,10.They have not been translated into clinical practice due subjective manual image post-processing methods. Emerging deep learning (DL) methods can incorporate multi-scale high-level abstract context information with potential to generate CT-like (pseudo-CT, pCT) images from MR images in a fully automated way. In this study, we demonstrated a promising MRIDL approachto achieve CT-equivalent 3D cranial bone images in using a golden-angle radial (GA) MR scan so 3D cranial bone images can be generated in a robust and fully automated way to facilitate translation to clinical use.Method
St. Louis Children's hospital pediatric patients under 18 years old diagnosed with head trauma or craniosynostosis were recruited for this study. The study population contained 24 patients with craniosynostosis and 18 patients with head trauma. Participants had standard head clinical CT scans and a research MR Golden Angle (GA) stack-of-stars scan with the following imaging parameters:224 slices, TE/TR = 2.47ms/4.84ms, Flip angle = 3°, BW = 410 Hz/pixel, FOV = 192 mm, Voxel size 0.6x0.6x0.8 mm, Number of radial spokes = 400, Total acquisition time = 5:04. A bias field correction was used to correct for spatial signal variations in MRI using N4iTK algorithm11. Each patient’s MRI was registered to their own CT image to match the spatial orientation and image resolution at 0.3x0.3x0.5 mm3using an FSL affine registration12. A level-set method was used to generate a mask to include only the head (cranial) region of the subject13. Block matching 3D (BM3D) filtering was applied to the CT images to perform edge preserved smoothing and enhance suture visualization14. Two different 3D patched-based ResUNet models were developed and combined to generate the pCT from MR images (Figure 1). Both ResUnet models were trained using 3D MR image patches with a size of 64×64×64. The central voxel determines the patch placement in the 3D volume15,16. The first model used patches selected randomly from the whole head. The whole head model utilized >one million partially overlapping 3D patches. Skull, sutures, and fractures are the objects of interest, but it only occupies a small fraction of the total imaging volume. These ROIs were rarely represented in ResUNet training in the whole head model. To address this issue, we enriched the representation of bone, suture, fractures, and air regions in the training sample patches. (Bone/Air Enriched Model)(Figure 1). To avoid overfitting and ensure a robust method, five-fold cross-validation was performed. Each time 70% of data was randomly selected for training(n=30), 10% for validation(n=4), and 20% for testing(n=8). The network weights evolved by reducing the L1 loss function error or mean absolute difference between the network output and ground truth CT image via the Adam optimizer.We computedthe mean absolute error (MAE) between pCT and CT. Moreover, we compared the DL-based pCT method to a manual processing method, commonly used in the existing Black Bone literature9,10,17 in bone segmentation using a DICE coefficient (DC).
Results
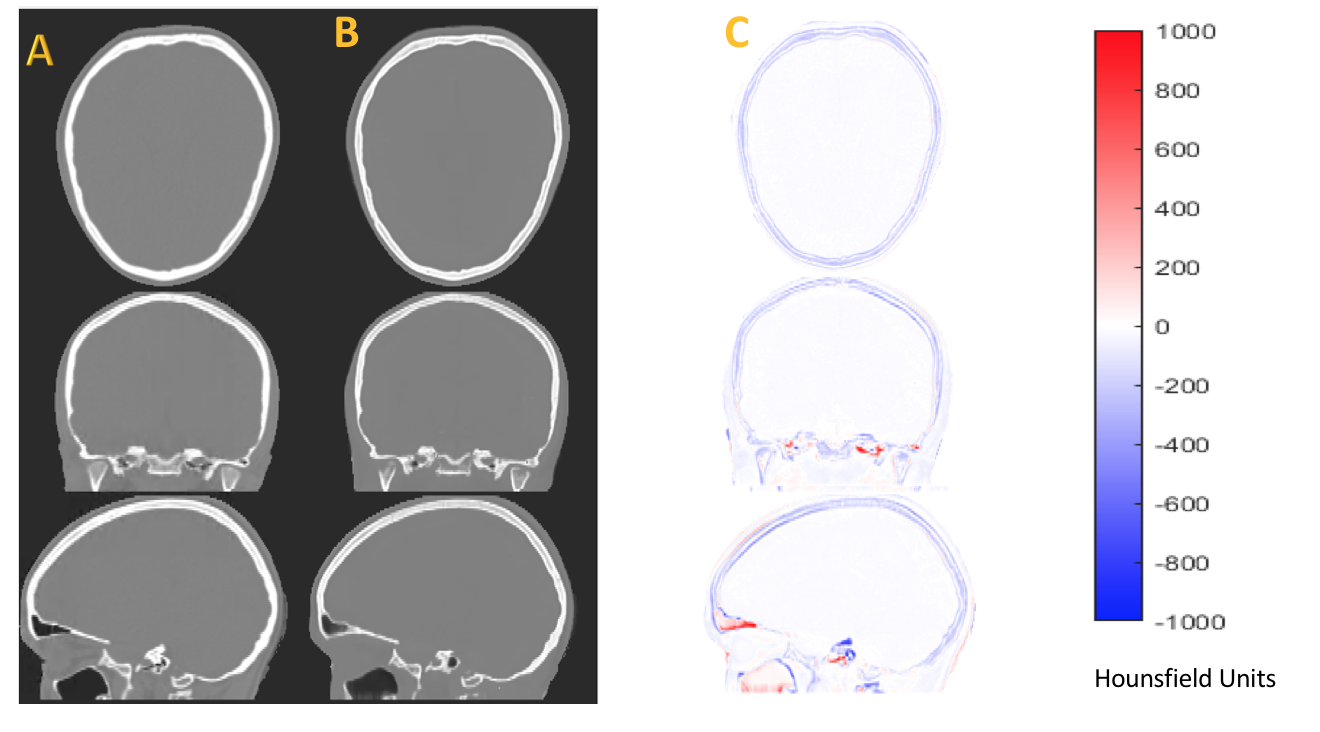
The MAE between pCT and CT was 72.35 ± 15.35 HU and the DC was 0.89 ± 0.02. The bone DC was 0.71 ± 0.09 from 42 patients using a manually determined participant-specific threshold for bone segmentation. Our DL method achieved a significantly higher DC than the manual processing scheme (p< 0.001). The box plots in Figure 2A show high inter-subject variability formanual Inverted MRI. pCT demonstrated high DC in bone segmentation across a wide range of age, while the manual processing method perform much worse in pediatric patients with young age (Figure 2B). MRI, pCT, and CT volumetric and 3D rendered images were generated for (1) a patient with open coronal and sagittal suture (Fig 3 Left), (2) craniosynostosis patient with only coronal suture (Fig 3 Right) and (3) trauma patient with the fracture marked in red circle (Figure 4). The pCT images closely resembled the ground truth CT (Figure 5). pCT has similar suture/fracture visualization compared to manual MR and CT.Discussion
We developed a robust and fully automated DL method to create pCT images from MR images for skull fractures and craniosynostosis diagnosis, which may facilitates translating MR cranial bone imaging into clinical practicefor pediatric patients.Our method demonstrates high DCs across a wide range of ages. However, pCT performs better in older pediatric patients than that in younger ones. Future work by including more young patients during the first years of life in the training may further improve pCT for young patients below 2 years old.Acknowledgements
No acknowledgement found.References
1. Dorfman AL, Fazel R, Einstein AJ, Applegate KE, Krumholz HM, Wang Y, Christodoulou E, Chen J, Sanchez R, Nallamothu BK. Use of medical imaging procedures with ionizing radiation in children: a population-based study. Arch Pediatr Adolesc Med. 2011;165(5):458-64. Epub 2011/01/05. doi: 10.1001/archpediatrics.2010.270. PubMed PMID: 21199972; PMCID: PMC3686496.
2. Miglioretti DL, Johnson E, Williams A, Greenlee RT, Weinmann S, Solberg LI, Feigelson HS, Roblin D, Flynn MJ, Vanneman N, Smith-Bindman R. The use of computed tomography in pediatrics and the associated radiation exposure and estimated cancer risk. JAMA Pediatr. 2013;167(8):700-7. Epub 2013/06/12. doi: 10.1001/jamapediatrics.2013.311. PubMed PMID: 23754213; PMCID: PMC3936795.
3. Brenner DJ, Elliston CD, Hall EJ, Berdon WE. Estimates of the cancer risks from pediatric CT radiation are not merely theoretical: comment on "point/counterpoint: in x-ray computed tomography, technique factors should be selected appropriate to patient size. against the proposition". Med Phys. 2001;28(11):2387-8. PubMed PMID: 11764047.
4. Parker L. Computed tomography scanning in children: radiation risks. Pediatr Hematol Oncol. 2001;18(5):307-8. doi: 10.1080/088800101300312564. PubMed PMID: 11452401.
5. Pearce MS, Salotti JA, Little MP, McHugh K, Lee C, Kim KP, Howe NL, Ronckers CM, Rajaraman P, Sir Craft AW, Parker L, Berrington de Gonzalez A. Radiation exposure from CT scans in childhood and subsequent risk of leukaemia and brain tumours: a retrospective cohort study. Lancet. 2012;380(9840):499-505. doi: 10.1016/S0140-6736(12)60815-0. PubMed PMID: 22681860; PMCID: 3418594.
6. Smyth MD, Narayan P, Tubbs RS, Leonard JR, Park TS, Loukas M, Grabb PA. Cumulative diagnostic radiation exposure in children with ventriculoperitoneal shunts: a review. Childs Nerv Syst. 2008;24(4):493-7. doi: 10.1007/s00381-007-0560-x. PubMed PMID: 18180935.
7. Schneier AJ, Shields BJ, Hostetler SG, Xiang H, Smith GA. Incidence of pediatric traumatic brain injury and associated hospital resource utilization in the United States. Pediatrics 2006; 118(2): 483-92.
8. French LR, Jackson IT, Melton LJ, 3rd. A population-based study of craniosynostosis. J Clin Epidemiol 1990; 43(1): 69-73.
9. Eley KA, McIntyre AG, Watt-Smith SR, Golding SJ. "Black bone" MRI: a partial flip angle technique for radiation reduction in craniofacial imaging. Br J Radiol 2012; 85(1011): 272-8.
10. Kralik SF, Supakul N, Wu IC, et al. Black bone MRI with 3D reconstruction for the detection of skull fractures in children with suspected abusive head trauma. Neuroradiology 2019; 61(1): 81-7.
11. Tustison NJ, Avants BB, Cook PA, Zheng Y, Egan A, Yushkevich PA, Gee JC. N4ITK: improved N3 bias correction. IEEE Trans Med Imaging. 2010;29(6):1310-20. doi: 10.1109/TMI.2010.2046908. PubMed PMID: 20378467; PMCID: PMC3071855.
12. Jenkinson M, Bannister P, Brady M, Smith S. Improved optimization for the robust and accurate linear registration and motion correction of brain images. Neuroimage. 2002;17(2):825-41. PubMed PMID: 12377157.
13. Vese LA, Chan TF. A multiphase level set framework for image segmentation using the Mumford and Shah model. Int J Comput Vision. 2002;50(3):271-93. doi: Doi 10.1023/A:1020874308076. PubMed PMID: WOS:000178816700004.
14. Dabov Kostadi, Foi, Alessandro; Katkovnik, Vladimir; Egiazarian, Karen. Image denoising by sparse 3D transform-domain collaborative filtering. IEEE Transactions on Image Processing. 16 July 2007. 16 (8): 2080–2095
15.Chen Y, Ying C, Binkley MM, Juttukonda MR, Flores S, Laforest R, Benzinger TLS, An H. Deep learning-based T1-enhanced selection of linear attenuation coefficients (DL-TESLA) for PET/MR attenuation correction in dementia neuroimaging. Magnetic resonance in medicine. 2021;86(1):499-513. Epub 2021/02/10. doi: 10.1002/mrm.28689. PubMed PMID: 33559218.
16. He K, Zhang X, Ren S, Sun J. Deep Residual Learning for Image Recognition. IEEE Computer Vision and Pattern Recognition (CVPR)2016. p. 770-8.
17. Patel KB, Eldeniz C, Skolnick GB, Jammalamadaka U, Commean PK, Goyal MS, Smyth MD, An H. 3D pediatric cranial bone imaging using high-resolution MRI for visualizing cranial sutures: a pilot study. J Neurosurg Pediatr. 2020 Jun 12:1-7. doi: 10.3171/2020.4.PEDS20131. Epub ahead of print. PMID: 32534502; PMCID: PMC7736460.
Figures
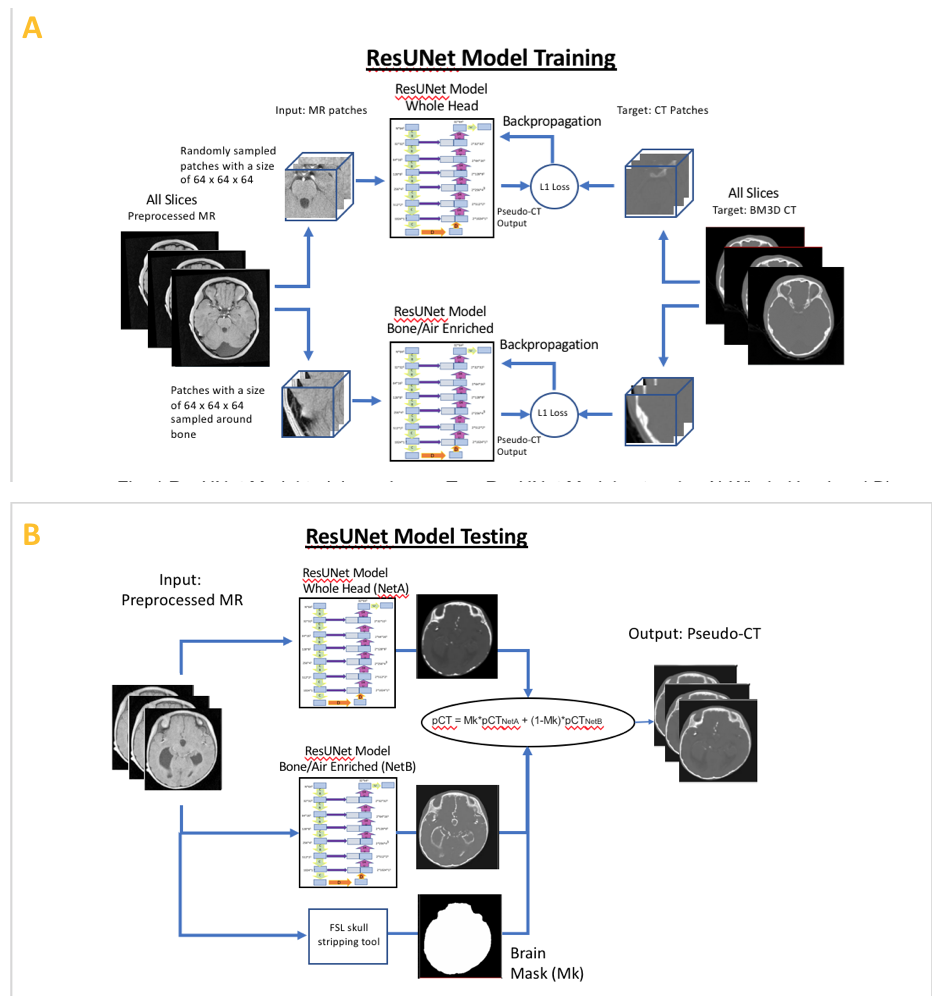
Fig. 1A ResUNet Model training scheme. Two ResUNet Model networks: A) Whole Head and B) Bone/Air Enriched were trained. For A, the patches were randomly selected from the whole head. For B, the center voxels for each patch was placed in within the bone region
Fig. 1B ResUNet Model testing scheme. The final pCT output was created by combining the pCT from the two networks. The whole head network pCTNetA output was multiplied by brain mask and the bone enhanced network pCTNetB output was multiplied by one minus the brain mask. The results of both multiplications were added for the final pCT output
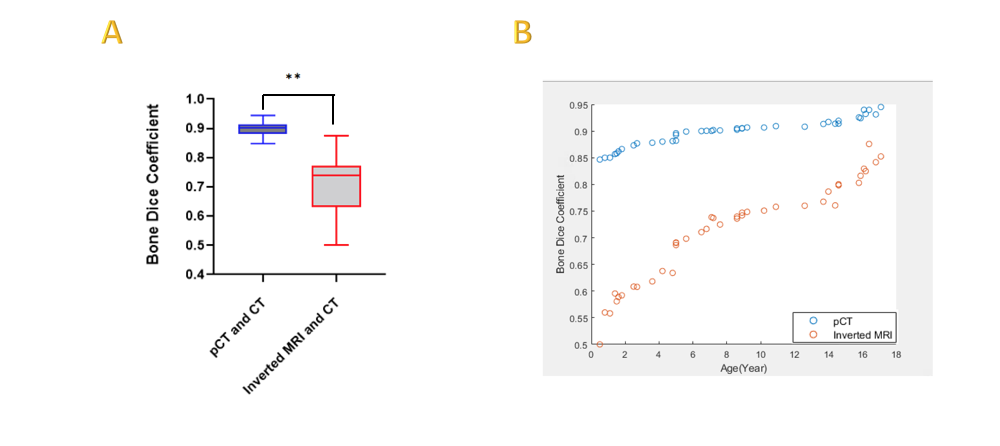
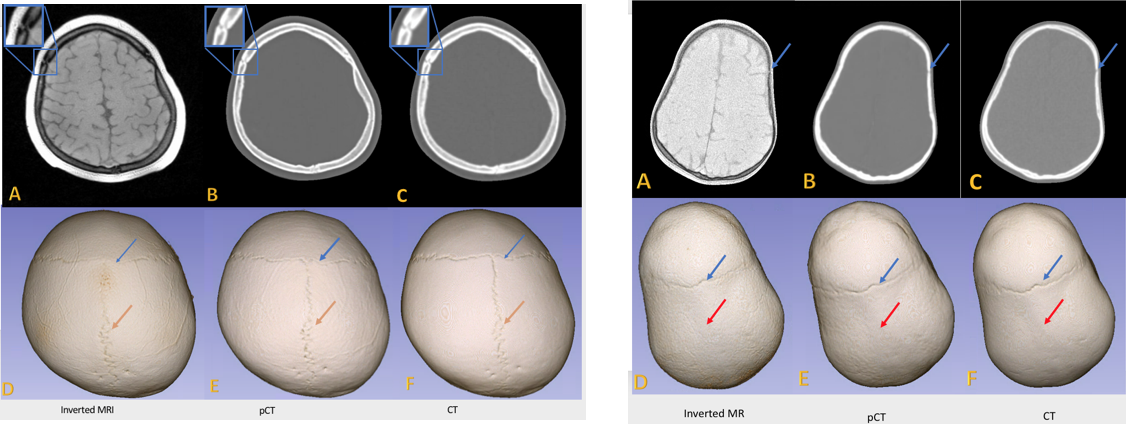
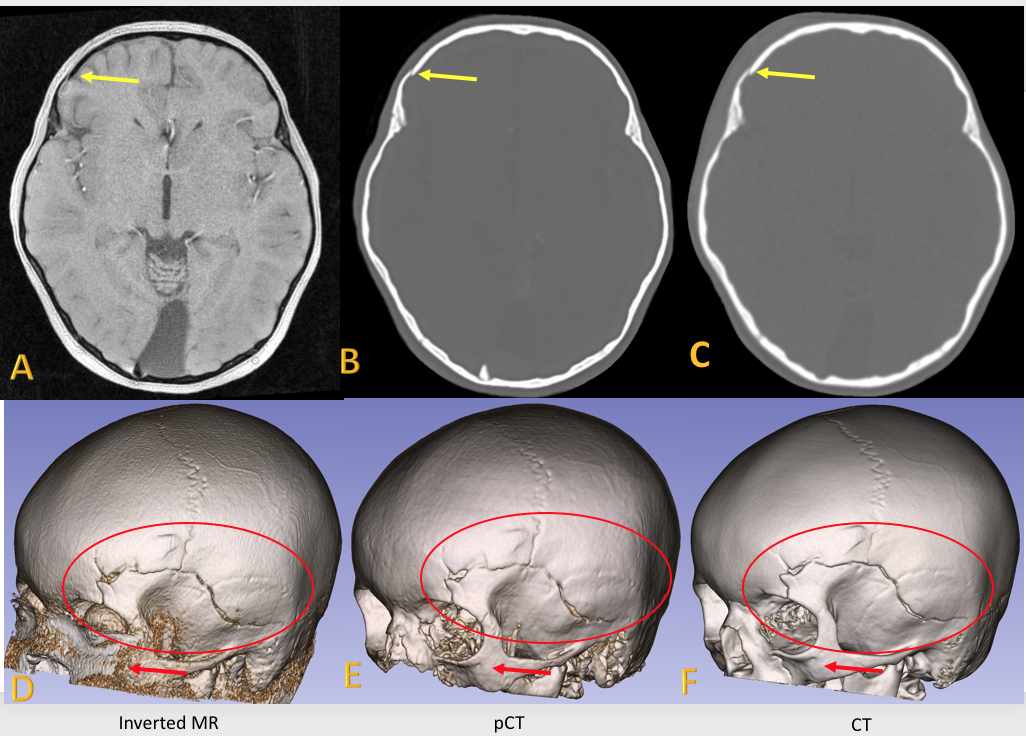
Fig 3 Left :Images from a patient (14 years old, female) (suture line marked in blue circle.The blue and orange arrows indicate the presence of the coronal and the sagittal sutures, respectively. ). Fig 3 Right: Images from a craniosynostosis patient (1.8 years old, female) (suture lines marked by blue arrows. The blue arrows indicate the presence of the coronal suture, and the red arrows indicate the absence of sagittal suture. )
Fig 3 Left and right shows Inverted MR images (A), pCT (B), and ground truth CT (C). The 3D rendered cranial bone images from MR (D), pCT (E) and ground truth CT (F).