0166
Comparing population Receptive Field mapping using VASO-CBV and BOLD1Spinoza Centre for Neuroimaging, Amsterdam, Netherlands, 2Experimental and Applied Psychology, VU University, Amsterdam, Netherlands, 3Radiology, University Medical Centre Utrecht, Utrecht, Netherlands, 4Experimental Psychology, Helmholtz Institute, Utrecht University, Utrecht, Netherlands
Synopsis
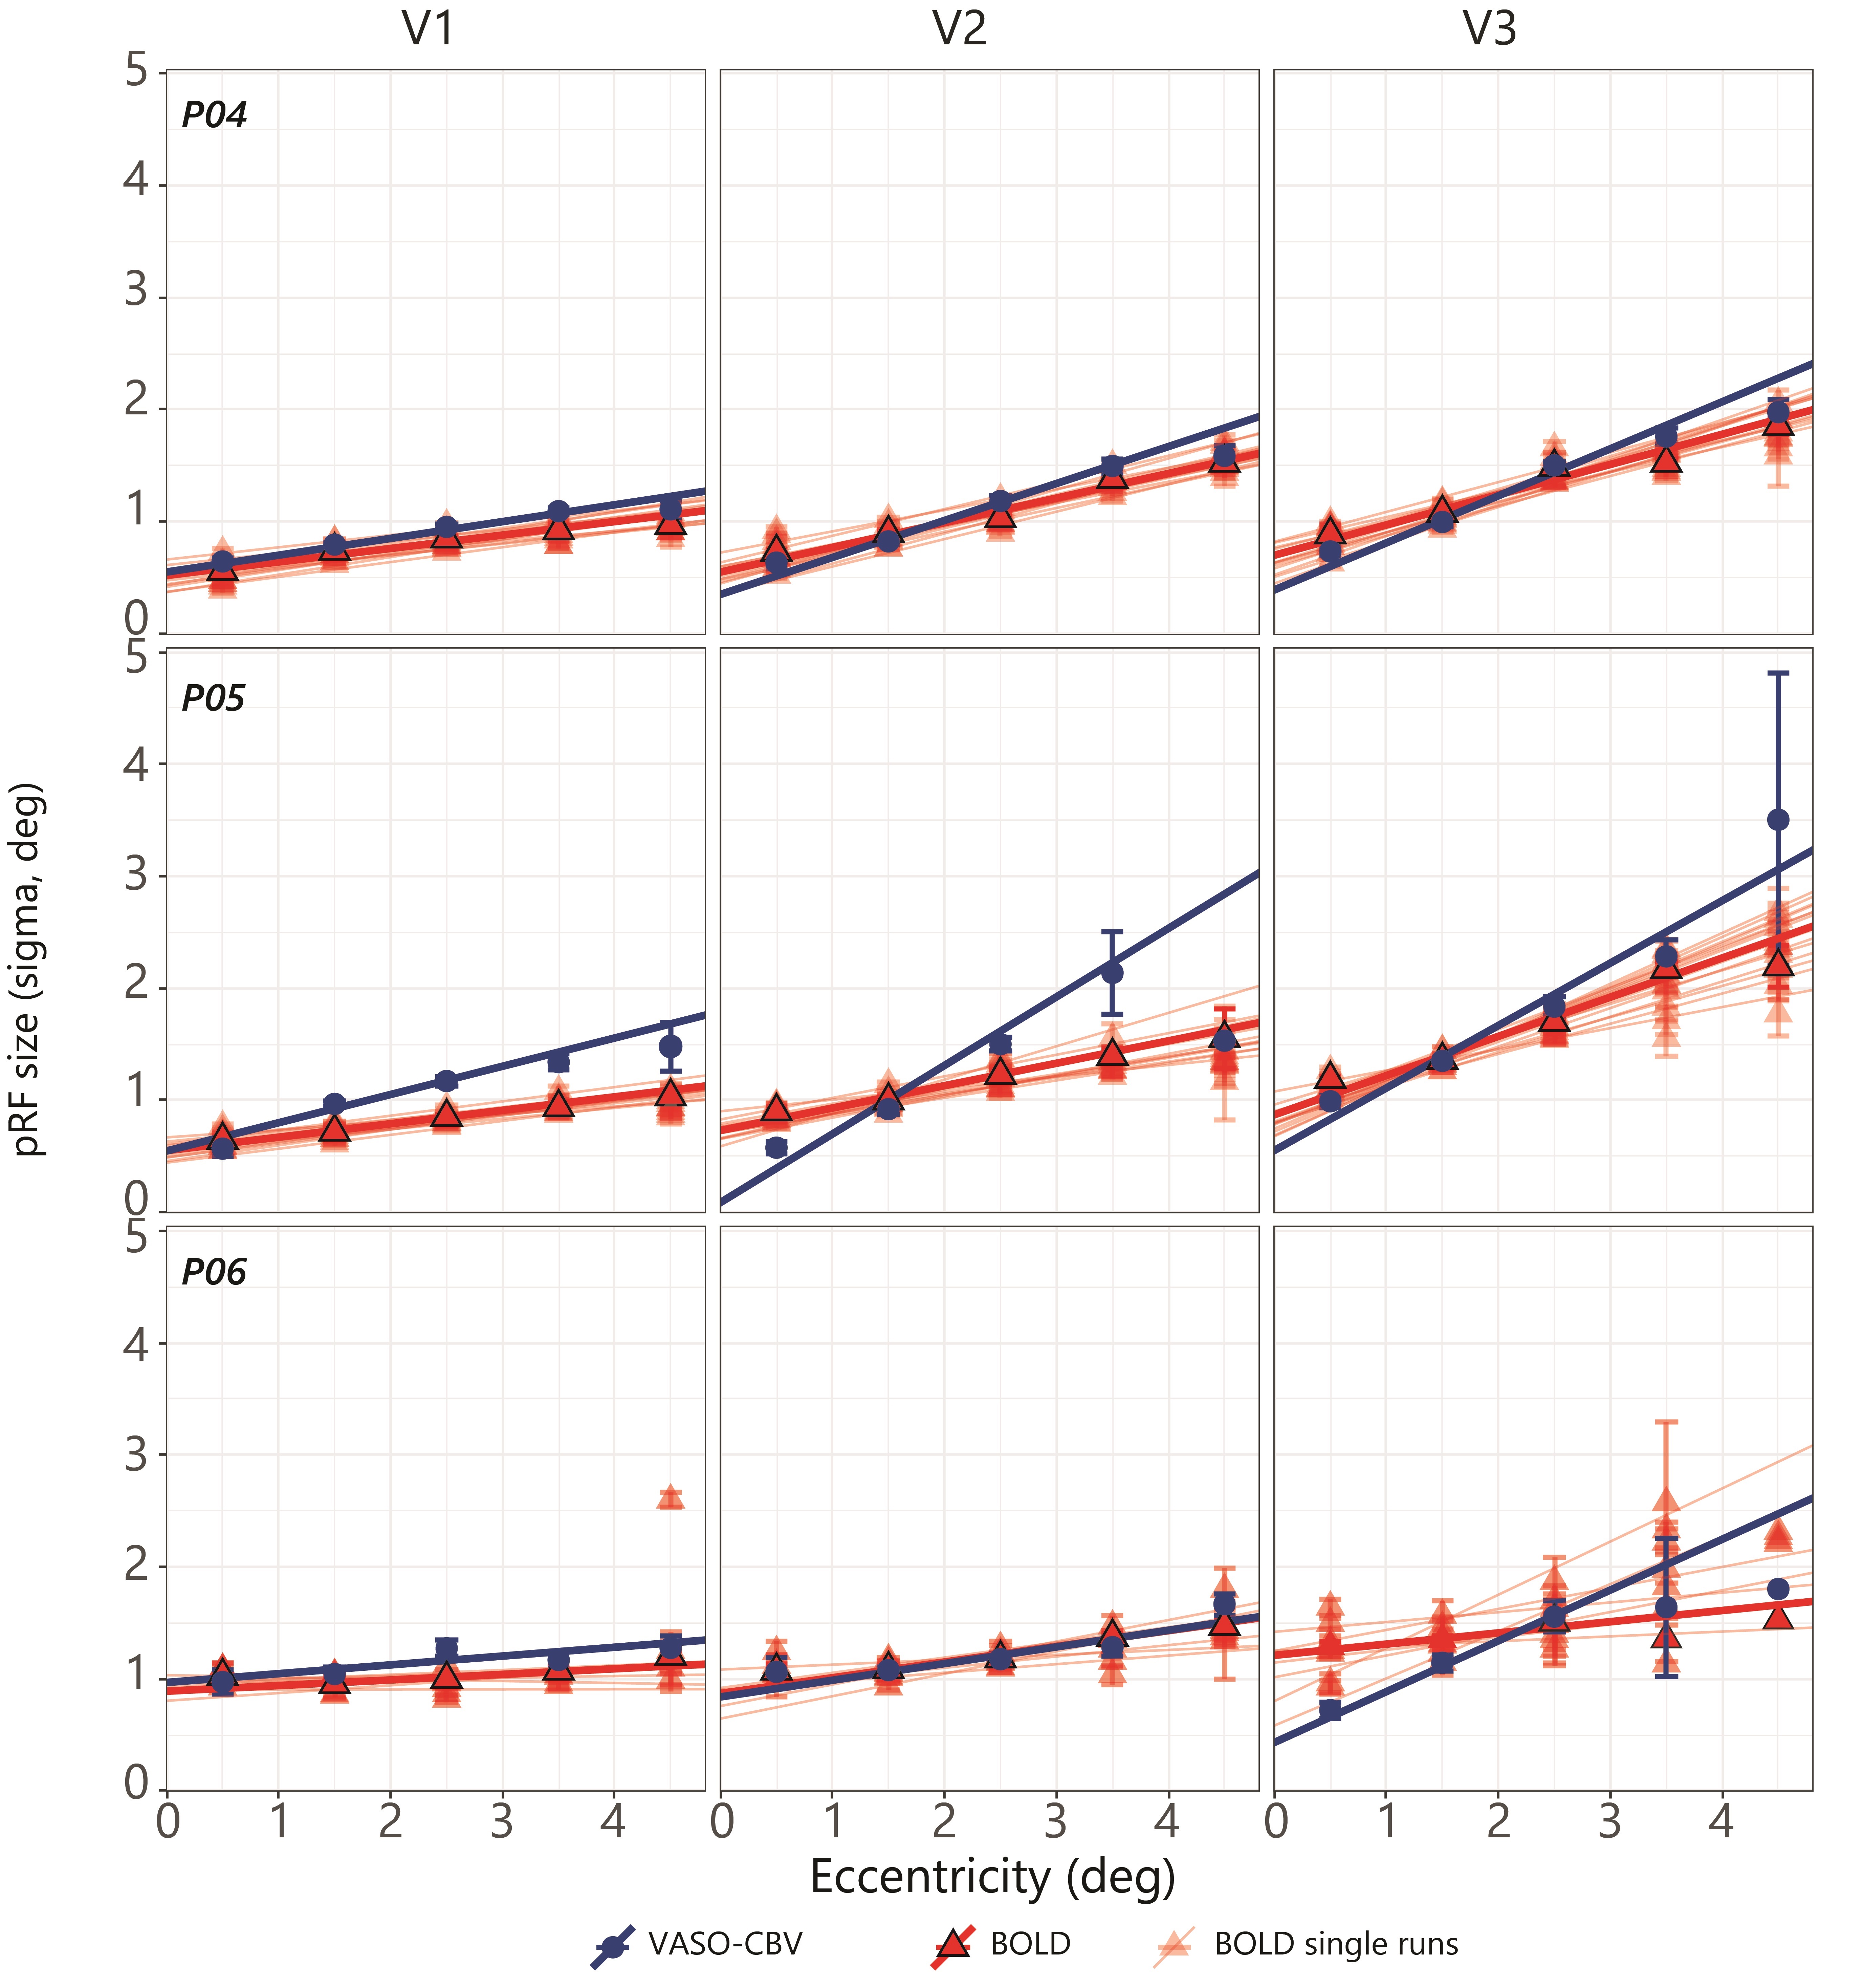
We extended the use of VASO-CBV to pRF mapping modeling. We show that VASO-CBV data can be used reliably to map polar angle and eccentricity, similar to BOLD-based data. In addition, the pRF size increased systematically from V1 to V3 similarly for BOLD and VASO-CBV estimates. The higher microvascular specificity of VASO-CBV did not result in smaller pRF size estimates. This result suggests that the vascular contribution to the pRF size is not dominant in either VASO-CBV or BOLD-based pRF mapping.
Introduction
The 7T VASO-CBV method has proven to be highly effective for high-resolution fMRI, especially for depth-dependent applications1-5. However, the feasibility of using VASO-CBV for advanced cognitive neuroimaging applications has not yet been widely evaluated. We evaluated the feasibility of VASO-CBV in the visual cortex using population receptive field (pRF) modeling7. The pRF analysis is a popular method to study the topographic organization of primary sensory neural populations8. Since pRF size has both vascular and neuronal contributions, we hypothesize that the higher specificity of VASO-CBV would result in smaller pRF sizes than BOLD. In the present study, we first determined the optimal slice orientation for VASO-CBV in the visual cortex. With the optimized slice orientation, we extended the use of VASO-CBV to the pRF modeling.Methods
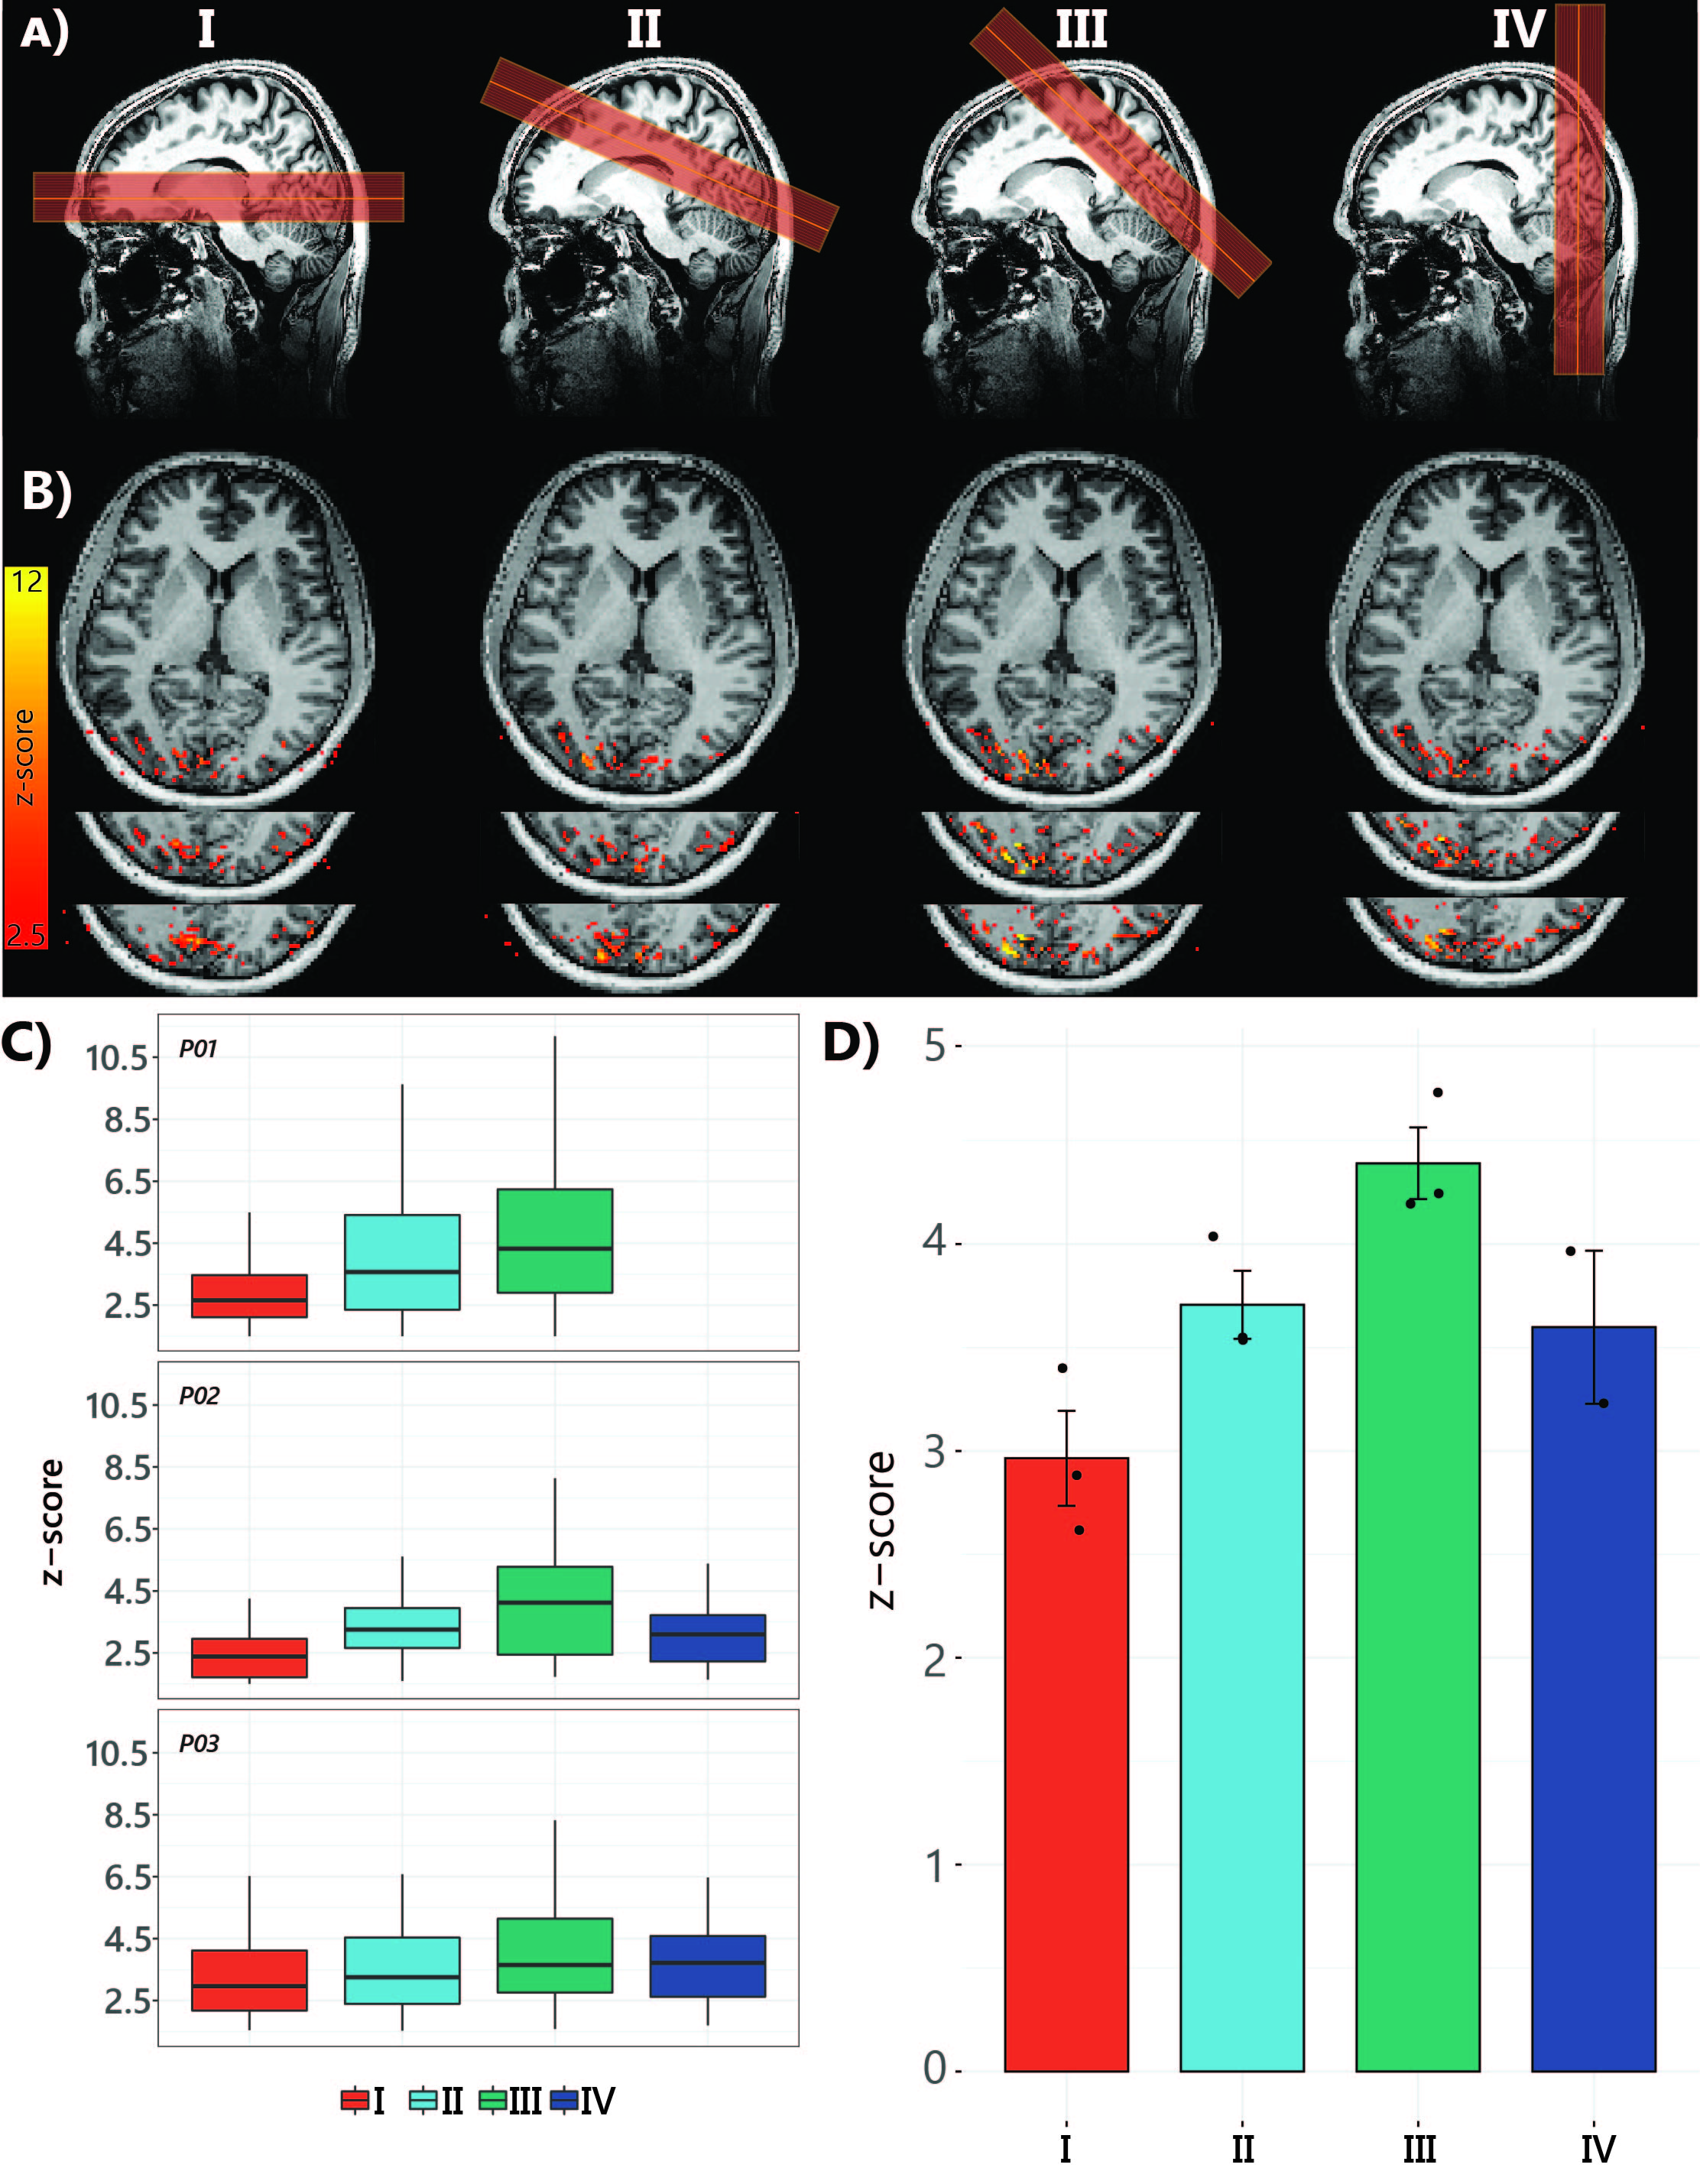
Six healthy volunteers (5 females, age 32±7 years) participated in the study. Imaging was performed on a 7T scanner (Philips) using a 32Rx8Tx (Nova Medical). SS-SI VASO data were recorded using a 3D EPI readout [TI1/TI2/TE/TRSS-SIVASO = 1100/2600/15/3000ms]. Voxel-size 1.75mm isotropic (FOV=196x196x32mm3, matrix=112x112, 18 slices). PF=0.78, fat-suppression-SPAIR. The protocol optimization was necessary since the slab positioning can affect the amount of inflow and, therefore, tissue signal. We compared four different orientations of the slab together with a change in the direction of the readout gradient. The slice orientation that yielded the highest level of activation represented by the highest average Z-score was the one used in the subsequent pRF experiments (Fig1).Stimuli: We used a flickering checkerboard stimulus with 24s on/off blocks, with an extra 12 seconds of fixation at the start for the slice orientation comparison. The pRF paradigm consisted of sweeping bar apertures at four orientations (0°, 45°, 90°, and 135°) with two different motion directions for each orientation.
In both experiments, motion correction was performed separately for BOLD and VASO, followed by the BOLD contamination correction6. We used z-scores from GLM analysis (FEAT in FSL, v.6.0) to assess the optimization slice orientation. We estimated the pRF position and sizes using the conventional Gaussian pRF model7 with an additional HRF fit step9 using vistasoft10. The pRF analysis was limited to those voxels with a p-value<0.05 in the VASO data. The comparison was performed between each BOLD run separately against the averaged VASO (14 runs) to maintain a similar variance explained. A one-way Bayesian ANOVA was used to assess the statistical differences. We used Temporal SNR and variance explained as a function of the number of runs to assess the noise level. The tSNR was calculated across cumulatively averaged runs for GM and WM. The variance explained was estimated per voxel by computing the variance after fitting the BOLD and VASO-CBV time series separately with the model prediction of a given voxel.
Results
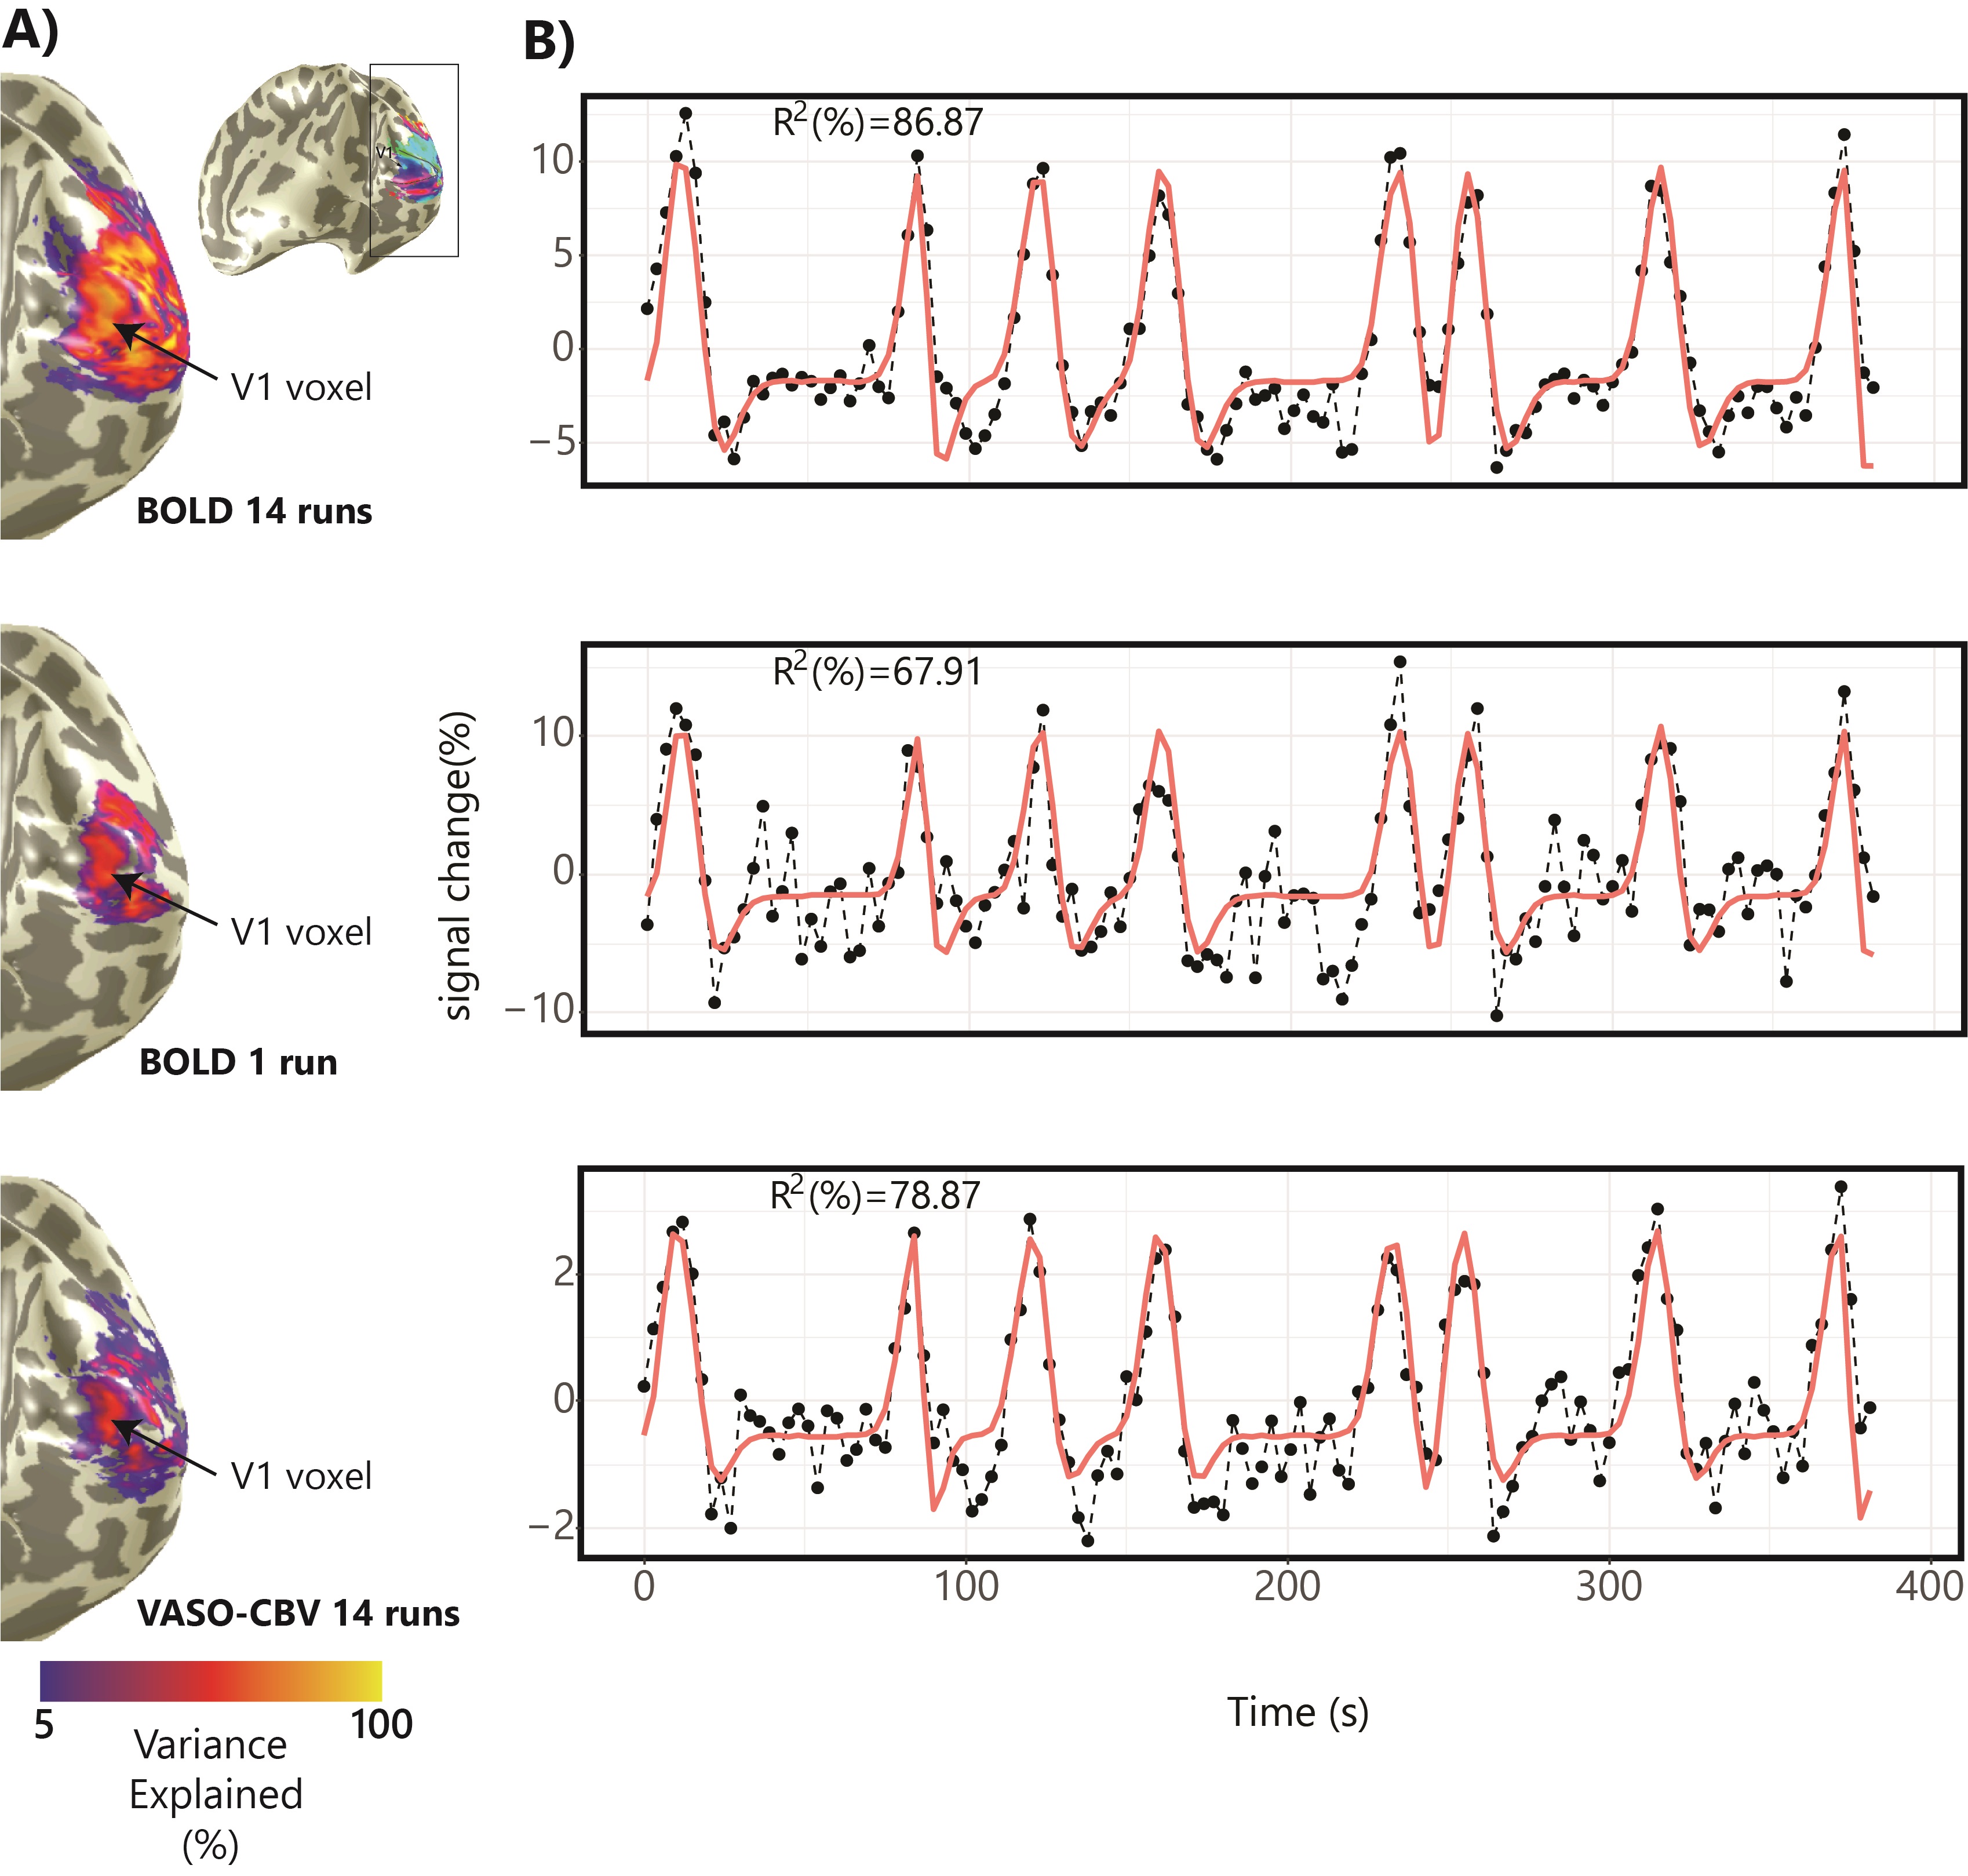
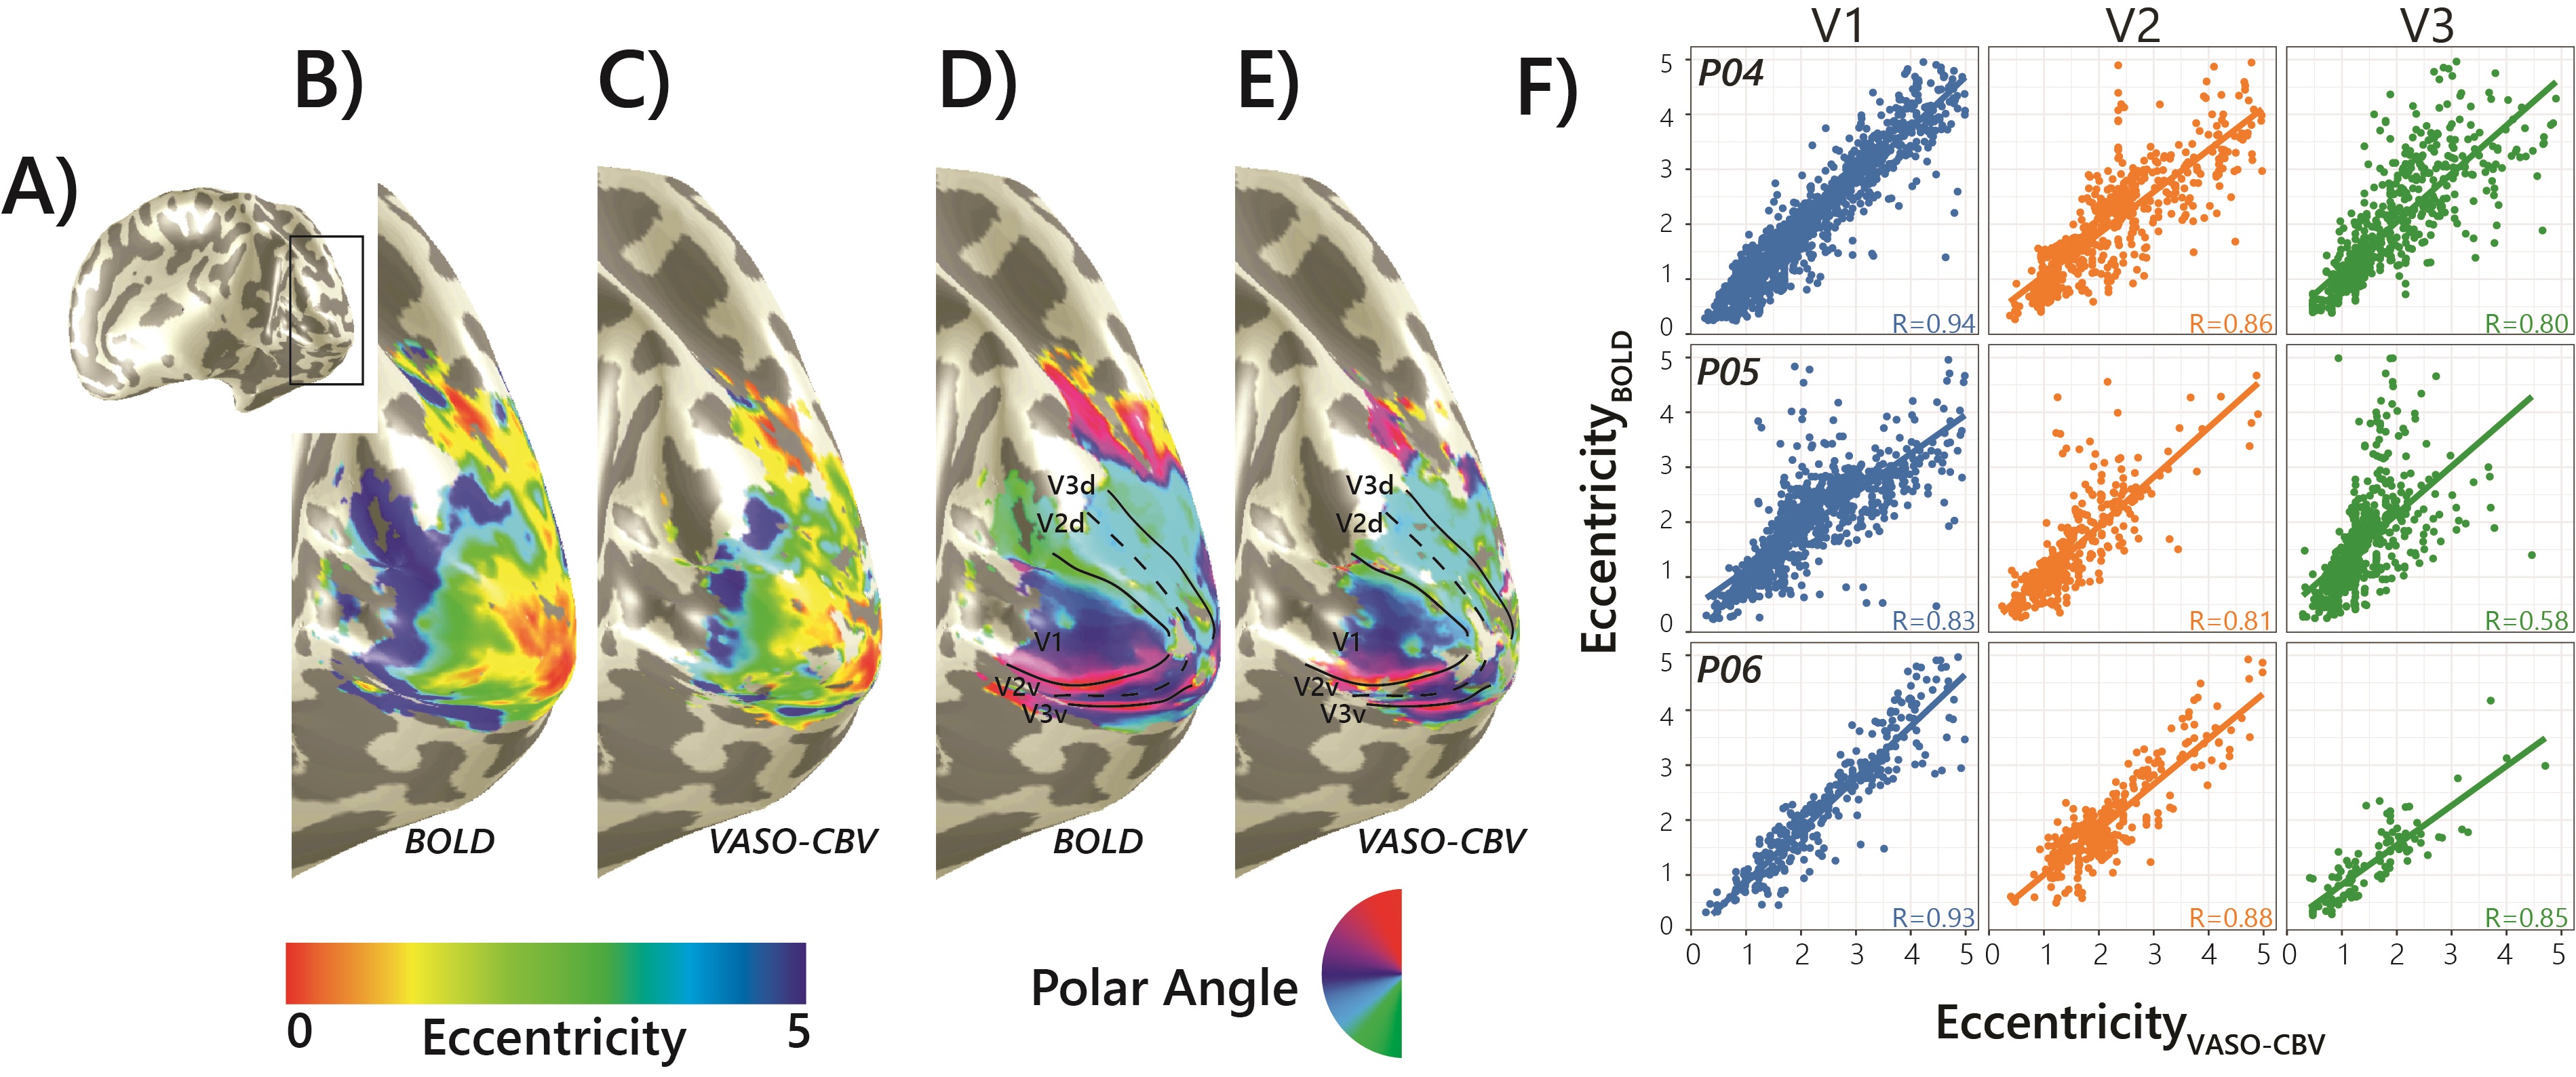
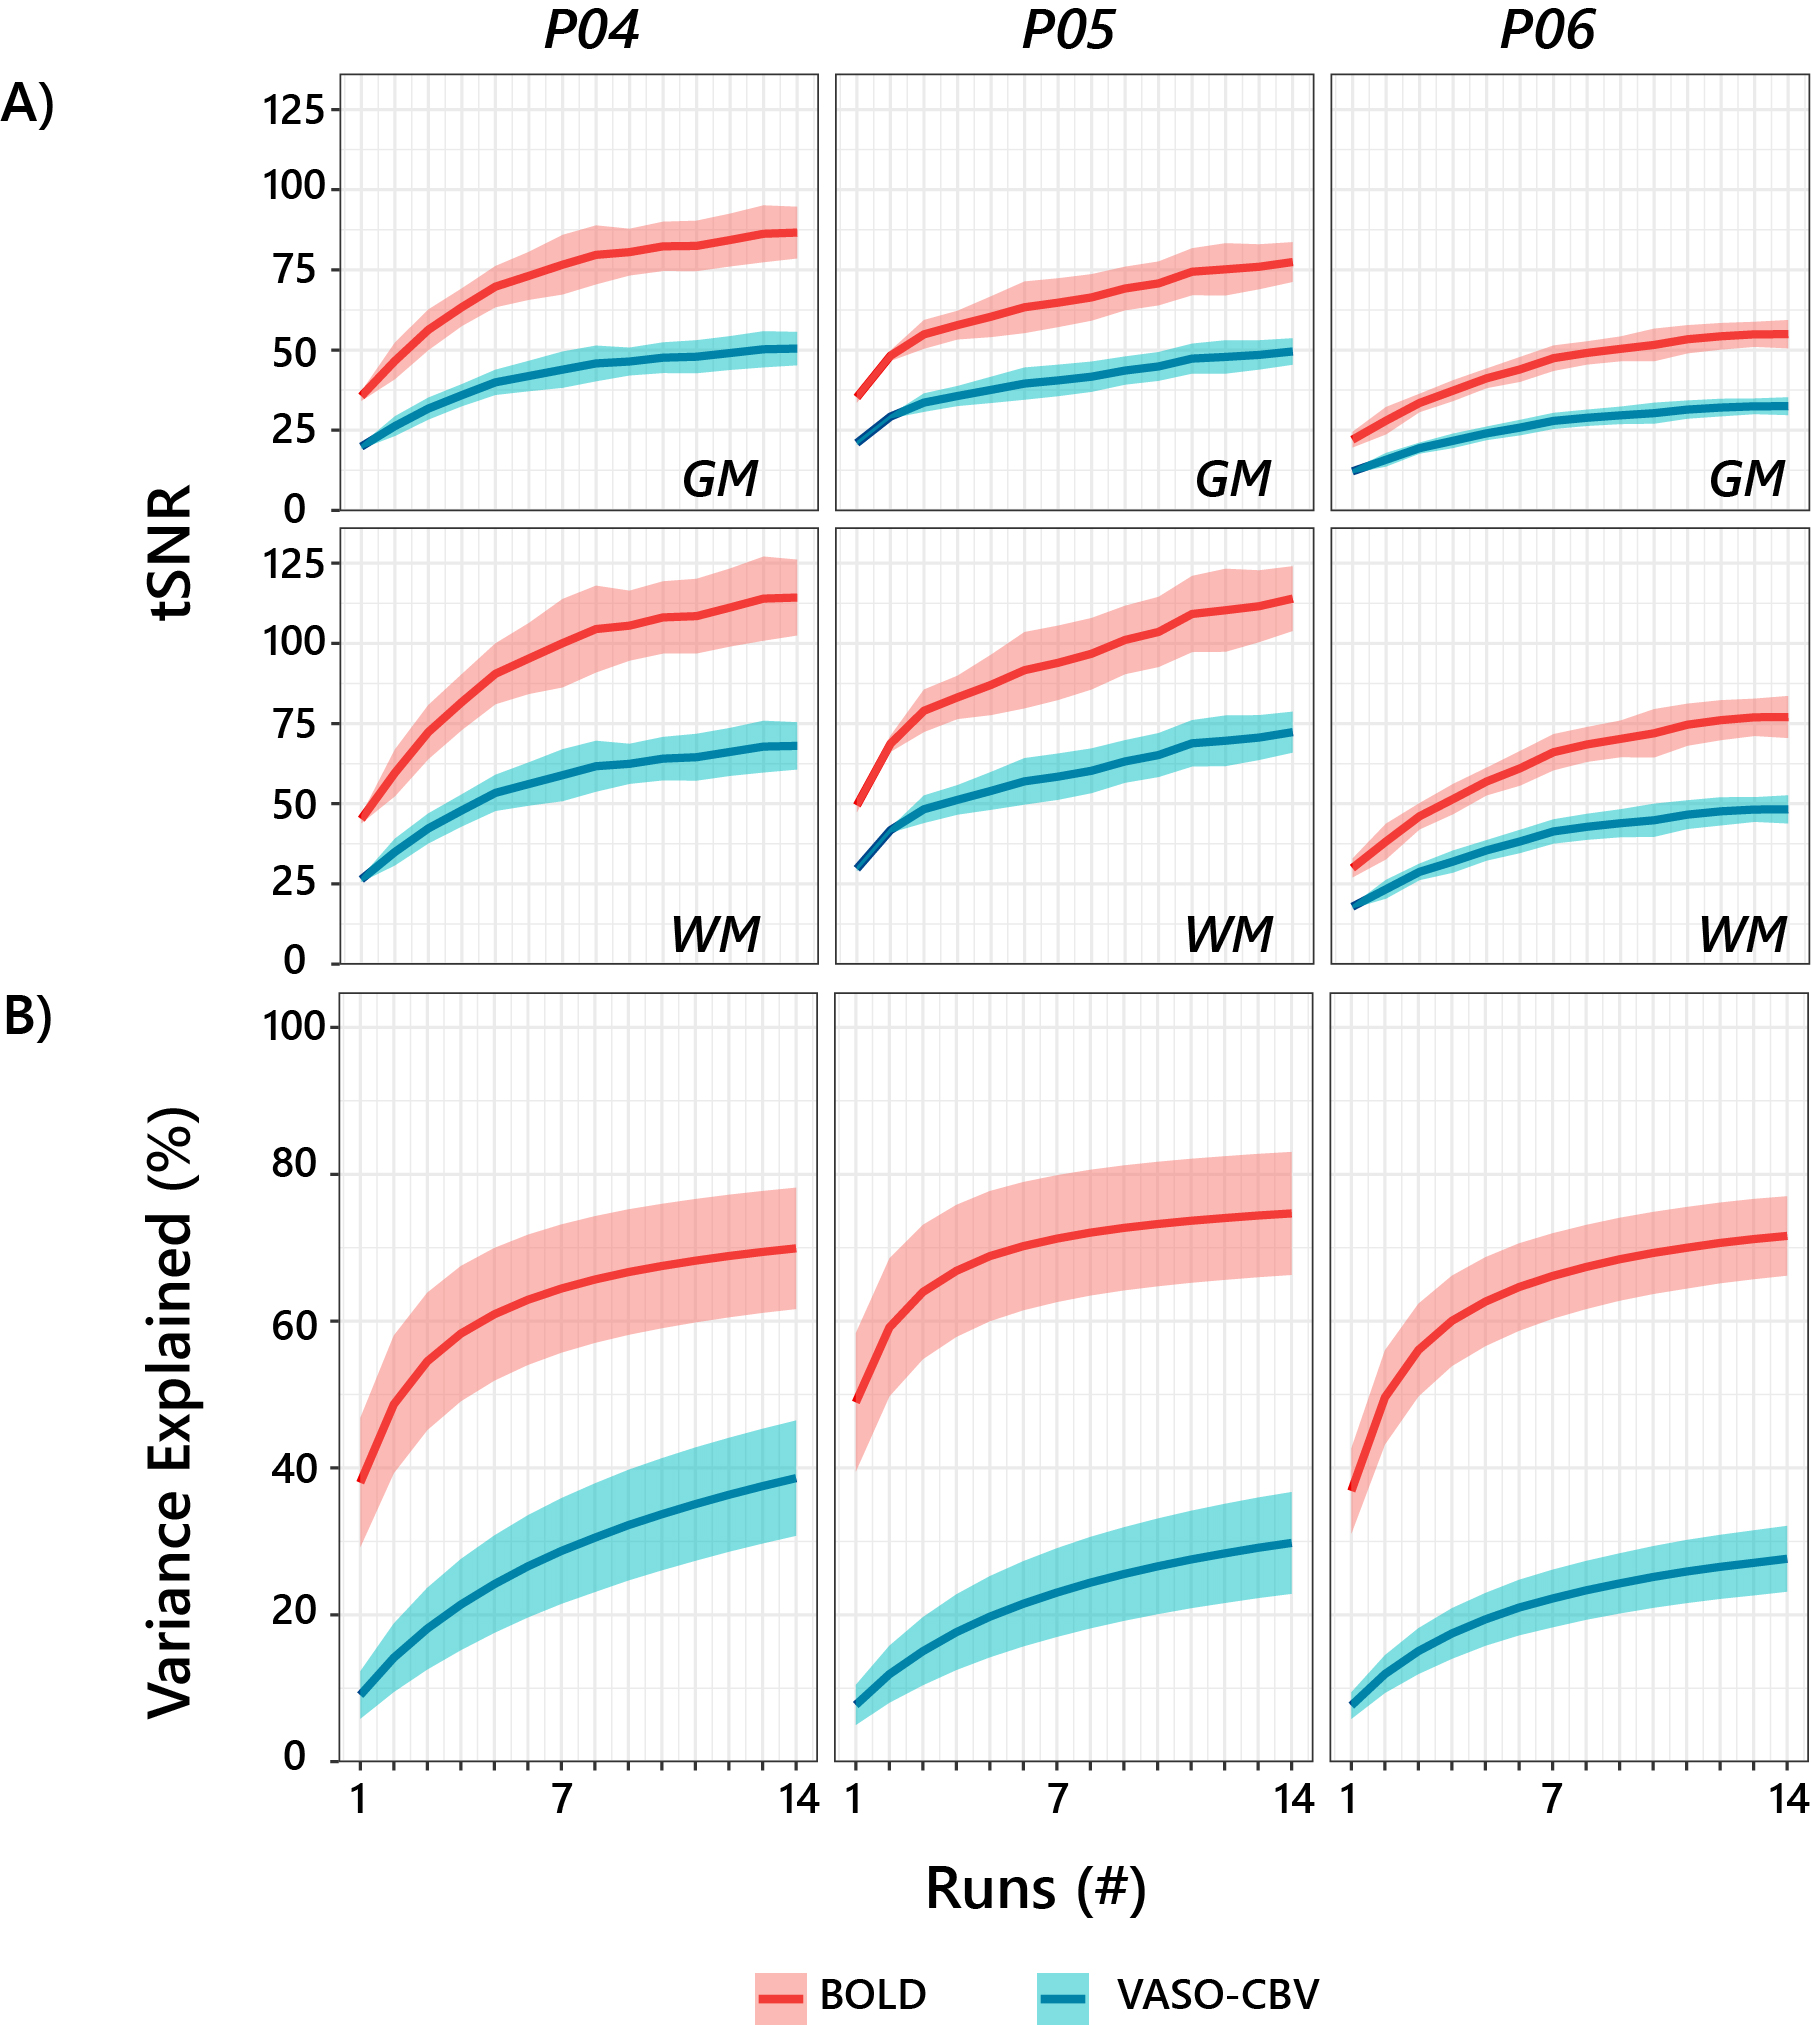
Fig.1.B shows VASO-CBV activated voxels within the shared volume of all orientations, overlaid on the anatomical data. Orientation III showed higher responses than all other orientations (ANOVA, p-value<0.05). Fig.2 shows the fMRI signal quality captured by the pRF model depicted in R2 maps and time courses. The 14-run averaged BOLD shows more high R2 voxels compared to 14-run VASO-CBV and single-run BOLD. We found similar eccentricity and polar angle maps for VASO-CBV and BOLD (Fig3), with a tight relationship for the eccentricity. Regarding the noise level, the tSNR increases with the number of runs for all regions and participants, although with higher values for BOLD than VASO-CBV (Fig4). The R2 curves also show the same pattern, increasing with the number of runs, with higher values for BOLD than VASO-CBV. The pRF size increases with the eccentricity for both VASO-CBV and BOLD similarly (Fig5). In the Bayesian framework, we define the alternative hypothesis as the difference between VASO-CBV pRF sizes and the individual BOLD run pRF sizes. The Bayesian ANOVA indicated weak evidence in V1 (BF10=2.687). And no evidence in V2 (BF10=1.044) and V3 (BF10=0.477).Discussion & Conclusion
We observed a robust VASO-CBV activation pattern for all orientations and no inflow artifacts in any orientation planes. The tSNR curves (Fig4A) reveal that, in general, a single BOLD run is equivalent to 4-5 averages runs of VASO-CBV. Although in different ratios, the R2-curves increase with runs, with BOLD reaching a plateau earlier than VASO-CBV. Therefore, we compared the 14-VASO-CBV with individual BOLD runs. All pRF properties (Polar angle, eccentricity, and pRF size) measured with VASO-CBV showed similar behavior compared to BOLD. The expected higher microvascular specificity of VASO-CBV does not directly result in smaller pRF size estimates. The pRF size depends on a combination of two types of signal components; neural and non-neural7. Neural includes the position scatter. Since the comparison was performed in the same cortical location, the position scatter is not expected to differ in VASO-CBV compared to BOLD. We also exclude eye and head motion as potential explanations since VASO-CBV and BOLD are nearly simultaneously acquired. The high SNR case of 14-run average BOLD shows no difference in observed pRF size. We, therefore, do not think that SNR was a factor of influence. Together, these results suggest that the vascular component of the pRF size is not dominant in either VASO-CBV or BOLD.Acknowledgements
No acknowledgement found.References
[1]. Beckett, A.J.S., Dadakova, T., Townsend, J., Huber, L., Park, S., Feinberg, D.A., 2020. Comparison of BOLD and CBV using 3D EPI and 3D GRASE for cortical layer functional MRI at 7 T. Magn. Reson. Med. mrm.28347.
[2]. Beckett, A.J.S., Dadakova, T., Townsend, J., Huber, L., Park, S., Feinberg, D.A., 2020. Comparison of BOLD and CBV using 3D EPI and 3D GRASE for cortical layer functional MRI at 7 T. Magn. Reson. Med. mrm.28347.
[3]. Huber, L., Handwerker, D.A., Jangraw, D.C., Chen, G., Hall, A., Stüber, C., Gonzalez-Castillo, J., Ivanov, D., Marrett, S., Guidi, M., Goense, J.B.M., Poser, B.A., Bandettini, P.A., 2017. High-resolution CBV-fMRI allows mapping of laminar activity and connectivity of cortical input and output in human M1. Neuron 1–11.
[4]. Persichetti, A.S., Avery, J.A., Huber, L., Merriam, E.P., Martin, A., 2019. Layer-Specific Contributions to Imagined and Executed Hand Movements in Human Primary Motor Cortex. SSRN Electron. J. 1–5.
[5]. Yu, Y., Huber, L., Yang, J., Jangraw, D.C., Handwerker, D.A., Molfese, P.J., Chen, G., Ejima, Y., Wu, J., Bandettini, P.A., 2019. Layer-specific activation of sensory input and predictive feedback in the human primary somatosensory cortex. Sci. Adv. 5, eaav9053.
[6]. Huber, L., Ivanov, D., Krieger, S.N., Streicher, M.N., Mildner, T., Poser, B.A., Möller, H.E., Turner, R., 2014. Slab-selective, BOLD-corrected VASO at 7 tesla provides measures of cerebral blood volume reactivity with high signal-to-noise ratio. Magn. Reson. Med. 72, 137–148.
[7]. Dumoulin, S.O., Wandell, B.A., 2008. Population receptive field estimates in human visual cortex. Neuroimage 39, 647–660.
[8]. Dumoulin, S.O., Knapen, T., 2018. How visual cortical organization is altered by ophthalmologic and neurologic disorders. Annu. Rev. Vis. Sci. 4, 357–379.
[9]. Harvey, B.M., Dumoulin, S.O., 2011. The relationship between cortical magnification factor and population receptive field size in human visual cortex: Constancies in cortical architecture. J. Neurosci. 31, 13604–13612.
[10]. (https://github.com/vistalab/vistasoft)
Figures