0164
Evaluation of perfusion effects on HP[1-13C]pyruvate imaging parameters in patients with glioblastoma
Sana Vaziri1, Adam Autry1, Marisa Lafontaine1, Janine M Lupo1, Jeremy W Gordon1, Jasmine Hu1, Hsin-Yu Chen1, Yaewon Kim1, Javier Villanueva-Meyer1, Susan M Chang2, Jennifer Clarke2,3, Nancy Ann Oberheim Bush2,3, Duan Xu1, Peder EZ Larson1, Daniel B Vigneron1,4, and Yan Li1
1Department of Radiology and Biomedical Imaging, University of California, San Francisco, San Francisco, CA, United States, 2Department of Neurological Surgery, University of California, San Francisco, San Francisco, CA, United States, 3Department of Neurology, University of California, San Francisco, San Francisco, CA, United States, 4Department of Bioengineering and Therapeutic Science, University of California, San Francisco, San Francisco, CA, United States
1Department of Radiology and Biomedical Imaging, University of California, San Francisco, San Francisco, CA, United States, 2Department of Neurological Surgery, University of California, San Francisco, San Francisco, CA, United States, 3Department of Neurology, University of California, San Francisco, San Francisco, CA, United States, 4Department of Bioengineering and Therapeutic Science, University of California, San Francisco, San Francisco, CA, United States
Synopsis
Dynamic hyperpolarized (HP) 13C metabolic imaging allows for non-invasive measurements of real-time enzymatic conversion of injected [1-13C]pyruvate to [1-13C]lactate. The HP signal depends on several factors, including perfusion and monocarboxylate transporter activity. Previously, a global increase of pyruvate-to-lactate apparent conversion rates values was found in patients with glioma after receiving anti-angiogenic therapies. To better understand the effects of tissue vasculature on HP signals, we investigated the relationship between HP[1-13C]pyruvate metabolism and 1H perfusion parameters in normal-appearing white matter patients with glioma.
Introduction
Dynamic hyperpolarized carbon-13 (HP-13C) imaging allows for real-time, non-invasive measurements of [1-13C]pyruvate brain metabolism. Variations in regional brain perfusion and vascular characteristics can complicate the analysis of the injected [1-13C]pyruvate tracer. In addition, partial volume effect in pyruvate signal may also affect the quantification of pyruvate-to-lactate conversion rate (kPL)1. We previously found a global increase in kPL values in patients with glioma after receiving anti-angiogenic therapies2, providing additional evidence of a relationship between HP-13C imaging and tissue vasculature. Arterial Spin Labeling (ASL) and Dynamic Susceptibility Contrast (DSC) perfusion imaging have been used to evaluate cerebral blood flow (CBF) and cerebral blood volume (CBV; peak height, PH). Both methods provided measurements of blood vessel angiogenesis in gliomas3. The purpose of this study was to evaluate the relationship between HP[1-13C]pyruvate metabolism and perfusion parameters within the normal-appearing white matter (NAWM) in patients with glioma, and to examine the effects of partial volume on HP 13C signals within the gadolinium-enhancing lesion using standard and multi-variable resolution acquisitions4,5.Methods
Study populationA total of 7 datasets were acquired from 6 patients with glioblastoma (GBM), including 1 with newly diagnosed disease and 5 with recurrent disease. Five recurrent patients received HP-13C and 1H MRI exam prior to undergoing surgery and/or beginning chemotherapy for suspected tumor progression, which was confirmed based on histopathology of resected tissue. The newly diagnosed patient (patient 6) had two HP 13C/1H MR exams, one before receiving radiation therapy and the other at 5 months after completing radiation therapy.
MR Exam
MR data were acquired using a dual-tuned 24/8-channel 13C/1H coil on a 3T scanner. Dynamic HP-13C data were acquired using a frequency-specific multislice EPI sequence4 (1.5cm slice thickness, 3s temporal resolution, 20 timeframes, 1.5cmx1.5cm in-plane resolution) after injection of HP [1-13C]pyruvate. Patient 6 received two HP-13C EPI acquisitions at the 5-month follow-up timepoint: one with standard 1.5cm isotropic resolution4 and another with variable-resolution5 (in-plane: pyruvate = 0.75cmx0.75cm, lactate/bicarbonate = 1.5cmx1.5cm). 1H MR imaging included pre/post-Gd T1 IRSPGR, T2 FLAIR, ASL (3D background-suppressed FSE stack-of-spirals (512 x 8) labeling at 1500 ms and 2025 ms post label delay, TR/TE=4632/10.5), and DSC imaging (T2* DSC echo-planar imaging, flip angle=35°, TE/TR=54–56/1250-1500ms, slice thickness=3-4 mm, 2mmx2mm reconstructed in-plane resolution).
Processing and analysis
EPI data were prewhitened, coil-combined, phased, and denoised6,7,8. For the multi-resolution acquisition, lactate and bicarbonate were resampled to the higher pyruvate resolution (0.75cmx0.75cm). Voxel-wise kinetic modeling of kPL was performed on dynamic data using an inputless model9. ROIs for normal-appearing white matter (NAWM), non-enhancing lesion (NEL), and contrast enhancing lesions (CEL) were segmented on 1H images. HP-13C EPI voxels with >=40% NAWM were analyzed with perfusion data (Figure 1). CBF (derived from 1H ASL data) and CBV/PH (derived from 1H DSC data) were downsampled to 13C resolution and normalized by the median value across 13C NAWM voxels. Pearson’s correlation coefficients were used to assess voxel-wise correlations between pyruvate area-under-dynamic curve (AUC), kPL, kPL modeling error (kPL % error), CBF, CBV, and PH[ . Regional differences in [1-13C]pyruvate and perfusion parameters within ROIs were evaluated for EPI acquired with the standard resolution and multi-resolution.
Results
Voxel-wise correlations between parameters shown in Figure 2. Across all the subjects, high Pyr AUC values were associated with low kPL, low kPL % errors, and high CBV/PH. 6 of the 7 datasets show a significant positive correlation between Pyr AUC and CBF. Overall, these trends indicated an indirect negative relationship between perfusion and the calculated HP 13C pyruvate to lactate conversion kPL values. Figure 3 illustrates both low-resolution (isotropic acquisition) and high resolution (variable-resolution acquisition) HP [1-13C]pyruvate AUC maps for Patient 6 at a post-radiation timepoint. Pyruvate AUC from the high-resolution [1-13C]pyruvate acquisition was positively correlated with perfusion within the CEL (CBF, CBV, and PH, p < 0.05). The trend was also seen in [1-13C]pyruvate from the lower resolution acquisition, though less significant. Figure 4 shows the distribution of these parameters in each ROI (NAWM, NEL, CEL), with the CEL displaying significantly higher pyruvate AUC compared to NAWM (p < 0.005). Although differences in perfusion parameters were not significant between ROIs, CEL voxels exhibited a much greater range in CBF, CBV, and PH, as expected for tumor heterogeneity.Discussion
Understanding the effects of vascular perfusion on HP-13C signals is important in the analysis of dynamic HP [1-13C]pyruvate imaging in patients with gliomas. Direct voxel-wise correlations between HP [1-13C]pyruvate signal and perfusion were significant within NAWM across 7 patient datasets. HP 13C pyruvate AUC values are significantly higher in grey matter than white matter, which may be due in part to variations in perfusion10. Data acquired using a multi-resolution acquisition helped to mitigate partial volume effects associated with high-concentration vascular pyruvate. Prior pre-clinical studies utilizing glioma models have shown DSC PH was correlated with the total carbon signal from HP-13C MRSI data in tumor11, which is consistent with our finding in patients between perfusion parameters and [1-13C]pyruvate in the contrast-enhancing lesion. Further analysis in both tumor and healthy tissue is needed in a larger homogenous population of volunteers and patients to characterize the relationship between perfusion and HP 13C parameters.Acknowledgements
This project was supported by NIH T32 CA151022, P01 CA118816, R01 CA127612, P41EB013598, P50 CA097257, together with NICO and the Glioblastoma Precision Medicine Program.References
- Graham Jasmine, et al. “Kinetic analysis of multi-resolution hyperpolarized C human brain MRI”. In Proceedings of the 30th Annual Meeting of ISMRM; 2021.
- Autry, Adam W., et al. "Characterization of serial hyperpolarized 13C metabolic imaging in patients with glioma." NeuroImage: Clinical 27 (2020): 102323.
- Lafontaine, Marisa M., et al. “Comparison of Dynamic Susceptibility Contrast and Arterial Spin Labeling at the Target Locations of Image guided Tissue Samples for Patients with Glioma” In Proceedings of the 27th Annual Meeting of ISMRM; 2018.
- Gordon J.W., Vigneron D.B., Larson P. Development of a symmetric echo planar imaging framework for clinical translation of rapid dynamic hyperpolarized 13C imaging. Magn. Reson. Med. 2017;77:826–832. 5
- Gordon, Jeremy W., et al. "A variable resolution approach for improved acquisition of hyperpolarized 13C metabolic MRI." Magnetic resonance in medicine 84.6 (2020): 2943-2952.
- Zihan Z., Zhu X., Ohliger M.A., Tang S., Cao P., Carvajal L. Coil combination methods for multi-channel hyperpolarized 13C imaging data from human studies. J. Magn. Reson. 2019;301:73–79.
- Crane, J.C., Gordon, J.W., Chen, H,Y., Autry, A.W., et al., 2020. Hyperpolarized 13C MRI data acqu isition and analysis in prostate and brain at University of California, San Francisco. NMR Biomed. 2020; e4280.
- Kim, Yaewon, et al. "Denoising of hyperpolarized 13C MR images of the human brain using patch‐based higher‐order singular value decomposition." Magnetic Resonance in Medicine (2021).9.
- Larson, Peder EZ, et al. "Investigation of analysis methods for hyperpolarized 13C‐pyruvate metabolic MRI in prostate cancer patients." NMR in Biomedicine 31.11 (2018): e3997.
- Grist, James T. et al. Quantifying normal human brain metabolism using hyperpolarized [1-(13)C]pyruvate and magnetic resonance imaging. Neuroimage. 2019;189:171–9.
- Park, Ilwoo, Janine M. Lupo, and Sarah J. Nelson. "Correlation of tumor perfusion between carbon-13 imaging with hyperpolarized pyruvate and dynamic susceptibility contrast MRI in pre-clinical model of Glioblastoma." Molecular imaging and biology 21.4 (2019): 626-632.
Figures
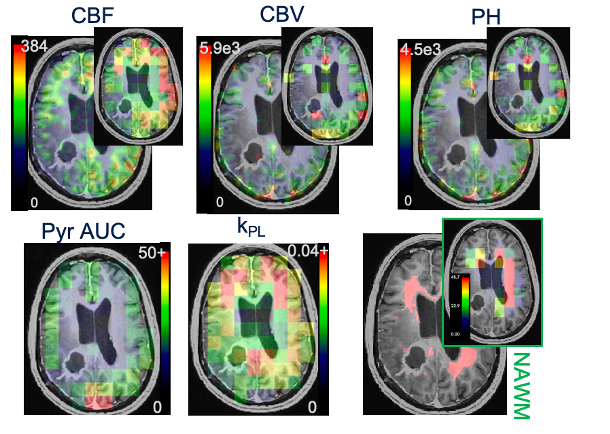
Figure 1. Perfusion and kinetic parameters. (top) CBF, CBV, PH maps at acquired and downsampled 13C resolution (top). (bottom) Pyruvate AUC and kPL maps and an example of NAWM ROI drawn on 1H images with percent 1H ROI in each 13C voxel.

Figure 2. Parameter correlations. Voxel-wise linear correlation coefficients in the NAWM between Pyr AUC and kPL, kPL % err, CBF, CBV, and PH (left block) kPL and CBF, CBV, and PH (middle block), and kPL % error and Pyr AUC and CBF, CBV, and PH (right block). Significant correlations (p < 0.05) are highlighted in red.
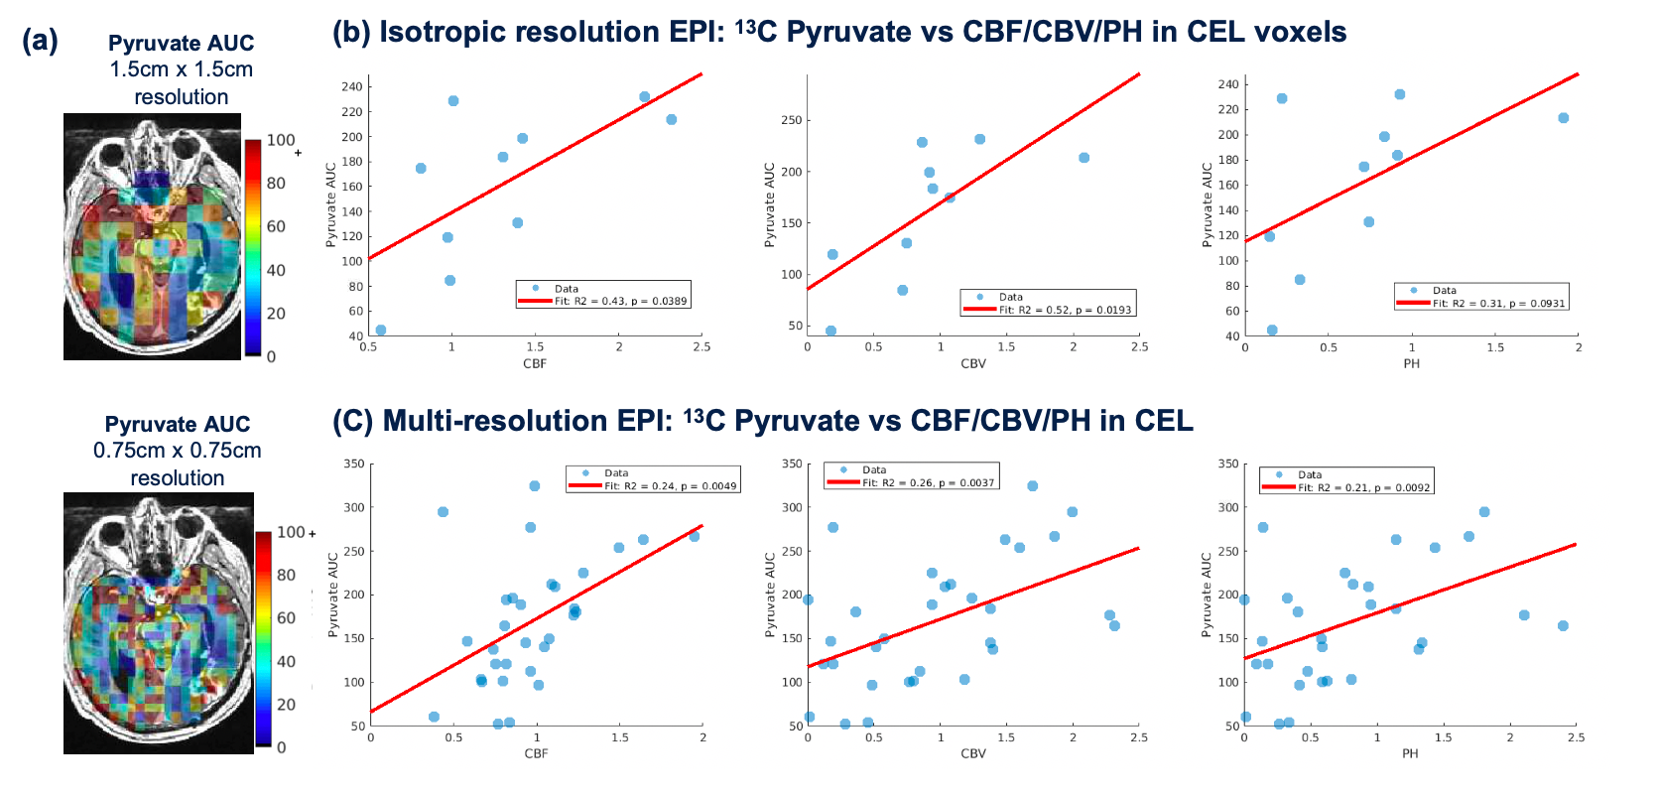
Figure 3. Isotropic and multi-resolution EPI parameters. Patient 6 scanned at a follow-up timepoint with two HP-13C acquisitions in one exam. (a) Pyruvate AUC maps were overlaid on Post-Gd T1 images (top: 1.5cm x 1.5 cm; bottom: 0.75 cm x 0.75cm in-plane resolutions). HP 13C pyruvate AUC maps from EPI acquisitions with 1.5x1.5cm (b) and 0.75x0.75cm (c) resolution were significantly correlated with perfusion parameters within the CEL.
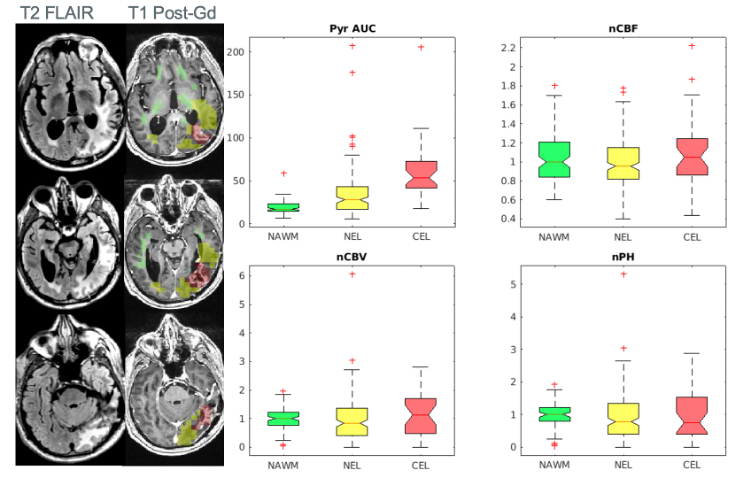
Figure 4. Multi-resolution HP-13C EPI acquisition. T2 FLAIR and T1 post-Gd images are shown for patient 6. Voxels within anatomic lesions were classified as CEL (overlaid on the left in red, >20% 1H ROI), NEL (yellow, >30 % 1H ROI), or NAWM (green, >40% 1H ROI). CBF/CBV/PH values were normalized by the median value in NAWM voxels. A higher range of CBF, CBV, and PH was found within the CEL and NEL, indicative of tumor heterogeneity.
DOI: https://doi.org/10.58530/2022/0164