0163
Longitudinal Brain and Cognitive Development of the First 1000 Days:A Large Multi-Cohort Multi-Scanner Study1Psychology, Stavanger University, Stavanger, Norway, 2Pediatrics, Warren Alpert Medical School at Brown University, Providence, RI, United States, 3Diagnostic Imaging, Rhode Island Hospital, Providence, RI, United States, 4Statistics, UC Davis, Davis, CA, United States, 5Centre for the Developing Brain, Department of Perinatal Imaging and Health, King's College London, London, United Kingdom, 6Department of Forensic & Neurodevelopmental Sciences, King's College London, London, United Kingdom, 7MRC Centre for Neurodevelopmental Disorders, King's College London, London, United Kingdom, 8Radboud University, Maastricht, Netherlands, 9Scientific Data Division & Biological Systems and Engineering Division, LBNL, Berkeley, CA, United States, 10Helen Wills Neuroscience Institute & Redwood Center for Theoretical Neuroscience, UC Berkeley, Berkeley, CA, United States, 11Centre for Medical Image Computing, Computer Science, UCL, London, United Kingdom, 12Dementia Research Centre, Queen Square Institute of Neurology, UCL, London, United Kingdom, 13Department of Neuroimaging, Institute of Psychiatry, Psychology and Neuroscience, King's College London, London, United Kingdom, 14Institute of Child Development, University of Minnesota, Minneapolis, MN, United States, 15Brown's Advanced Baby Imaging Lab, Rhode Island Hospital, Providence, RI, United States
Synopsis
The first 1000 days are essential for a child’s development, consisting of critical time windows for brain and cognitive development but also vulnerability. In this large multi-cohort study, we investigated typical development of 478 children with ≤6 timepoints across two different scanners with different acquisition protocols. PACE brain-for-age growth percentiles and regression slope functions with 95% pointwise confidence intervals identified critical windows of neurocognitive development. Our results could allow for more appropriate neurodevelopmental burden estimates across multi-scanner cohorts, and help identify primary risk factors and age-specific intervention impact.
Introduction
The first 1000 days in a child’s life display a critical time window for rapid brain growth1 and skill development2. While brain gross anatomy is reminiscent of its adult appearance already at birth, neurogenesis continues throughout infancy and early childhood, leaving the brain to reach >80% of its final size by age three3. However, this developmental period is highly vulnerable and deviations in patterns of brain development have been associated with worsened cognitive development and outcomes potentially indicative of neurodevelopmental disorders including autism spectrum disorder1.A key aspect of successful early prevention, diagnosis and intervention for atypical development is to first characterise early typical brain development and identify sensitive time windows associated with neurocognitive milestones1. While population based mean function models help describe overall brain development, they are unable to detect whether a child is developing well or struggling for their age, thus missing a crucial link to early behaviour. Previous application has further been limited to homogeneous datasets, avoiding real-life scenarios such as difference in scanner model and acquisition protocol or data sparsity.In this study, we applied our novel nonlinear PACE growth percentile method designed for sparse longitudinal data4 to investigate patterns of development during the first 1000 days of life in a large neuroimaging study across two different MRI scanners and acquisition protocols. We then linked regional brain development to standardized measures of motor and cognitive development, allowing for identification of critical time windows where brain regional development and skill development interact.Methods
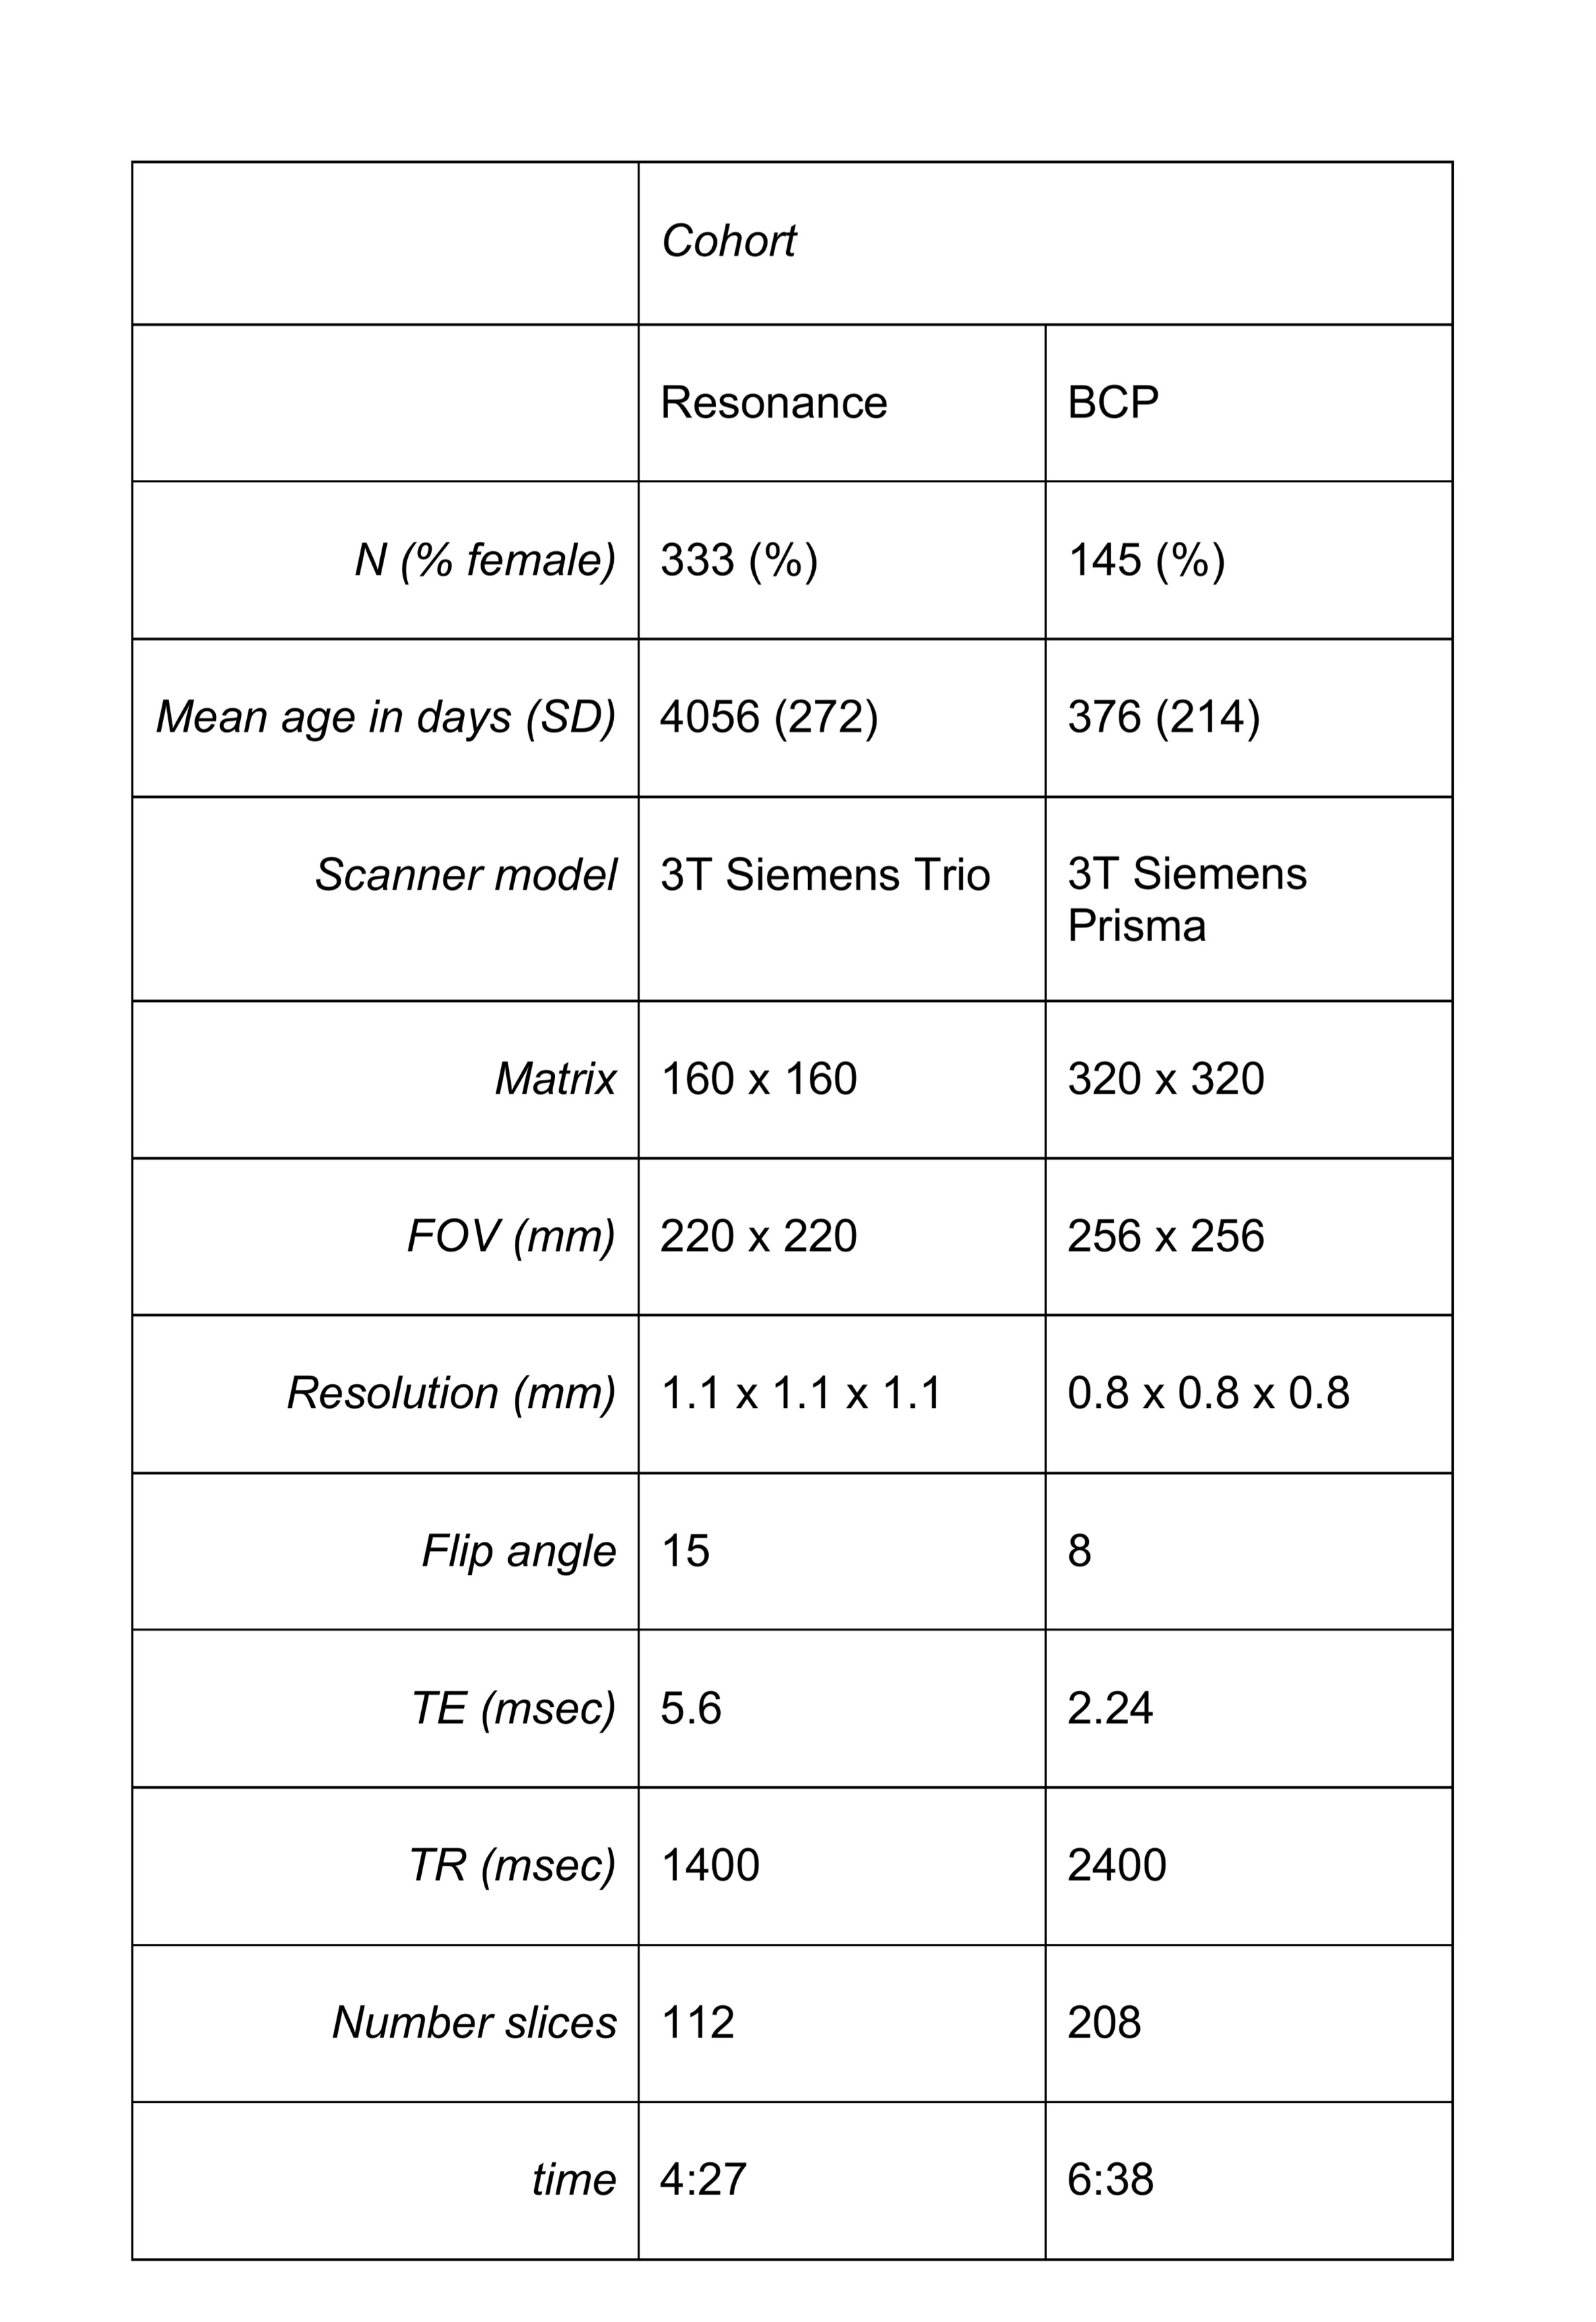
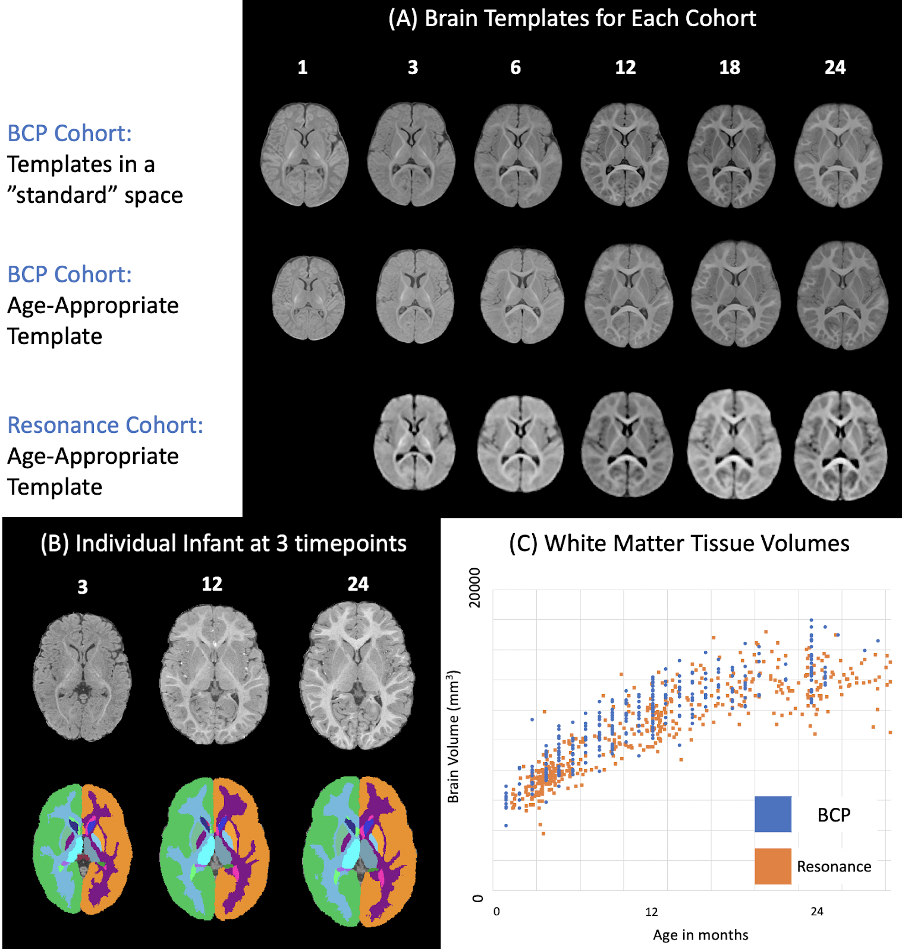
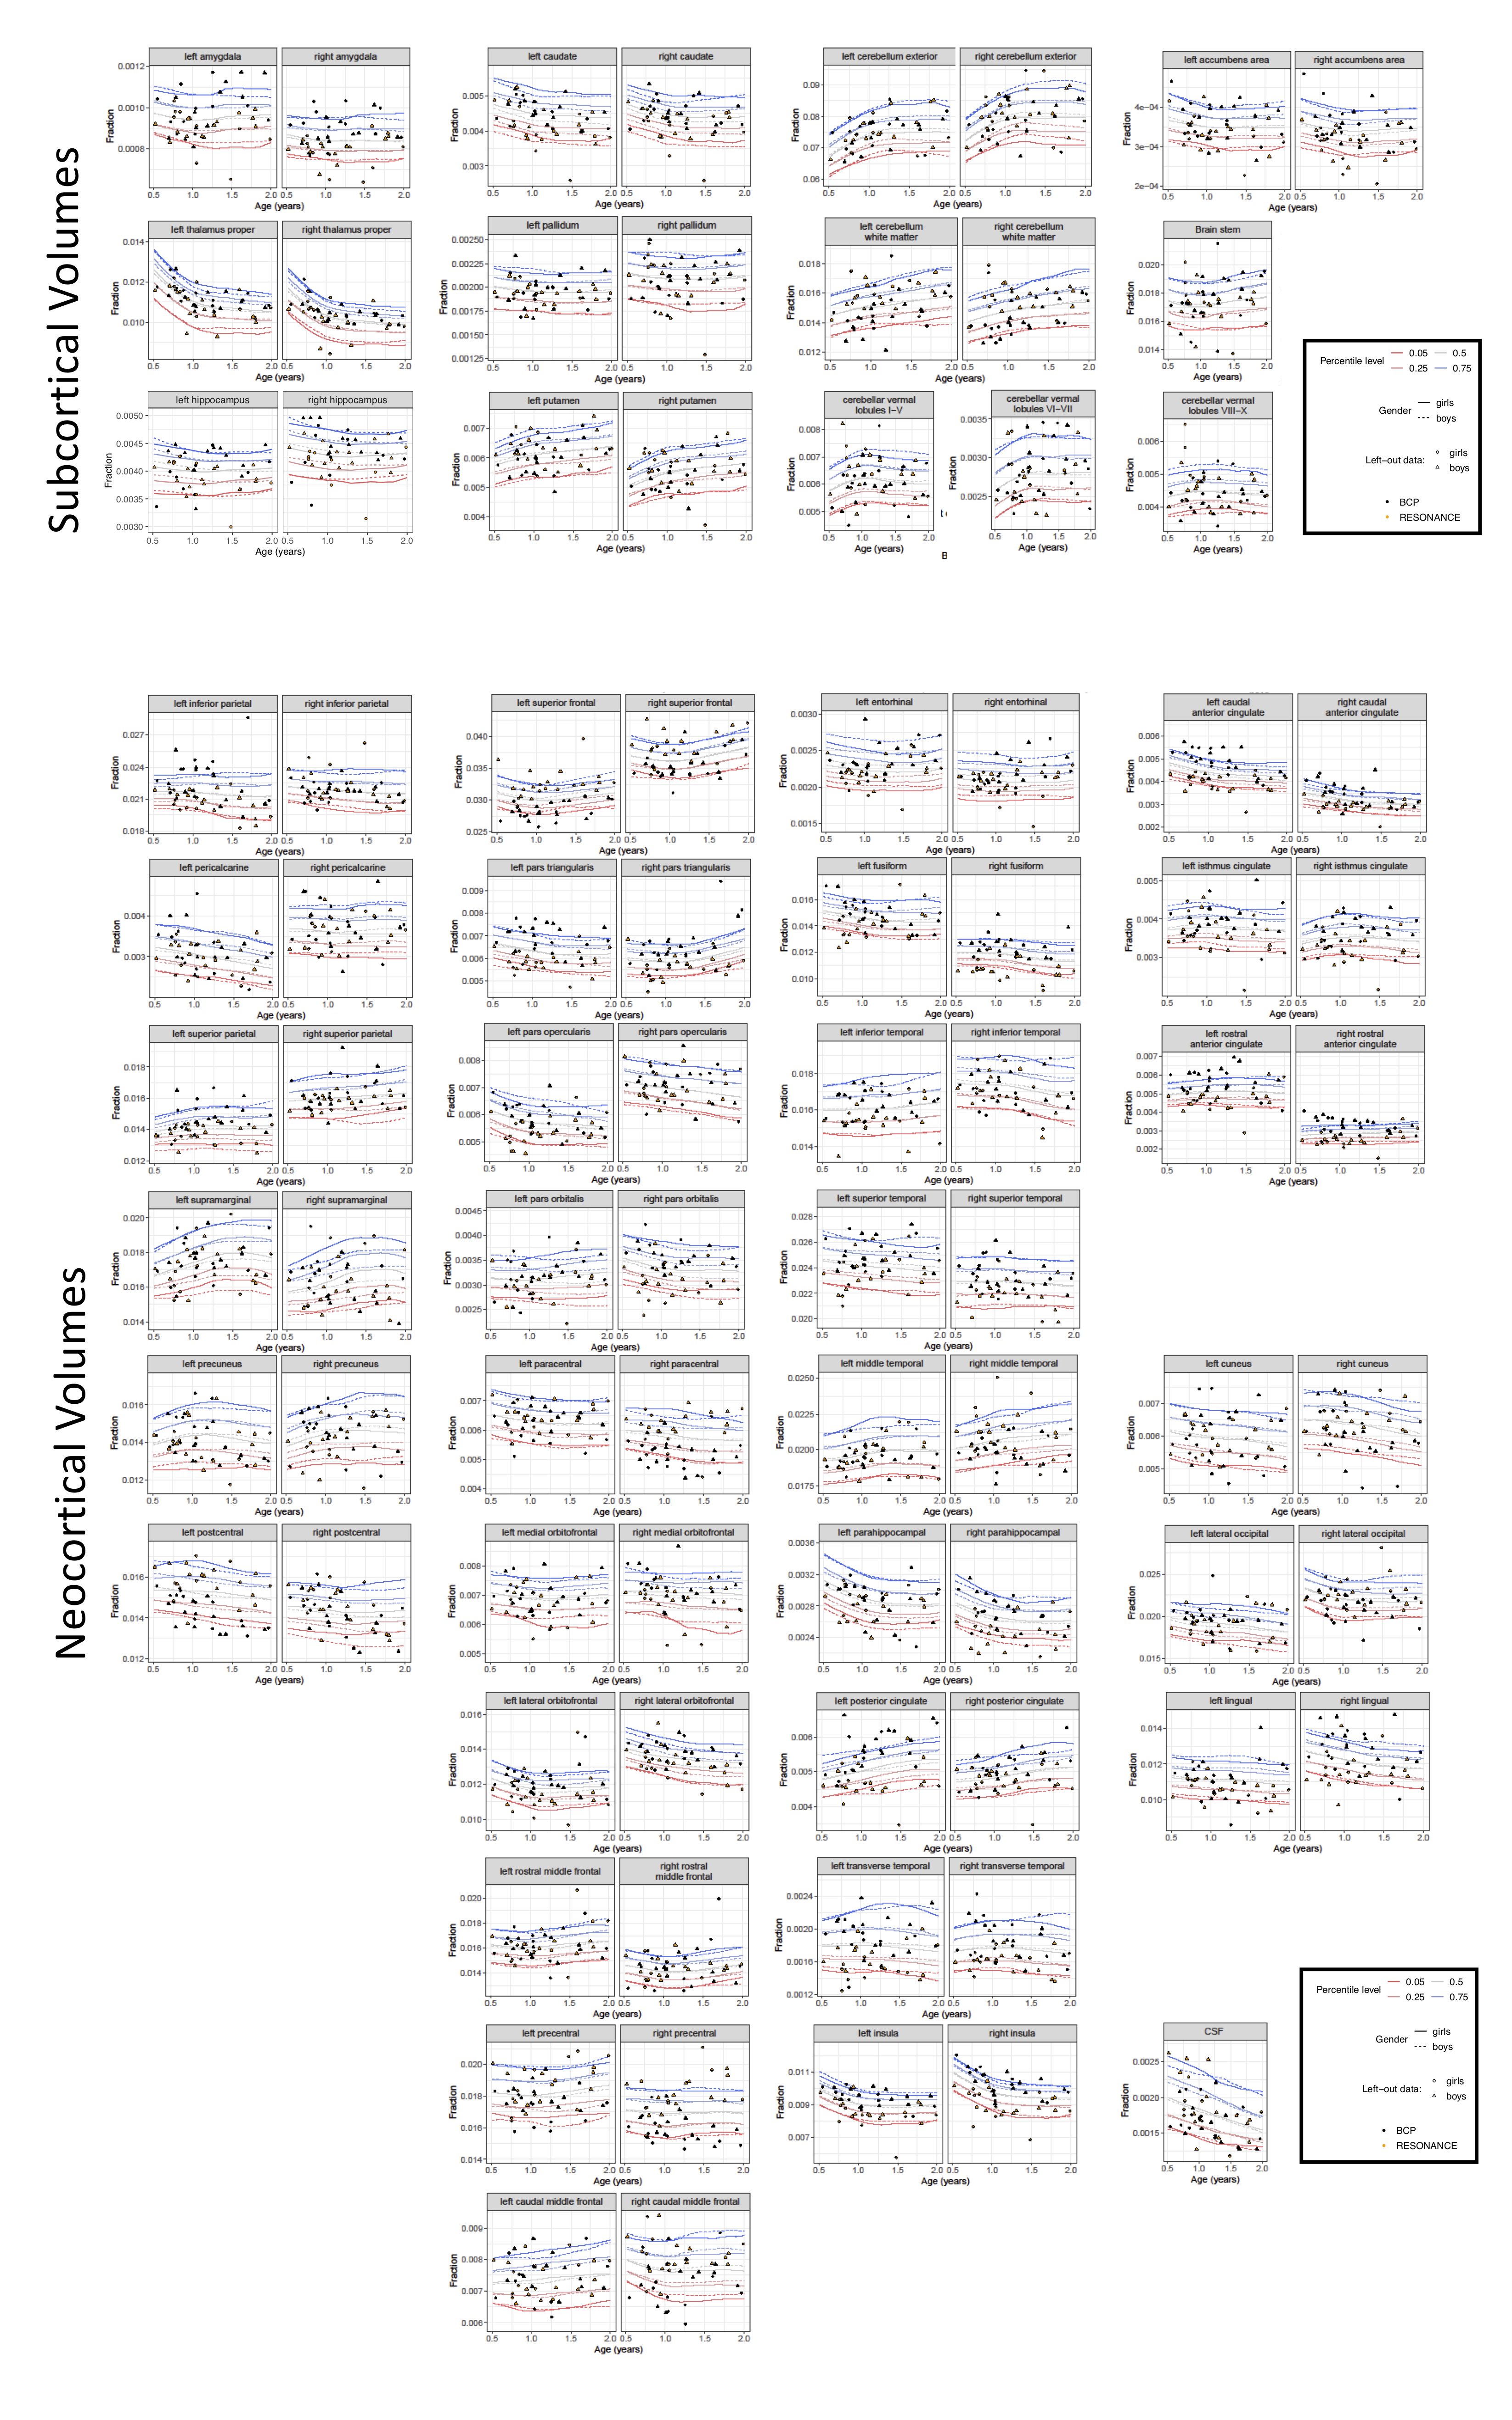
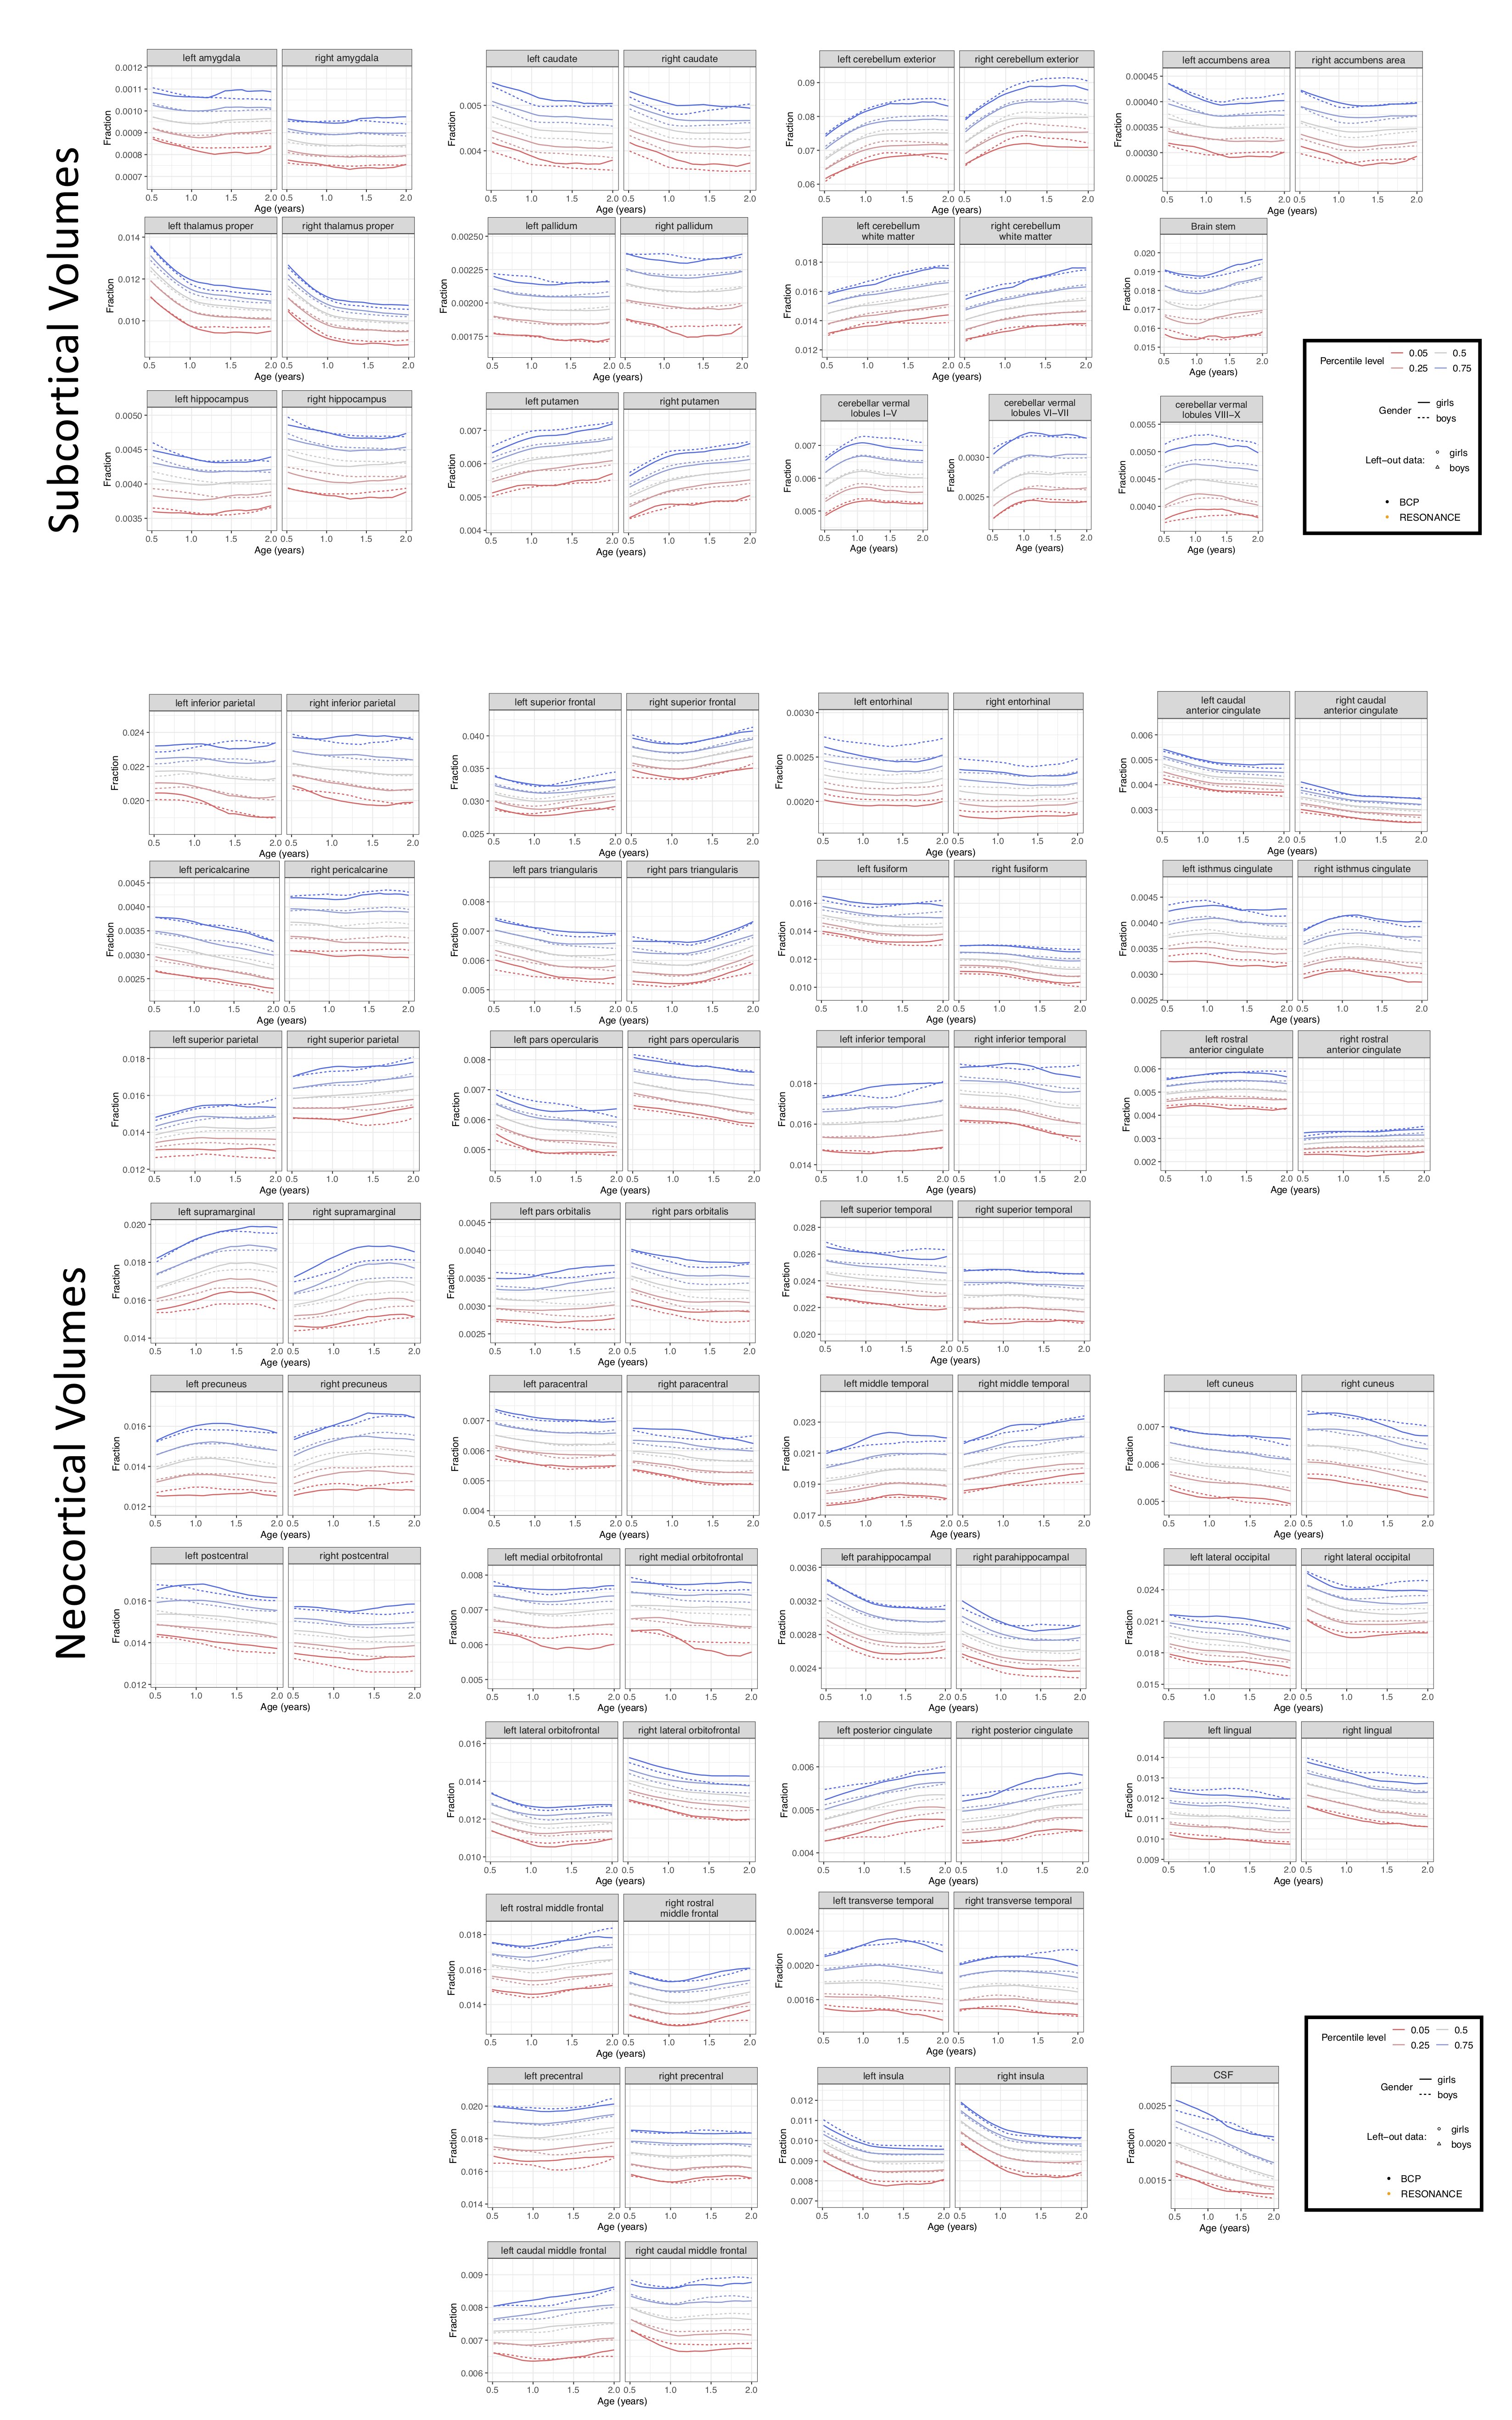
Longitudinal sMRI data were acquired for 478 neurotypical term-born children with ≤6 timepoints on two different scanners with different protocols (Table1). Exclusion and inclusion criteria for both studies can be found in detail elsewhere5,6.Using a combination of linear and nonlinear image registration, we created representative age-specific templates using the ANTs package7 for the Resonance and BCP datasets separately. After age specific templates were created, a single flow from each age to the 12-month template was estimated and a final warp from the 12-month template to standard adult MNI space was performed (Figure1) and the Harvard-Oxford brain atlas applied8. PACE brain-for-age growth percentiles were created for proportional regional brain volumes, and regression slope functions with 95% pointwise confidence intervals to identify critical windows of neurocognitive development were calculated4 for subcortical and cortical summary volumes. Summary volumes were created by merging hemispheric volumes for accumbens, amygdala, caudate, cerebellum, hippocampus pallidum, putamen and thalamus, and by adding neocortical volumes to frontal, limbic, occipital, parietal and temporal lobular volumes. Cognitive development was measured using Mullen Scales of Early Learning9 standardised scores for overall cognitive development (early learning coefficient, ELC), verbal development quotient (VDQ) and nonverbal development quotient (NVDQ), and domain specific functioning t-scores (gross motor, GMT; fine motor, FMT; receptive language, RLT; executive language, ELT).Results
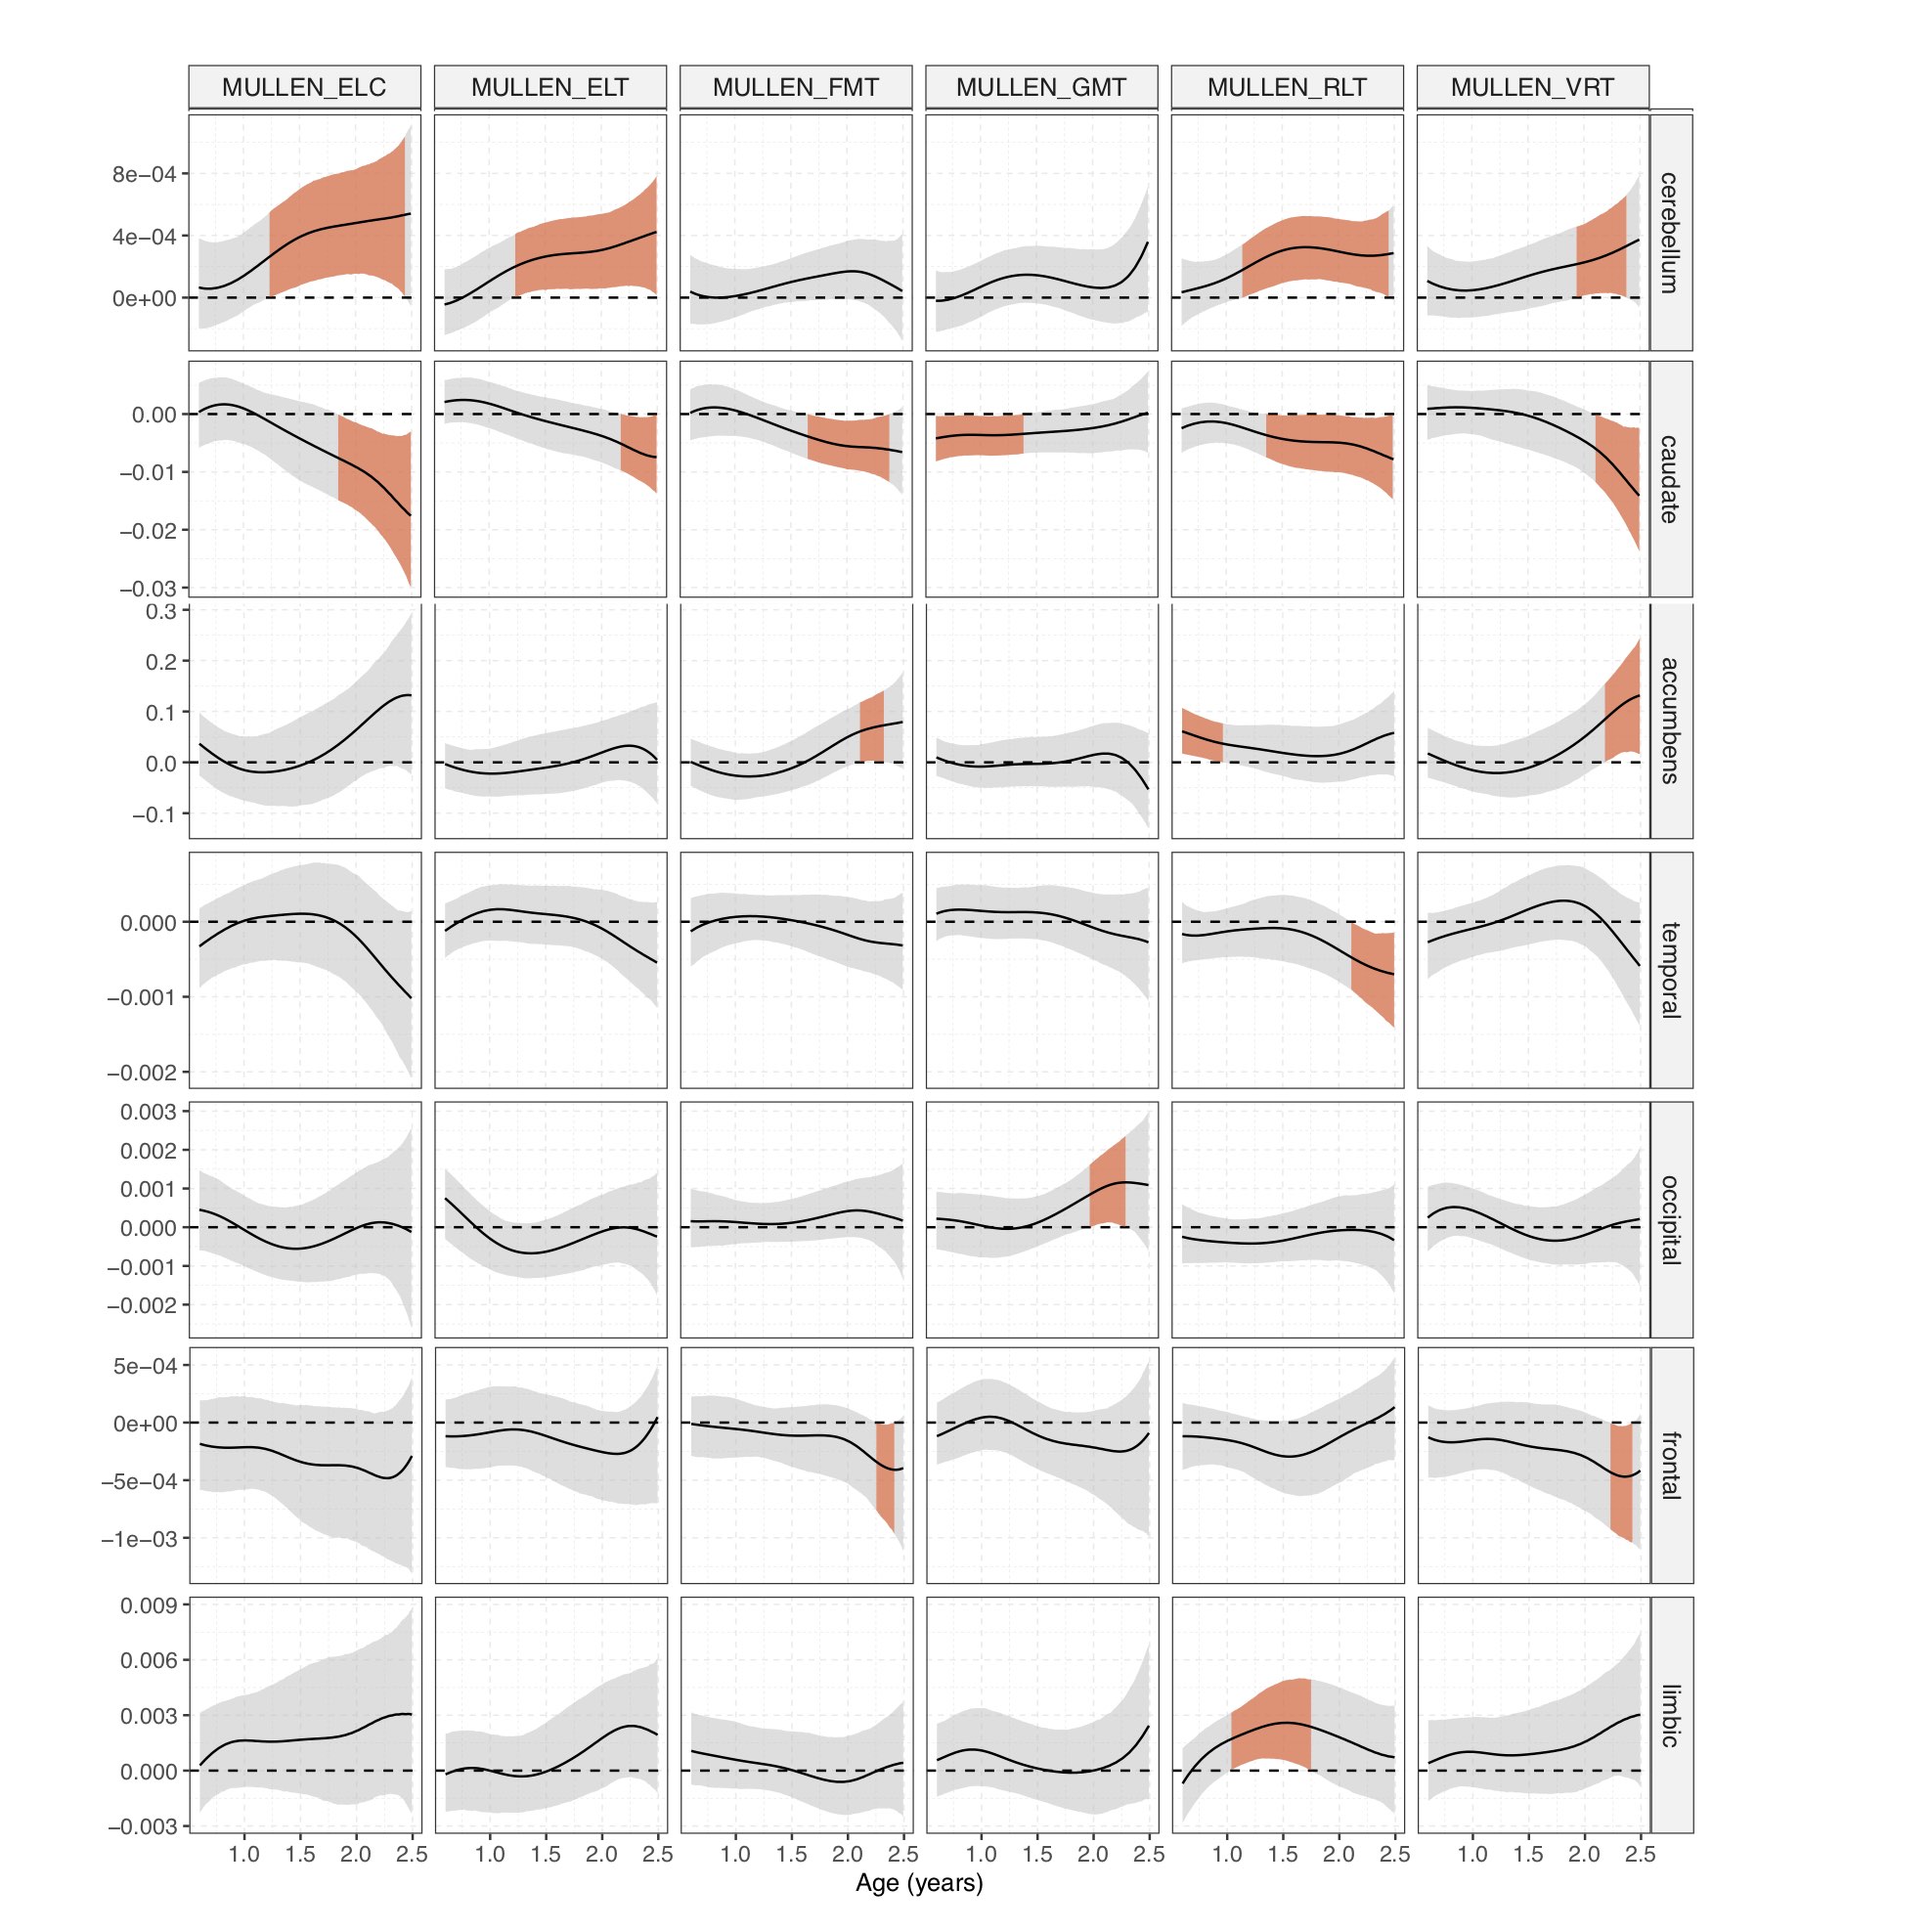
Brain growth patterns align across cohorts (Figures2,3) and slopes of varying coefficient models identified developmental time windows (Figure4) for overall cognitive functioning (ELC) for cerebellar and caudate volume starting at age 1, while windows for ELT were shown for cerebellum, caudate and accumbens volume and additionally limbic and temporal volume for RLT; caudate, accumbens and frontal volume with FMT; caudate and occipital with GMT skill and caudet, accumbens, cerebellum and frontal lobe volume with VRT development.Discussion
Our brain growth patterns with age (Figures2,3) match previous MRI findings of brain development, paralleling cellular processes of initial neurogenesis followed by grey matter pruning, and white matter synaptogenesis1. While percentiles can help describe individual brain development and “where on the curve” a child is relative to the population, their cognitive implication remains unknown. As children develop and attain more skills, their brain structure10 and network functional connectivity changes2,5. We identified sensitive time windows of overall and domain specific neurocognitive development with early onset for the cerebellum and later onset for accumbens, caudate, accumens and neocortical (frontal, limbic, occipital, temporal) volumes (Figure4). Our findings are consistent with the maturational timing of cognitive functions described in the literature11, suggesting early subcortical contributions to overall, motor and language development. However, timing and length of these sensitive developmental windows differ across brain regions, highlighting the importance of using the right measure at the right time, potentially leading prevention, diagnosis and intervention. While we successfully combined sMRI data from two large cohorts to investigate timing and domain of interactions between brain and cognitive development, our next steps are to apply our methods to multimodal MRI data and increase the number of cohorts to include data from low to middle income countries and cohorts at risk for atypical development.Acknowledgements
We would like to thank the Bill and Melinda Gates Foundation (INV005774) for their continuous support of this work.References
1. Silbereis JC, Pochareddy S, Zhu Y, Li M, Sestan N. 2016. The cellular and molecular landscapes of the developing human central nervous system. Neuron. 89(2): 248-268.
2. Bruchhage, MMK, D’Sa, V, Deoni, SCL (2021). Functional Correlates of Early Language and Motor Development. Cerebral Cortex (accepted for publication).
3. Dekaban, AS, Sadowsky, D. (1978). Changes in brain weights during the span of human life: Relation of brain weights to body heights and body weights. Annals of Neurology, 4, 345–356.
4. Chen, Y, Dubey, P, Müller, H-G, Bruchhage, MMK, Wang, J-l, Deoni, SCL (2021). Modeling sparse longitudinal data in early neurodevelopment. NeuroImage, 237:118079.
5. Bruchhage, MMK, Ngo, GC, Schneider, N, D’Sa, V, Deoni, SCL (2020). Functional connectivity correlates of infant and early childhood cognitive development. Brain structure and Function. Doi:10.1007//s00429-020-02027-4
6. Howell, BR, et al. (2019). The UNC/UMN BabyConnectome Project (BCP): an overview of the study design and protocol development. NeuroImage, 185, 891-905.
7. Avants et al. (2014). The insight ToolKit image registration framework. Front. Neuroinformatics. 28,8:44.
8. Jenkinson, M., Beckmann, C.F., Behrens T.E.J., Woolrich, M.W., Smith, S.M. (2012). FSL. NeuroImage, 62(2), 782-790.
9. Mullen, EM (1995). Mullen scales of early learning. AGS; Circle Pines, MN.
10. Marrus, N., et al. (2018). Walking, gross motor development, and brain functional connectivity in infants and toddlers. Cereb Cortex, 28(2), 750-763.
11. Birn, R.M., Roeber, B. J., Pollak, S.D. (2017). Early childhood stress exposure, reward pathways, and adult decision making. Proc Natl Acad Sci USA, 114(51), 13549-13554.
Figures