0162
In vivo demonstration of generalized anisotropy profiles for resolving boundaries between subcortical gray and white matter1Athinoula A. Martinos Center for Biomedical Imaging, Massachusetts General Hospital & Harvard Medical School, Charlestown, MA, United States
Synopsis
We investigate the use of generalized anisotropy profiles (GAPs) for delineating boundaries between subcortical gray and white matter in vivo. Replicating results from a previous ex vivo study, we show that GAPs, which are computed from the diffusion propagator, provide more informative contrasts than T1- and T2-weighted images or conventional diffusion metrics. An undersampled Cartesian-grid sampling of q-space can be used to obtain these profiles with a reasonable scan time. Thus, GAPs show promise as a multi-channel contrast that could be used in the future to improve structural segmentation.
Introduction
The T1- and T2-weighted images that are traditionally used for structural segmentation suffer from low contrast-to-noise ratio in certain subcortical structures. Microstructural maps from diffusion MRI offer unique contrasts that can improve the segmentation of tissues1,2 and subcortical structures3. Maps derived from the diffusion ensemble average propagator (EAP)4 offer richer contrasts than conventional, tensor-based metrics like fractional anisotropy (FA). Previously, we introduced the generalized anisotropy profile (GAP), a multivariate extension of scalar anisotropy, which we computed from the EAP. In an ex vivo validation study, we showed that GAPs offer unique contrast between subcortical and white matter structures5. Here, we present the first in vivo demonstration of this approach. We compare GAPs obtained from fully sampled diffusion spectrum imaging (DSI) data and from an accelerated, compressed-sensing DSI (CS-DSI) scheme, consisting of only 171 directions6,7. We show their utility for extracting maps with high contrast between subcortical structures and white matter in vivo.Methods
Diffusion MRI data were acquired on the 3T CONNECTOM MRI scanner8 using a 64 channel coil9 and a 2D spin-echo EPI simultaneous multislice sequence (TE/TR=55/3800 ms, GRAPPA=3, SMS=2, PF=7/8, 1.8 mm isotropic resolution). We used a DSI sampling scheme10 with 514 gradient directions, 34 interspersed b=0 images, bmax=10000 s/mm2, Gmax=243 mT/m, ẟ=10.8 ms, and Δ=25.5 ms. Total scan time was 36 minutes. Three b=0 images were acquired with reversed phase encoding. Image preprocessing consisted of denoising11 and corrections for susceptibility12 and eddy-current distortions13. We undersampled the DSI data by a factor of R=3 in q-space to produce a CS-DSI dataset with 171 directions. We performed PCA-based CS-DSI reconstruction7 on these data as previously6. We used a single axial slice from a DSI dataset of a different healthy control, acquired on the CONNECTOM, to train the dictionary for PCA. In each voxel, we reconstructed samples of the EAP on 100 spheres in displacement space (uniformly spaced between 0 and the MDD of water), with generalized DSI (GDSI)14. We sampled 642 directions uniformly on each sphere. We obtained GAPs by computing the standard deviation of the EAP samples at each displacement5. Additionally, we computed the half-width at half-maximum (HWHM) of the EAP along each direction, and extracted the minimum HWHM across all directions (HWHMmin). We performed a tensor fit to obtain FA and mean diffusivity (MD) maps.We also acquired structural (T1w MEMPRAGE, T2w SPACE) data at 1 mm isotropic resolution, and processed them with FreeSurfer15. Structural and b=0 images were aligned with boundary-based affine registration16. For a demonstration of intensity-based segmentation using different maps (T1w, T2w, FA, MD, HWHMmin), we performed k-means clustering (5 clusters for FA, 6 clusters for all other maps).Results
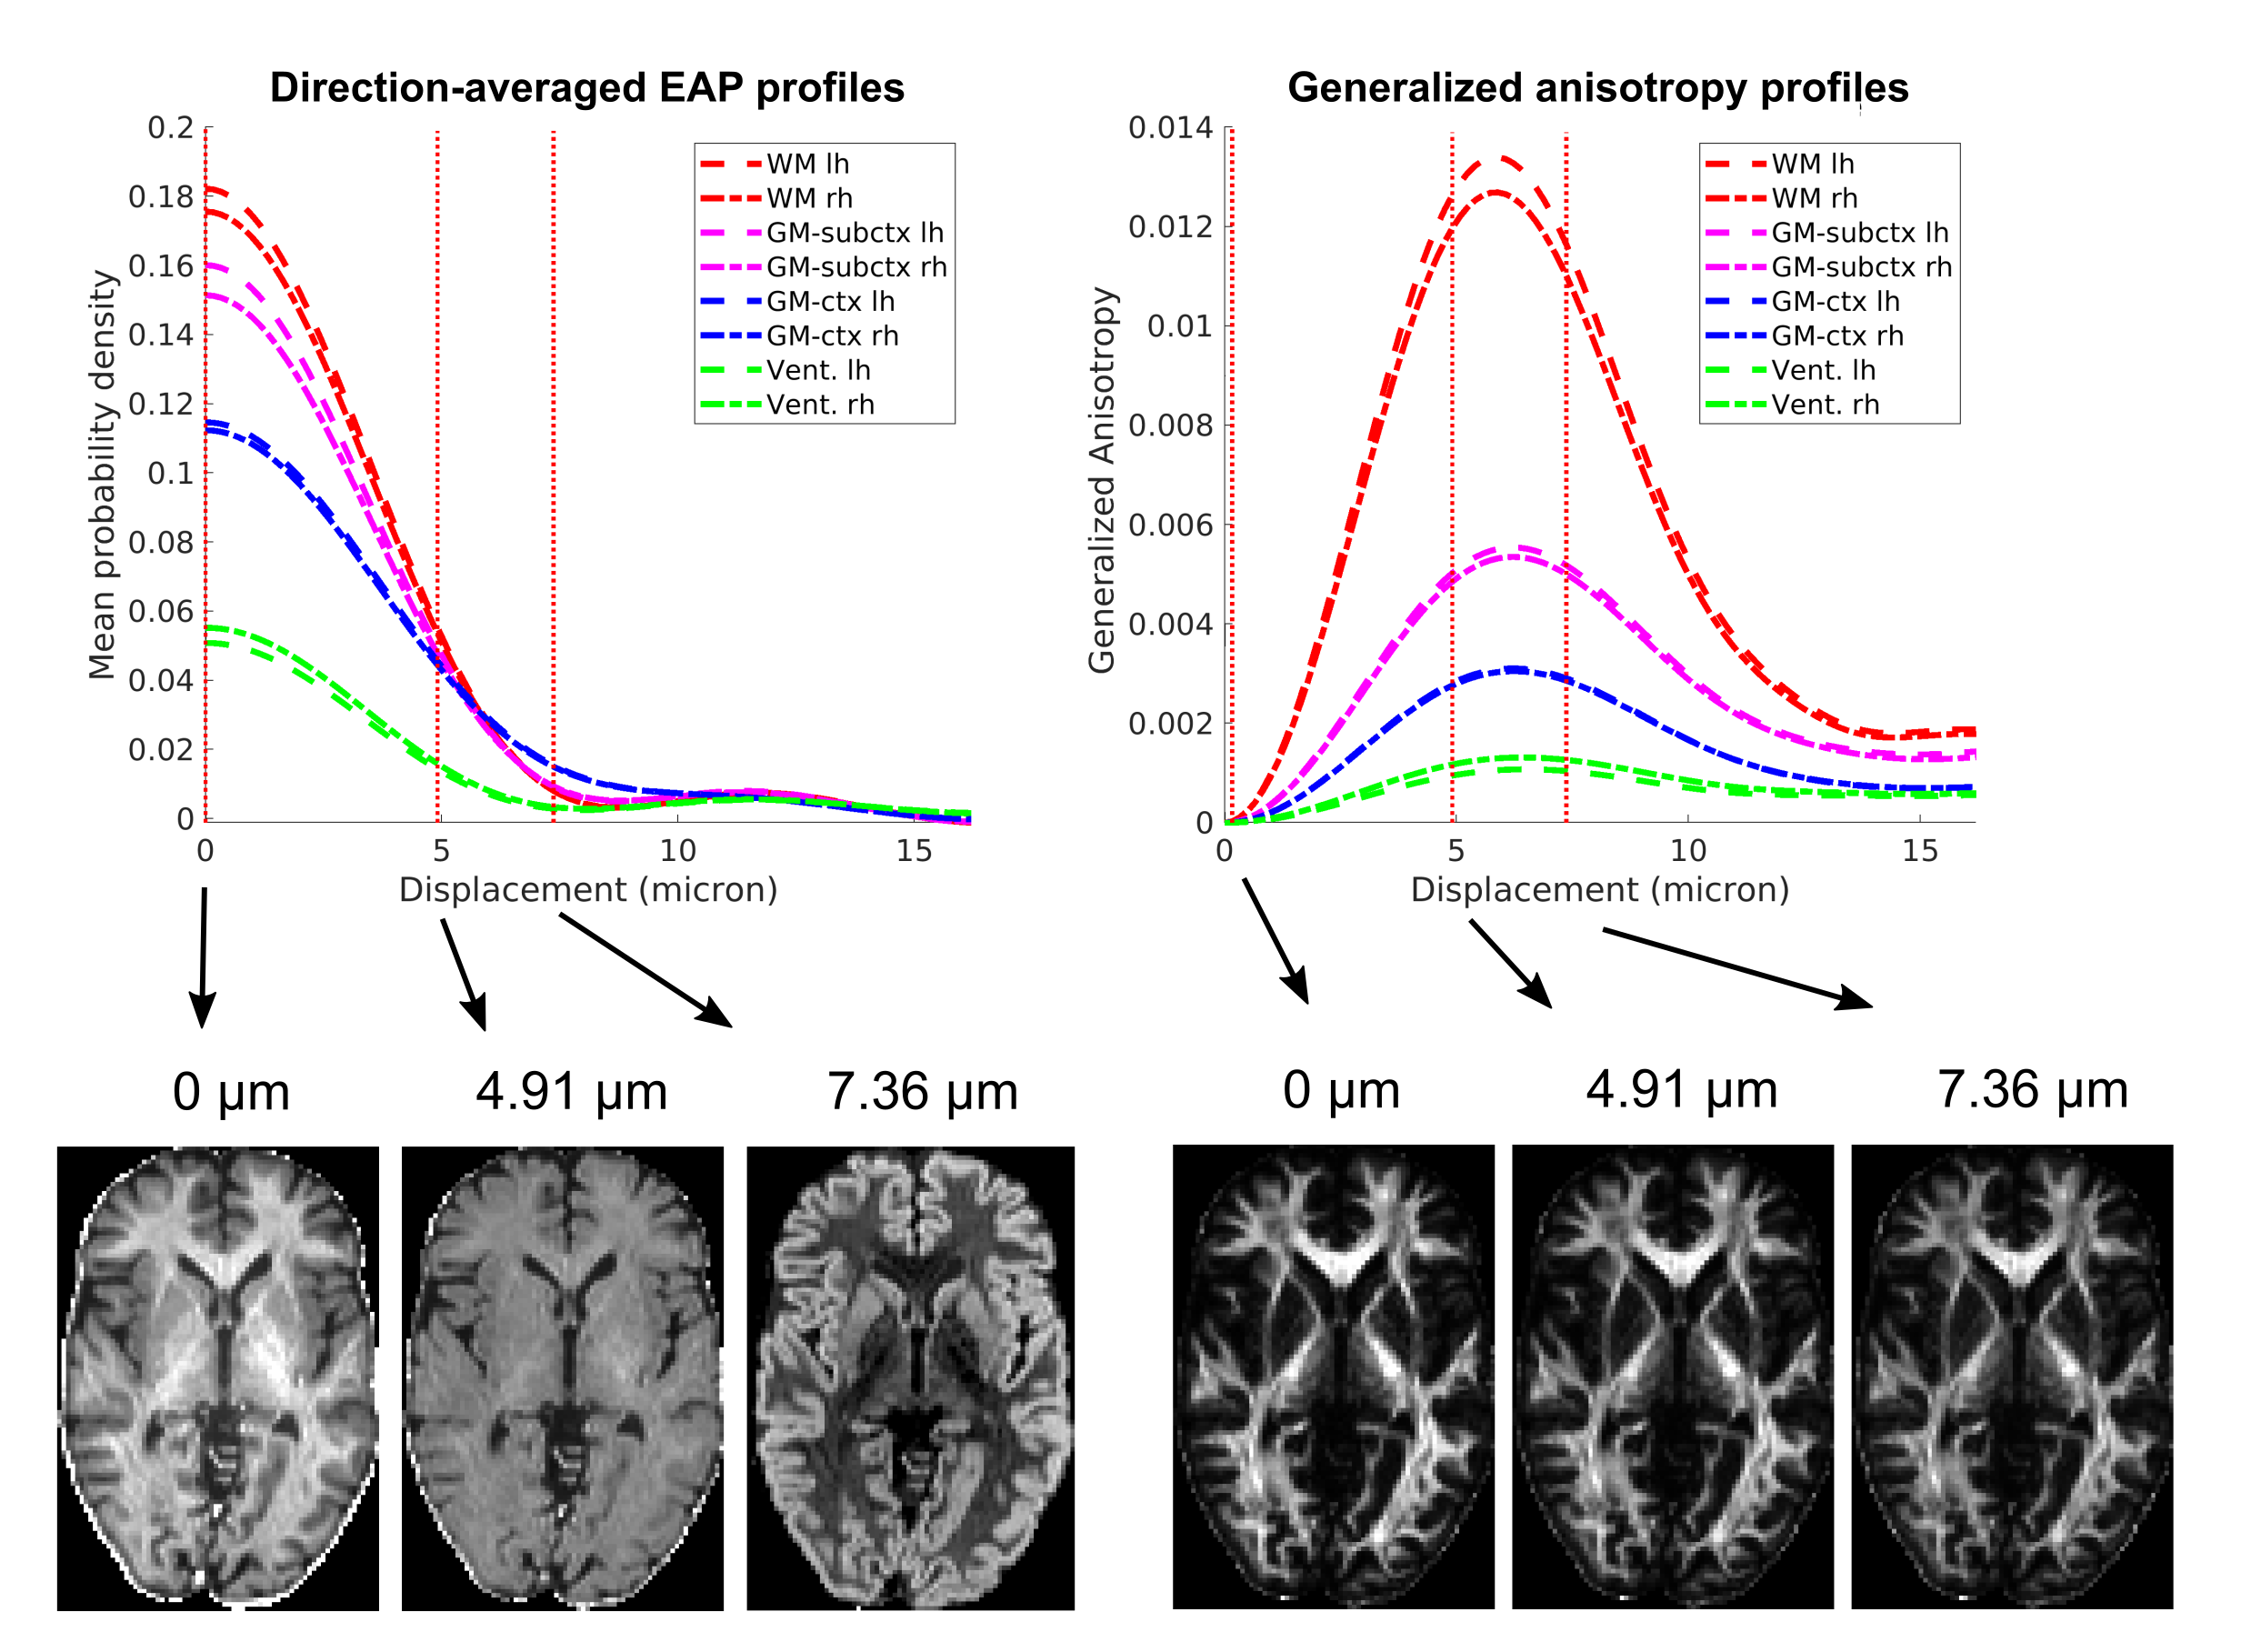
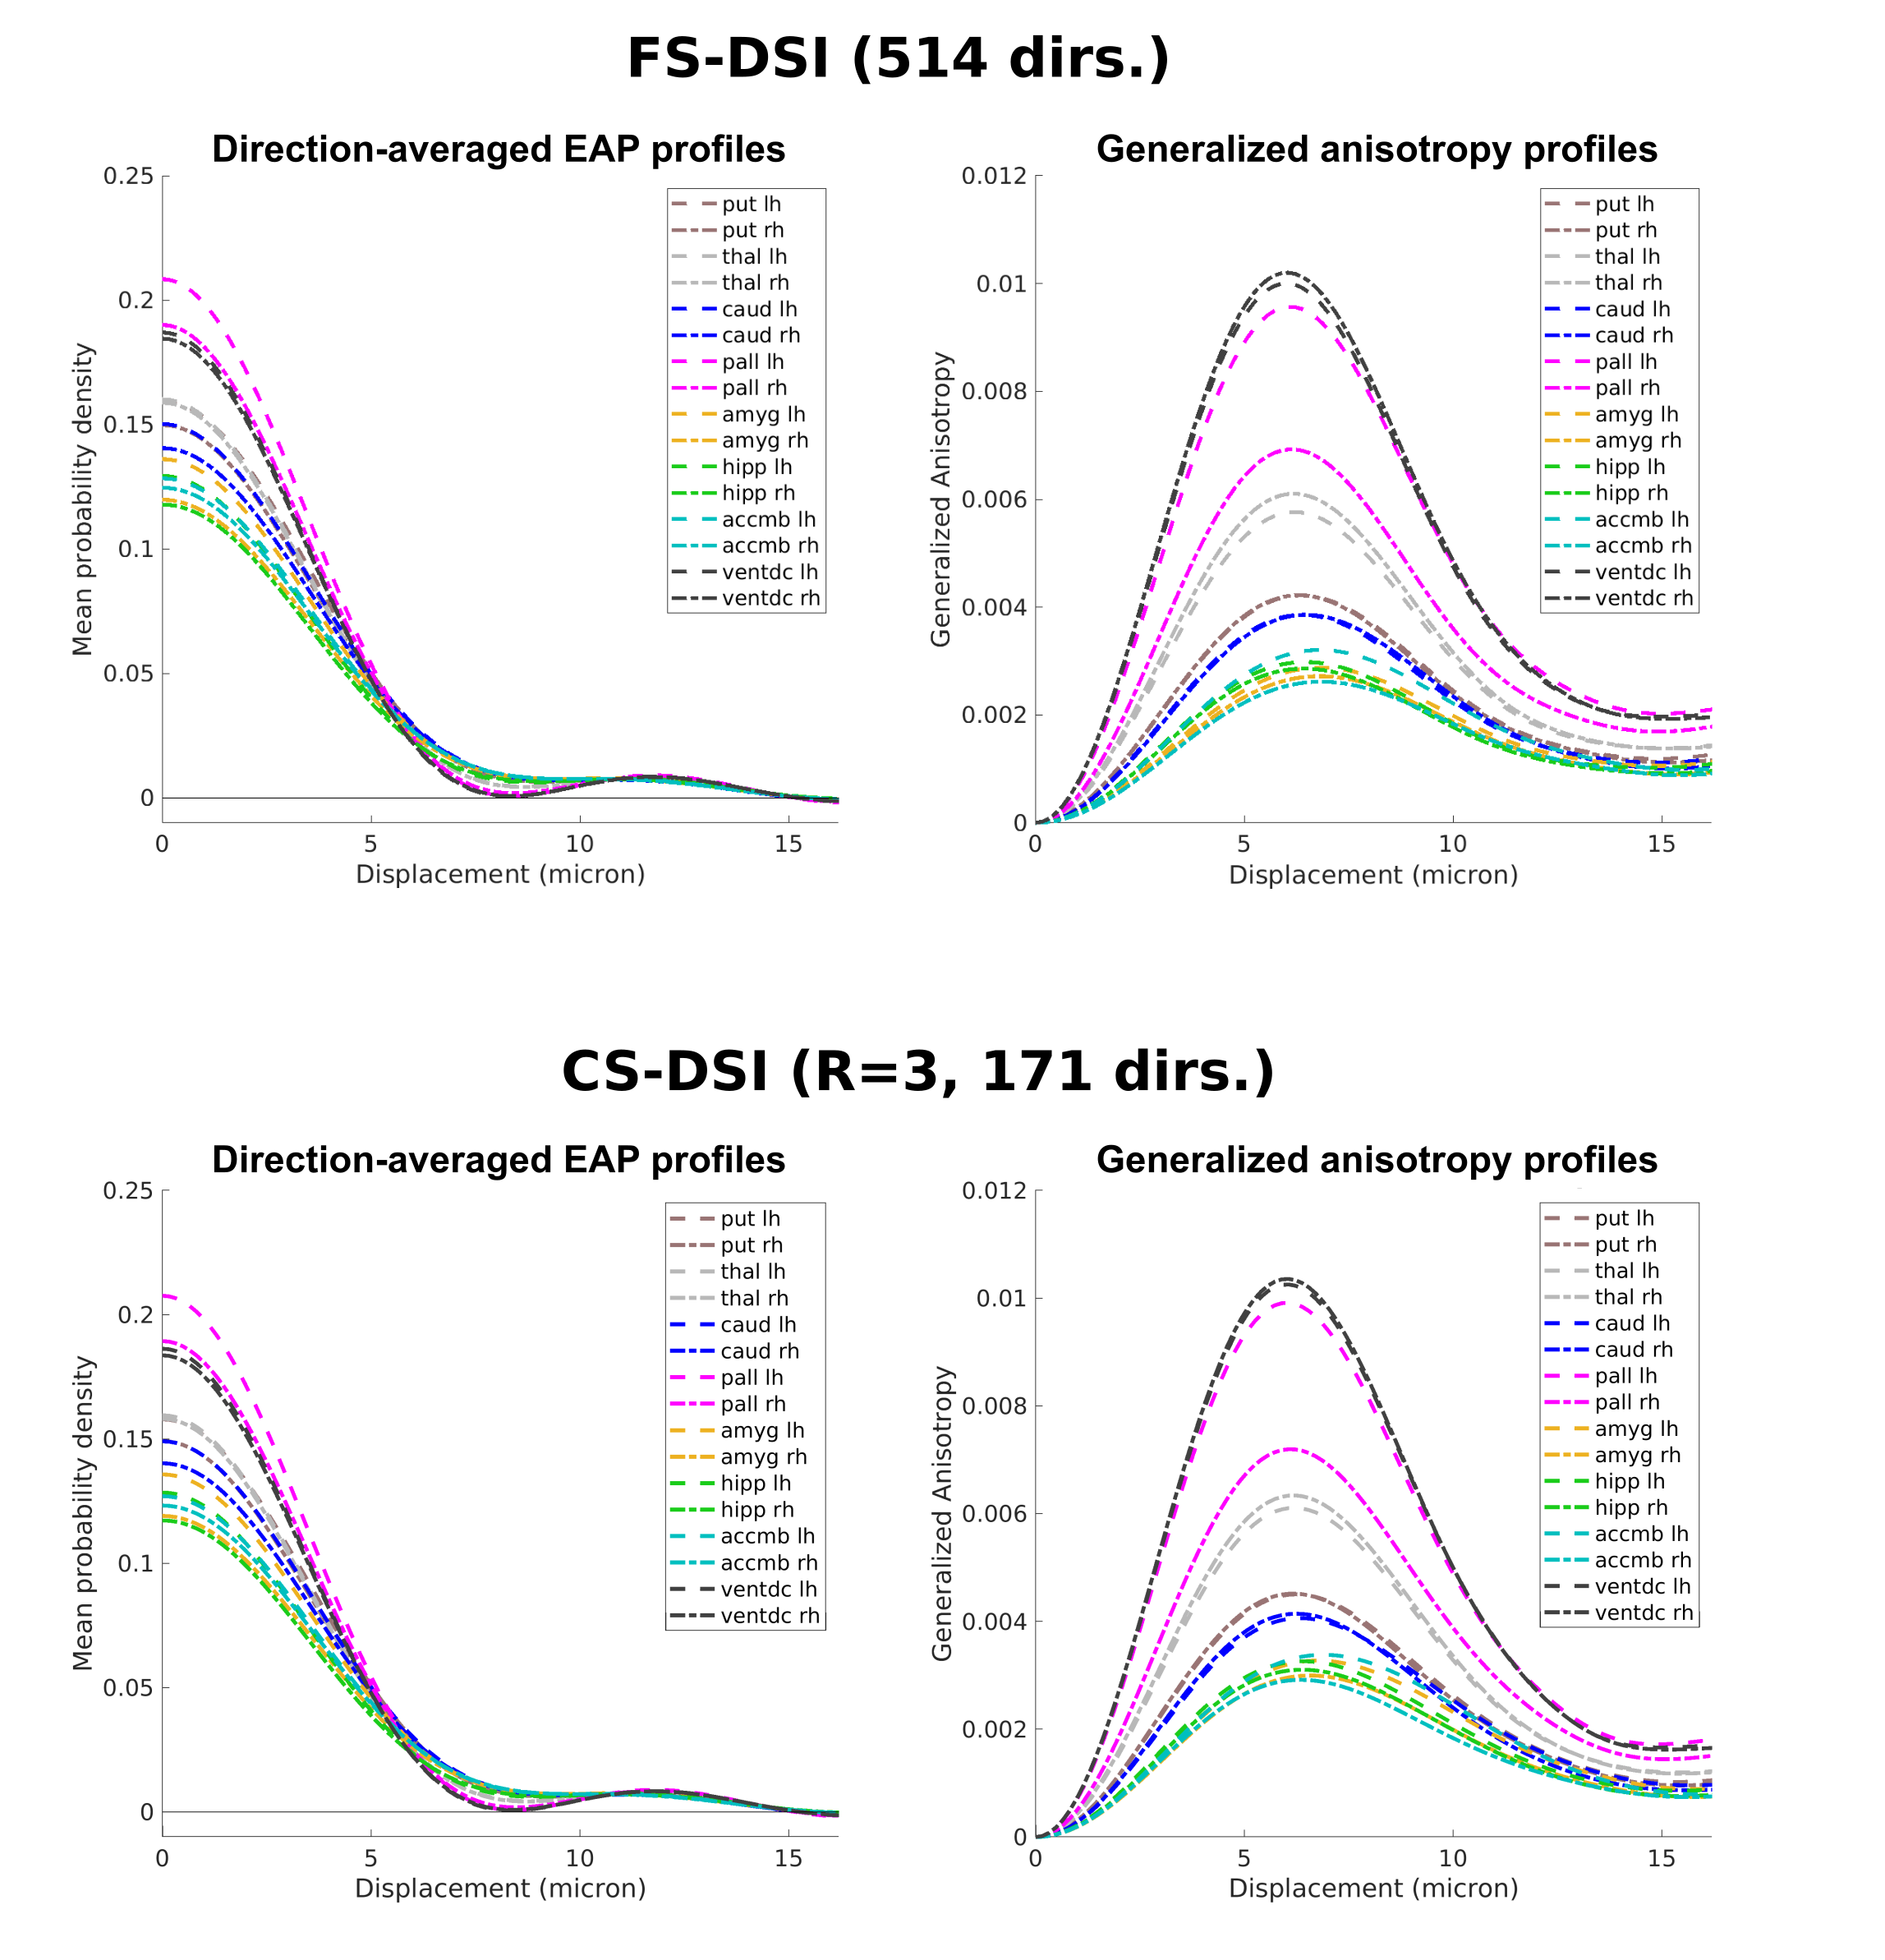
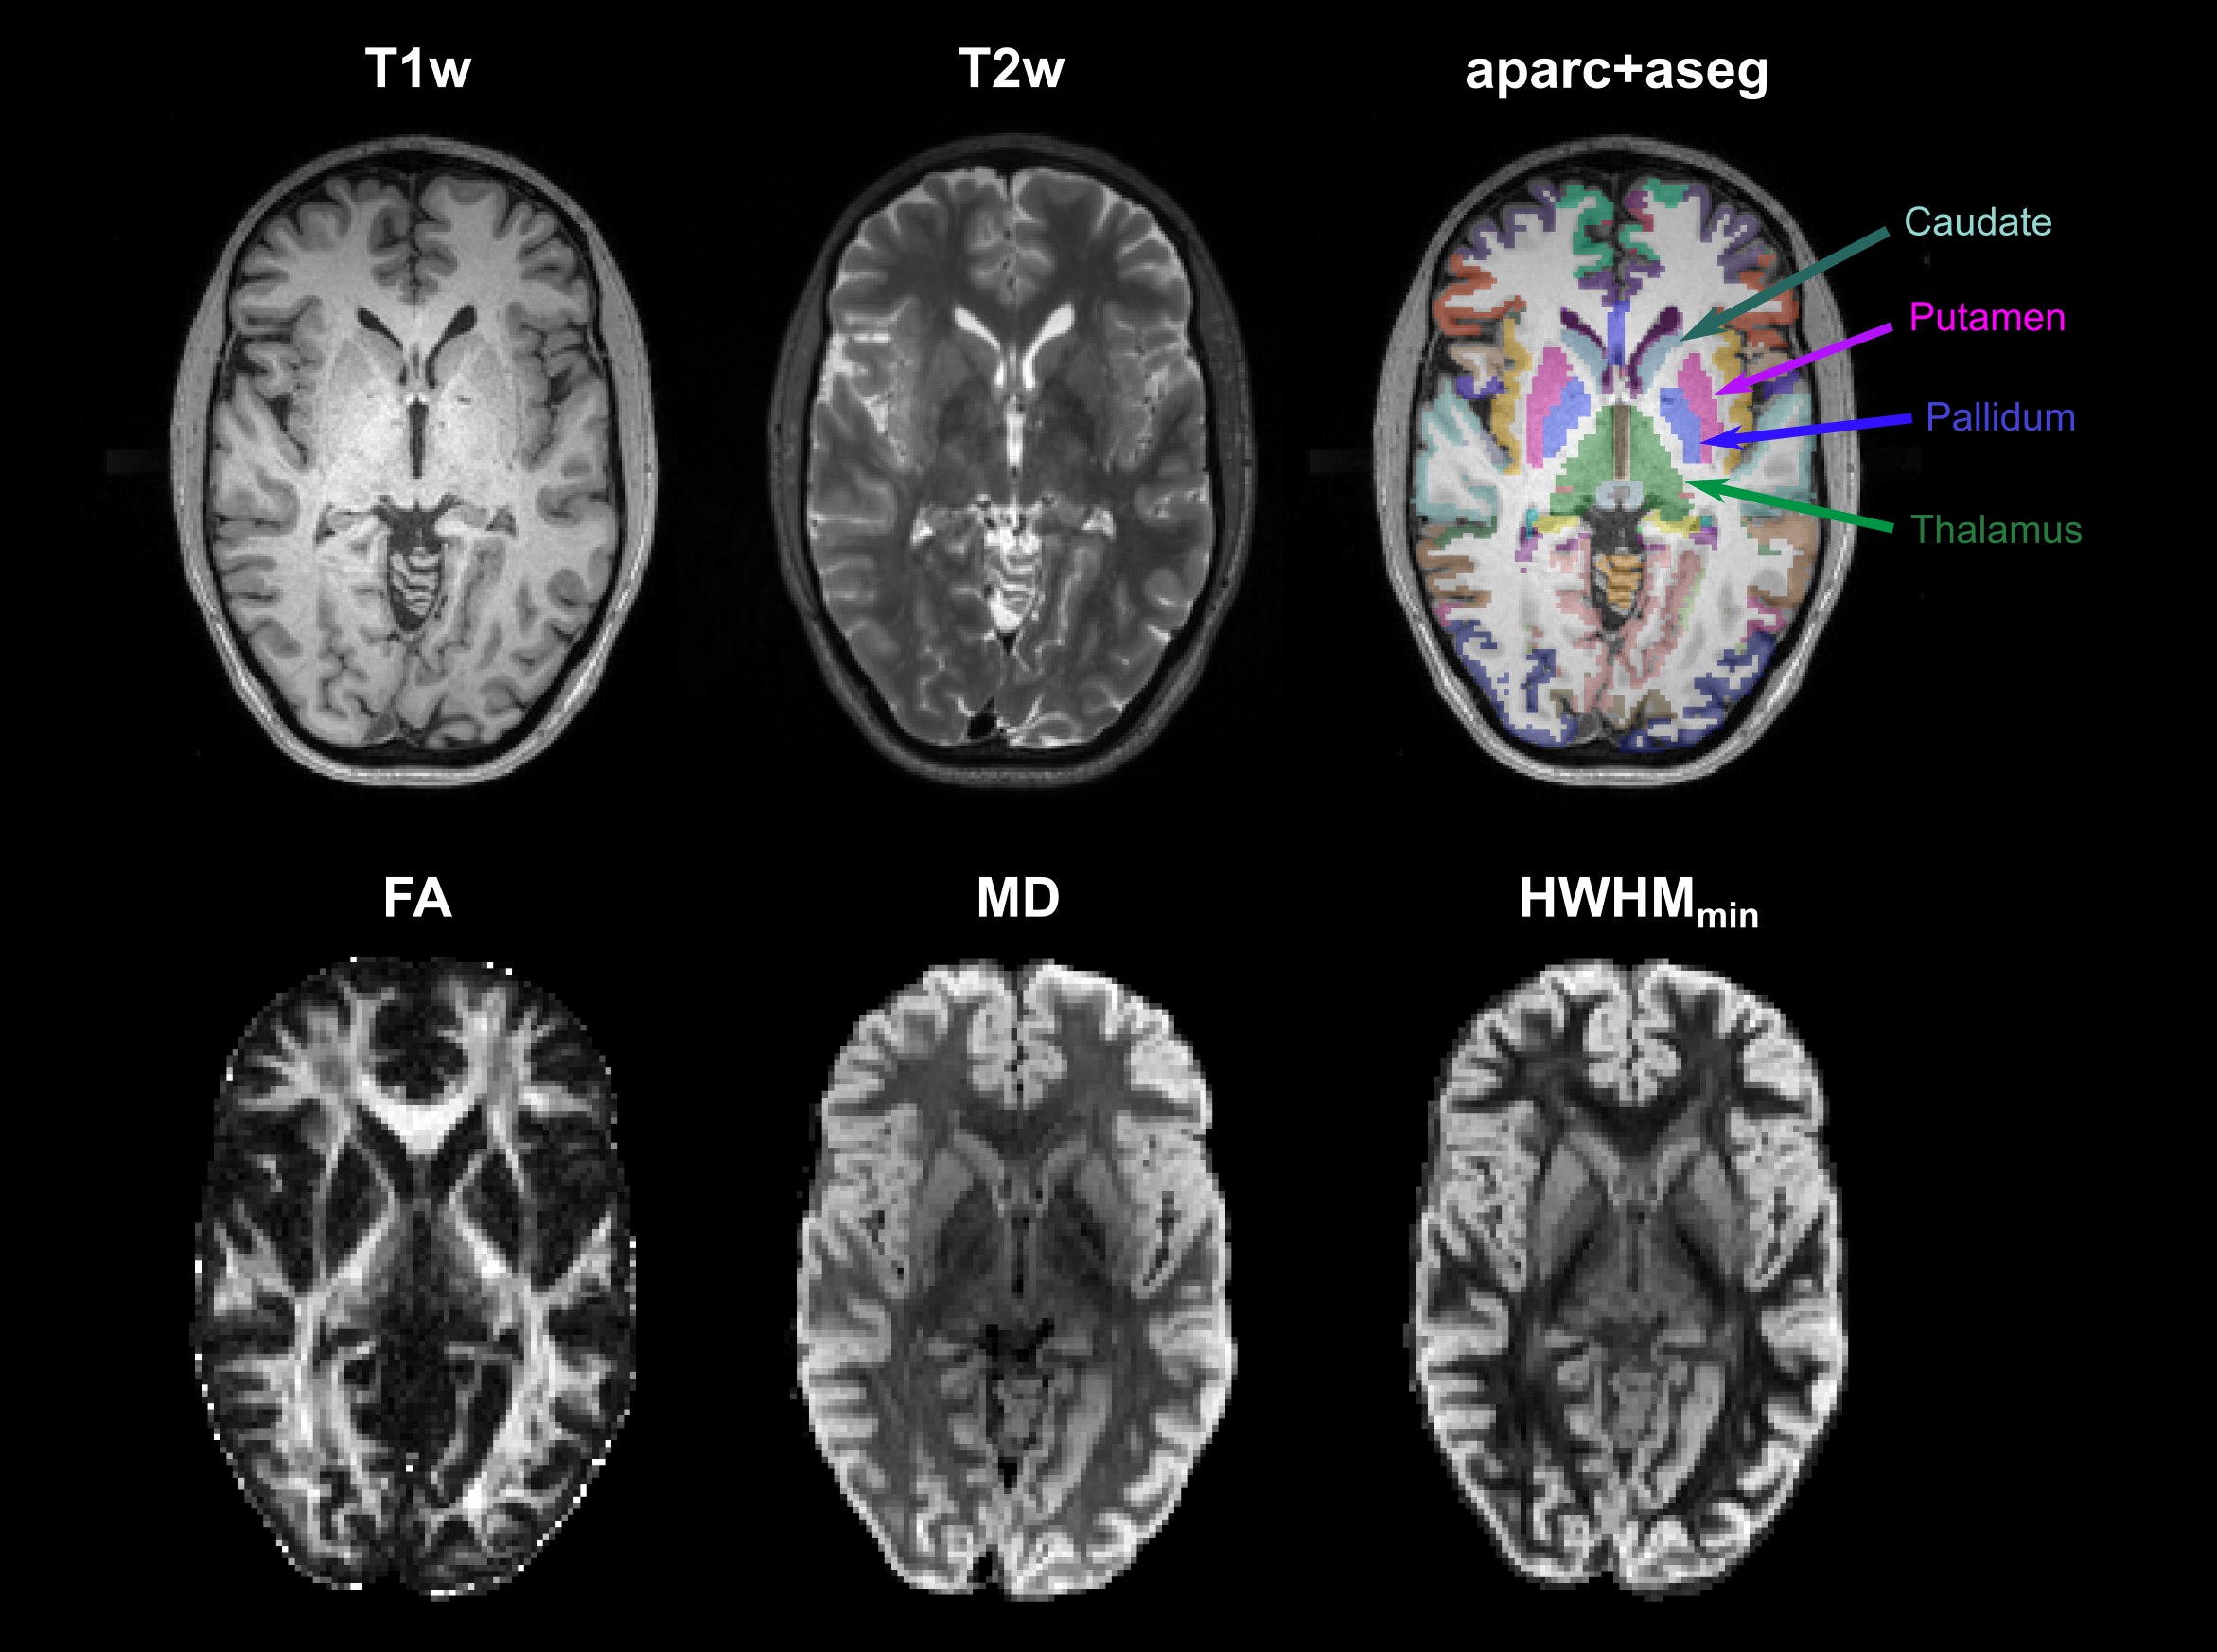
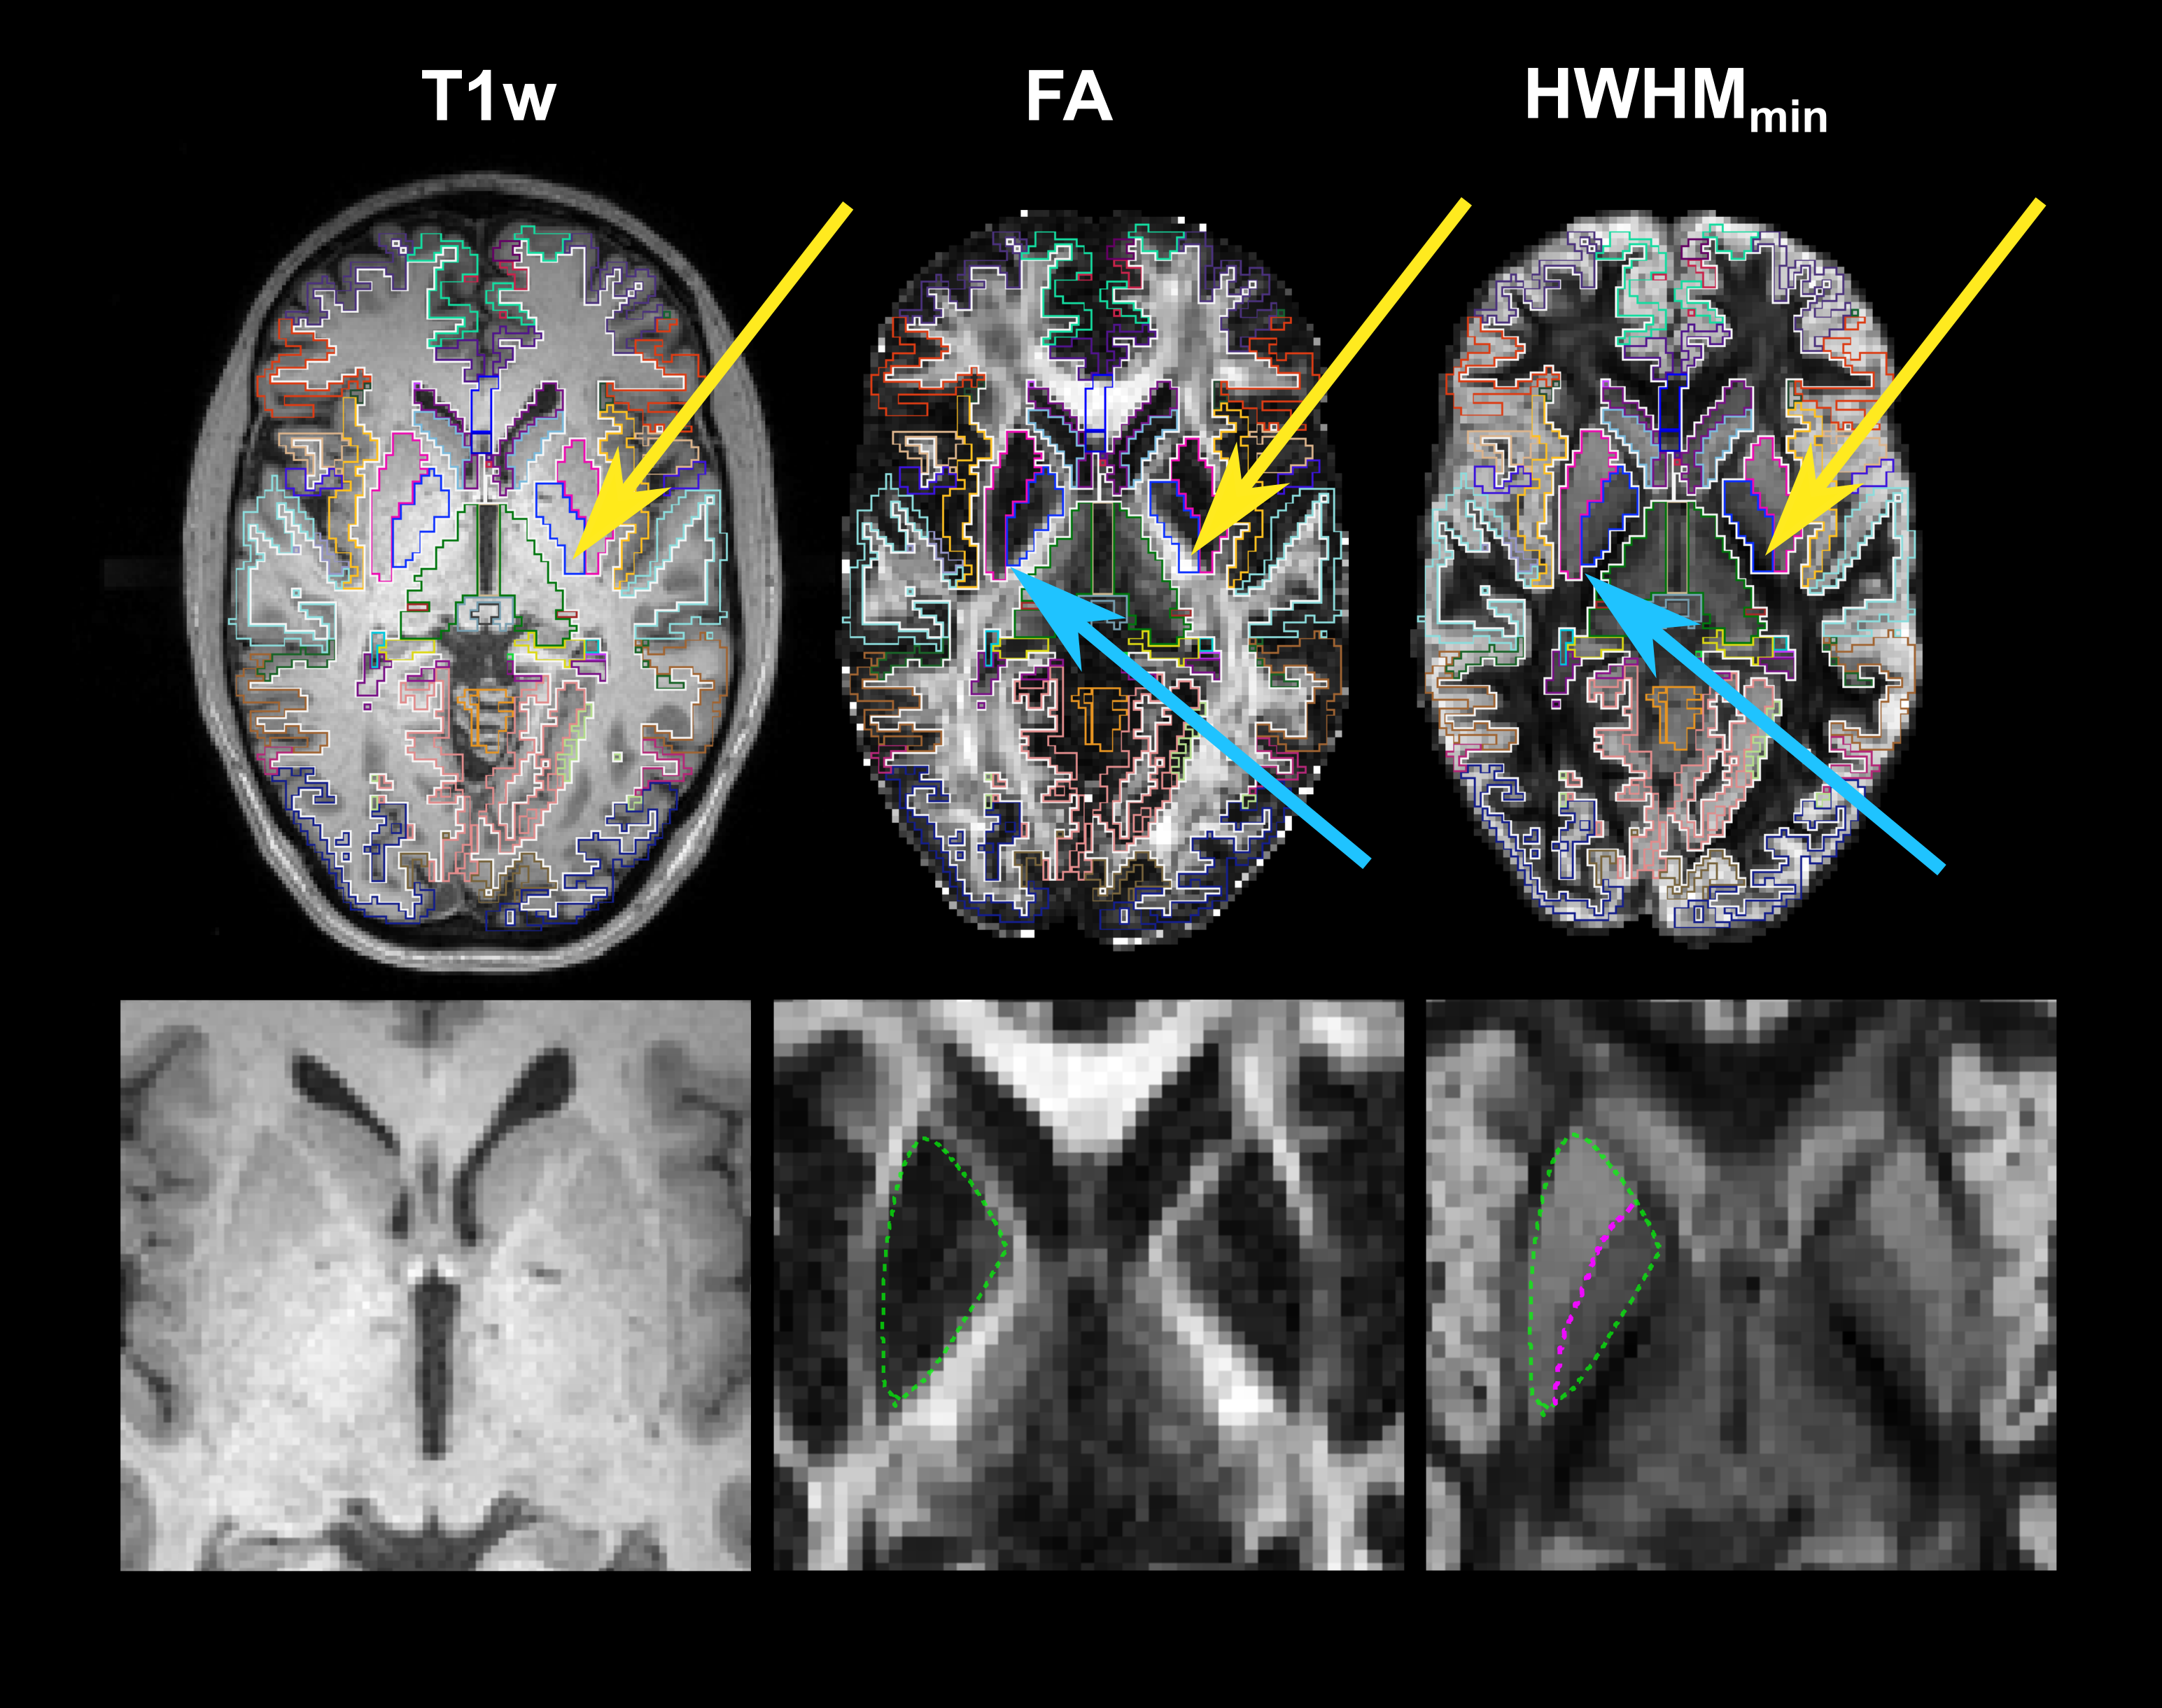
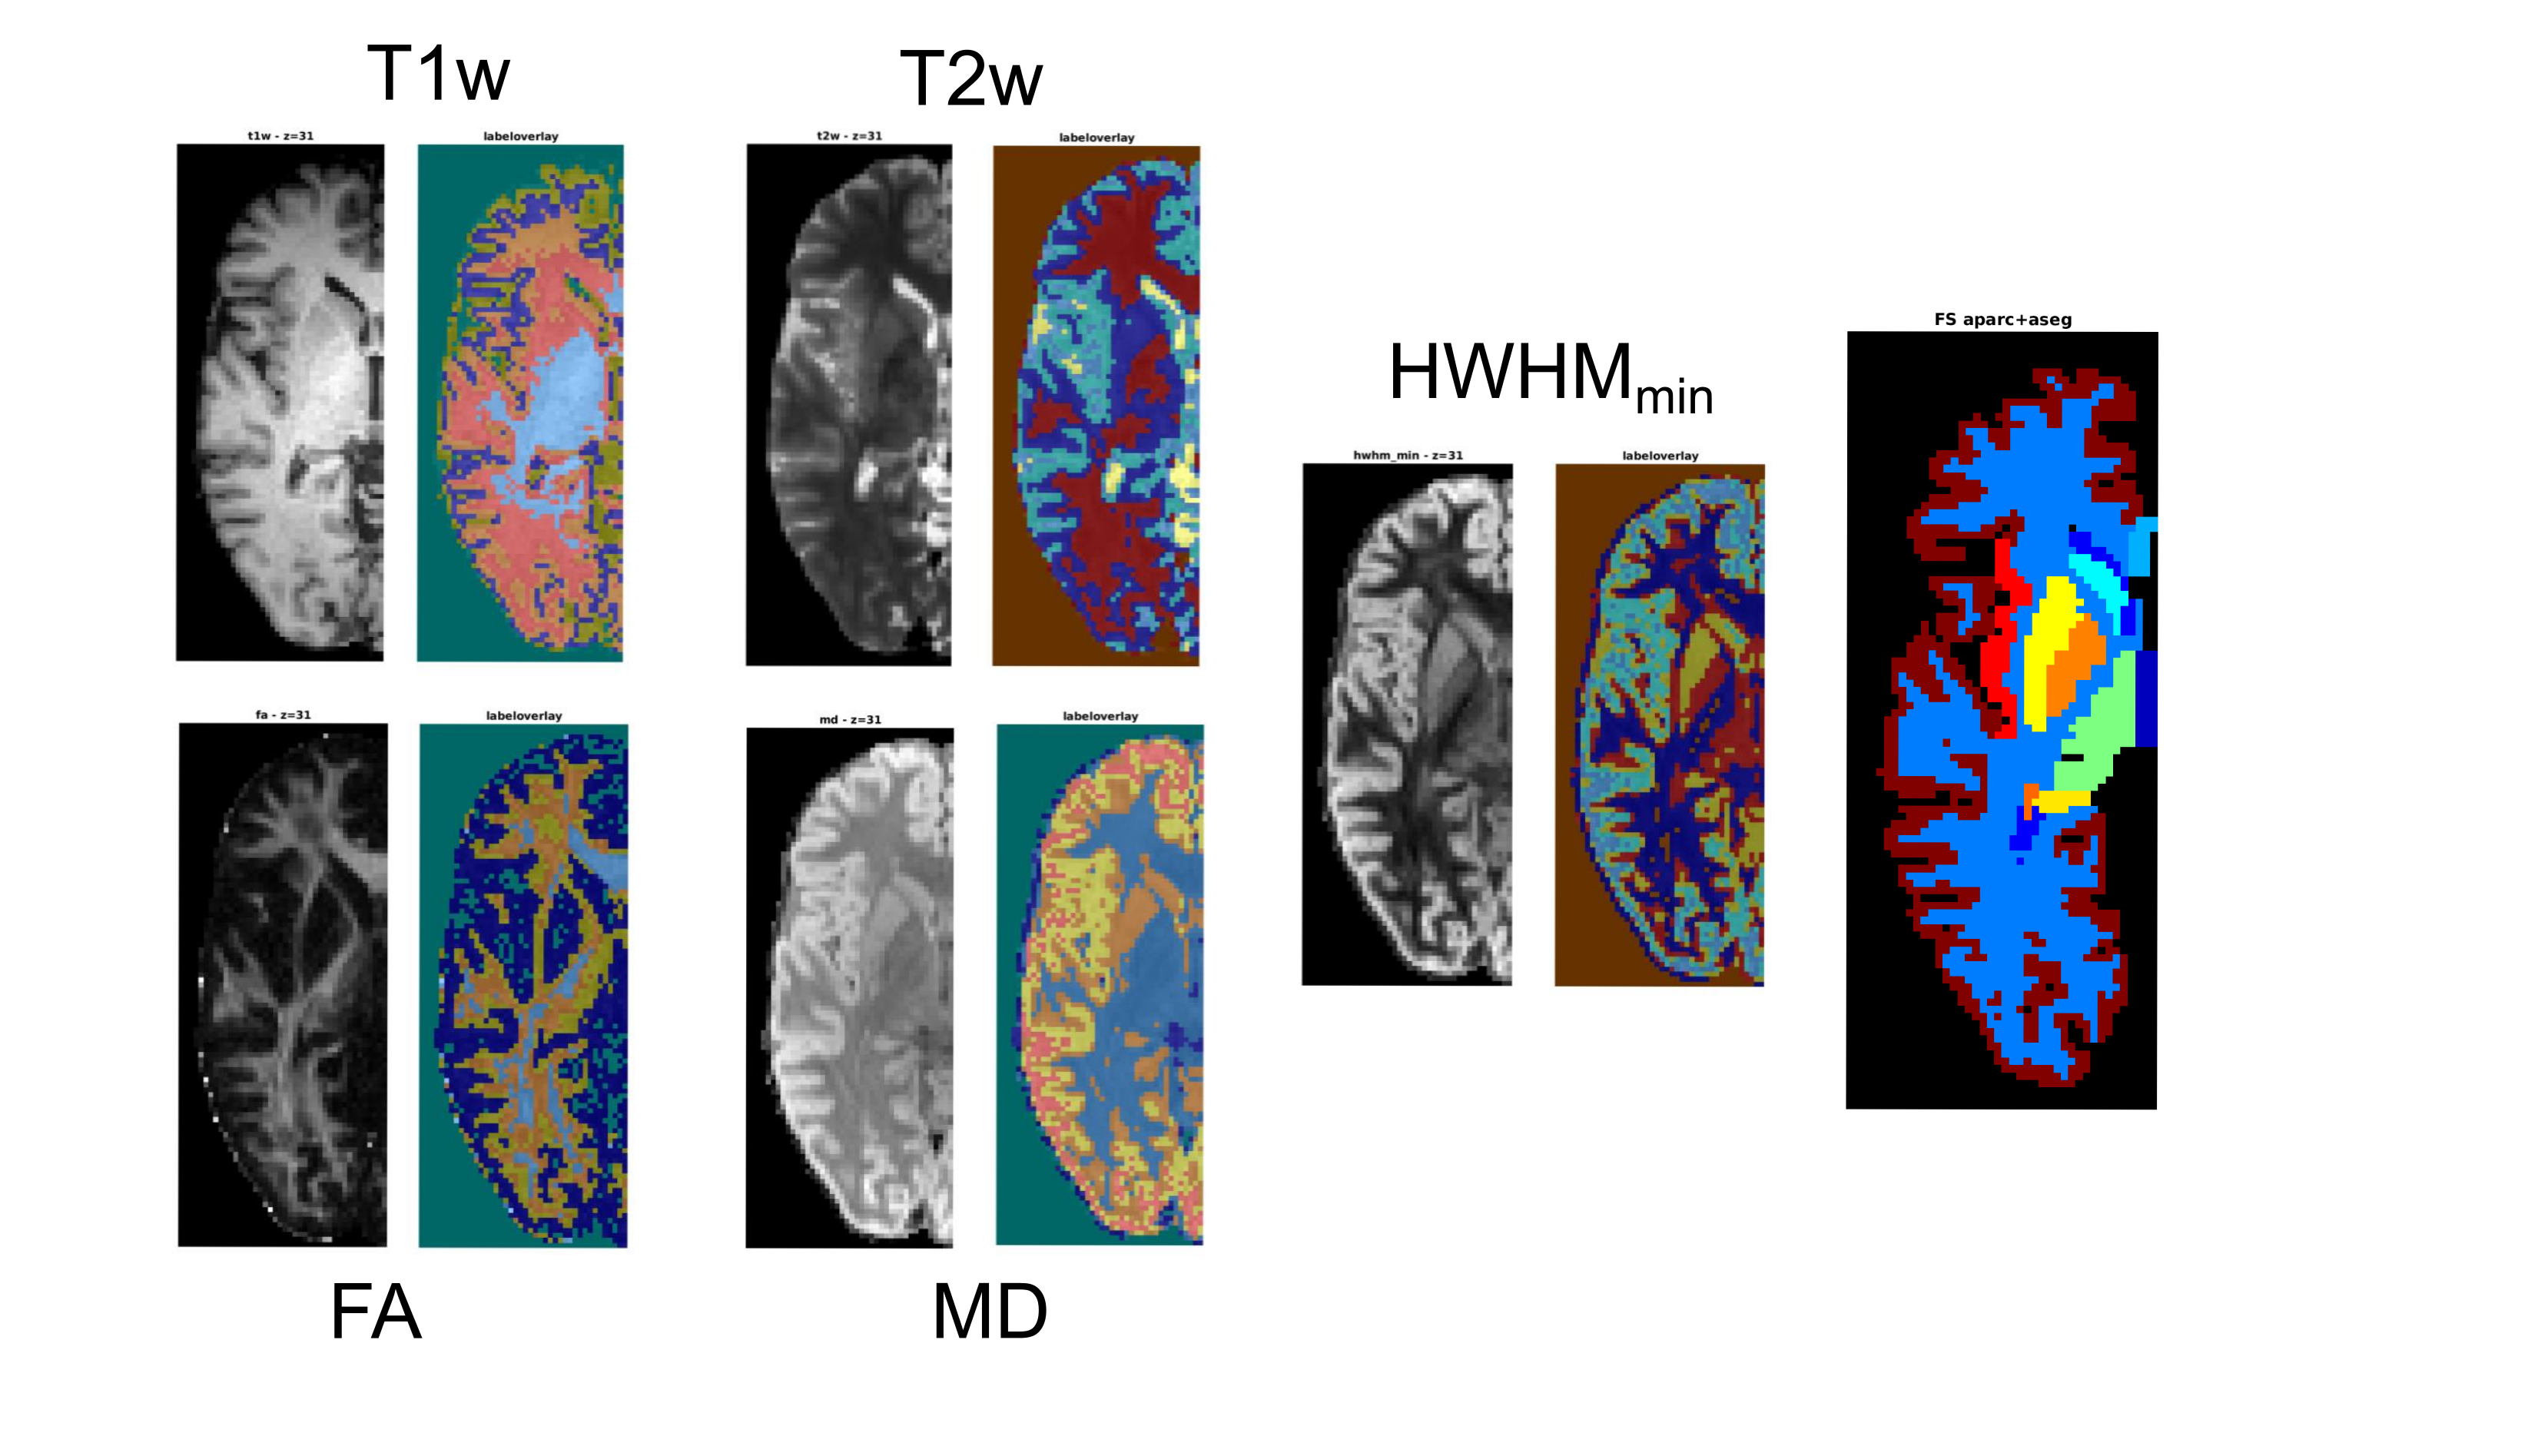
Figure 1 shows direction-averaged EAP profiles (left) and GAPs (right). Profiles are averaged within different tissue types, using FreeSurfer segmentation labels. Images of the profile values at 3 different displacements (dashed red lines) are also shown. Figure 2 compares direction-averaged EAP profiles (left) and GAPs (right) extracted from fully sampled (514-direction) DSI (top) and accelerated (171-direction) CS-DSI (bottom). Profiles are averaged within different subcortical structures, using FreeSurfer segmentation labels.Figure 3 shows an axial slice from the T1w, T2w, FA, MD, and HWHMmin maps, and the FreeSurfer segmentation. Figure 4 shows the T1w, FA, and HWHMmin images overlaid with outlines of FreeSurfer segmentation labels (top) and an enlarged view of the region containing the putamen and pallidum (bottom). Figure 5 shows results from the k-means clustering, with the input images on the left and the output cluster labels on the right.Discussion
The in vivo GAPs presented here exhibit similar trends as those in our previous ex vivo study5, despite the lower spatial resolution of the in vivo scans. Specifically, the in vivo GAPs exhibit the expected behavior across tissue types, with greater values in WM than GM and CSF (Figure 1). The GAPs are clearly different between subcortical structures, but similar for the same structure between hemispheres (Figure 2). The discrepancy between left/right pallidum may reflect an inaccuracy of the FreeSurfer segmentation, which sometimes oversegments the pallidum into the white matter (Figure 4). As seen in Figure 3, the T1w and T2w images show a clear boundary between the putamen and pallidum, but suffer from low contrast between the pallidum and white matter. The same is true in the MD map. The FA map shows no contrast between the putamen and pallidum, but good contrast between these structures and white matter. The HWHMmin map allows us to resolve both the boundary between the putamen and pallidum, and the boundary between these two structures and white matter. Figure 5 shows that, unlike other maps, the HWHMmin has sufficient contrast to delineate these structures based on a simple intensity-based clustering. (The FreeSurfer segmentation uses not only intensities but also prior anatomical information.)Conclusions
In this first in vivo demonstration, we show the potential of GAPs and direction-averaged EAP profiles for delineating boundaries between white matter and subcortical structures that can be difficult to resolve from T1w or T2w images. This can be performed equally well from an accelerated (12 min.) CS-DSI scan as from fully-sampled DSI.Acknowledgements
This work was funded by NIH Grants R01-EB021265, K99-EB023993, R01-AG057672, R01-EB019956, R01-EB017337, U01-EB025162, P41-EB030006, R03-EB031175, and U01-MH117023. It was carried out at the Athinoula A. Martinos Center for Biomedical Imaging at the Massachusetts General Hospital, using resources provided by the Center for Functional Neuroimaging Technologies, P41-EB015896, a P41 Biotechnology Resource Grant supported by the National Institute of Biomedical Imaging and Bioengineering (NIBIB), National Institutes of Health. This work also involved the use of instrumentation supported by the NIH Shared Instrumentation Grant Program (S10RR025563, S10RR023401, S10RR019307, and S10RR023043).References
[1] Zhang, F., Breger, A., Cho, K.I.K., Ning, L., Westin, C.F., O’Donnell, L.J. and Pasternak, O., 2021. Deep learning based segmentation of brain tissue from diffusion MRI. NeuroImage, 233, p.117934.
[2] Cheng, H., Newman, S., Afzali, M., Fadnavis, S.S. and Garyfallidis, E., 2020. Segmentation of the brain using direction-averaged signal of DWI images. Magnetic resonance imaging, 69, pp.1-7.
[3] Iglesias, J.E., Van Leemput, K., Golland, P. and Yendiki, A., 2019, June. Joint inference on structural and diffusion MRI for sequence-adaptive Bayesian segmentation of thalamic nuclei with probabilistic atlases. In International Conference on Information Processing in Medical Imaging (pp. 767-779). Springer, Cham.
[4] Ning, Lipeng, Carl-Fredrik Westin, and Yogesh Rathi. "Estimating diffusion propagator and its moments using directional radial basis functions." IEEE transactions on medical imaging 34.10 (2015): 2058-2078.
[5] R. Jones, Q. Tian, C. Maffei, J. Augustinack, A. Nummenmaa, S. Huang, and A. Yendiki. 2021. “Generalized anisotropy profiles distinguish cortical and subcortical structures in ex vivo diffusion MRI.” In ISMRM.
[6] Jones, R., Maffei, C., Augustinack, J., Fischl, B., Wang, H., Bilgic, B. and Yendiki, A., 2021. High-fidelity approximation of grid-and shell-based sampling schemes from undersampled DSI using compressed sensing: Post mortem validation. NeuroImage, 244, p.118621.
[7] Bilgic, B., Chatnuntawech, I., Setsompop, K., Cauley, S.F., Yendiki, A., Wald, L.L. and Adalsteinsson, E., 2013. Fast dictionary-based reconstruction for diffusion spectrum imaging. IEEE transactions on medical imaging, 32(11), pp.2022-2033.
[8] Setsompop, K., Kimmlingen, R., Eberlein, E., Witzel, T., Cohen-Adad, J., McNab, J.A., Keil, B., Tisdall, M.D., Hoecht, P., Dietz, P. and Cauley, S.F., 2013. Pushing the limits of in vivo diffusion MRI for the Human Connectome Project. Neuroimage, 80, pp.220-233.
[9] Keil, B., Blau, J.N., Biber, S., Hoecht, P., Tountcheva, V., Setsompop, K., Triantafyllou, C. and Wald, L.L., 2013. A 64‐channel 3T array coil for accelerated brain MRI. Magnetic resonance in medicine, 70(1), pp.248-258.
[10] Wedeen, V.J., Wang, R.P., Schmahmann, J.D., Benner, T., Tseng, W.Y.I., Dai, G., Pandya, D.N., Hagmann, P., D'Arceuil, H. and de Crespigny, A.J., 2008. Diffusion spectrum magnetic resonance imaging (DSI) tractography of crossing fibers. Neuroimage, 41(4), pp.1267-1277.
[11] Veraart, J., Novikov, D.S., Christiaens, D., Ades-Aron, B., Sijbers, J. and Fieremans, E., 2016. Denoising of diffusion MRI using random matrix theory. Neuroimage, 142, pp.394-406.
[12] Smith, S.M., Jenkinson, M., Woolrich, M.W., Beckmann, C.F., Behrens, T.E., Johansen-Berg, H., Bannister, P.R., De Luca, M., Drobnjak, I., Flitney, D.E. and Niazy, R.K., 2004. Advances in functional and structural MR image analysis and implementation as FSL. Neuroimage, 23, pp.S208-S219.
[13] Andersson, J.L. and Sotiropoulos, S.N., 2016. An integrated approach to correction for off-resonance effects and subject movement in diffusion MR imaging. Neuroimage, 125, pp.1063-1078.
[14] Tian, Q., Yang, G., Leuze, C., Rokem, A., Edlow, B.L. and McNab, J.A., 2019. Generalized diffusion spectrum magnetic resonance imaging (GDSI) for model-free reconstruction of the ensemble average propagator. Neuroimage, 189, pp.497-515.
[15] Fischl, B., Salat, D.H., Busa, E., Albert, M., Dieterich, M., Haselgrove, C., Van Der Kouwe, A., Killiany, R., Kennedy, D., Klaveness, S. and Montillo, A., 2002. Whole brain segmentation: automated labeling of neuroanatomical structures in the human brain. Neuron, 33(3), pp.341-355.
[16] Greve, D.N. and Fischl, B., 2009. Accurate and robust brain image alignment using boundary-based registration. Neuroimage, 48(1), pp.63-72.
Figures