0161
Macromolecule modelling for improved metabolite quantification using very short echo time MRS at 3T: The PRaMM model1Charité – Universitätsmedizin Berlin, corporate member of Freie Universität Berlin and Humboldt- Universität zu Berlin, Department of Neuroradiology, Berlin, Germany, 2Physikalisch-Technische Bundesanstalt (PTB), Braunschweig und Berlin, Germany, 3Charité – Universitätsmedizin Berlin, corporate member of Freie Universität Berlin and Humboldt-Universität zu Berlin, Department of Neurology, Berlin, Germany, 4Charité – Universitätsmedizin Berlin, corporate member of Freie Universität Berlin and Humboldt-Universität zu Berlin, NeuroCure Clinical Research, Berlin, Germany
Synopsis
The accurate quantification of ultra-short echo-time 1H-MRS spectra is challenging due to broad macromolecular (MM) signal components. Here, we propose the parameterized-ratio MM (PRaMM) method to model the MM and its use in linear-combination model fitting of 1H-MRS spectra. The PRaMM method uses ratios of MM signal amplitudes as soft-constraints to limit the degrees of freedom of the fitting model, while allowing for more flexibility than commonly used approaches. The suggested model is demonstrated to improve the quantification of metabolites compared to two common methods for MM treatment.
Introduction
While short echo times in proton MRS are desirable, due to reduced relaxation and j-coupling effects, they come at the cost of increased broad macromolecule (MM) signals underlying the spectrum1. The proper quantification of metabolites in such spectra is a particularly challenging task2,3.A common approach for metabolite quantification is the so-called linear-combination modelling, in which basis-functions containing the spectral signature of metabolites are linearly combined to fit the data2. To consider MMs, often metabolite-nulled (MN) spectra are acquired, averaged across a few subjects and used as an additional basis-function3. While the inclusion as a single-component model (SCM) lacks the flexibility required for cases with altered MM ratios, individually modelled MM signals increase the degrees of freedom of the model so much that it may lose its biochemical meaning4. To avoid overfitting, previous studies introduced soft-constraints based on prior knowledge5. In some cases, an individual subtraction (IMNS) method is employed, where a MN spectrum is acquired for each subject of a cohort, which is then subtracted from the metabolite spectrum6. However, this does not only require additional scan time, but also potentially corrupts the metabolite quantification, as perfect metabolite-nulling is difficult to achieve.
This study aims to develop a parametrized-ratio MM (PRaMM) model, where the MM peaks are modelled individually, and their ratios are used as soft-constraints. The model is finally validated and tested by comparison with an SCM and an IMNS approach.
Methods
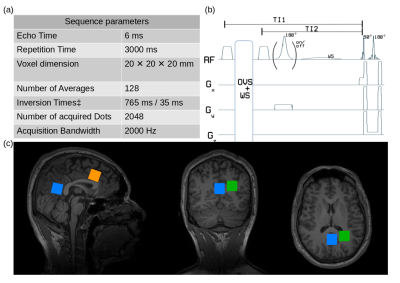
Data Acquisition. All measurements were performed on a 3T system (Verio, Siemens Healthineers, Erlangen, Germany) with a 32-channel receiver head coil.A double-inversion recovery (DIR) module using WURST7-inversion pulses, was implemented previous to a spin echo full intensity acquired localization (SPECIAL)8 scheme for acquisition of MN spectra.
Six healthy volunteers (45±14y, 4f) were examined, according to local ethical regulations. Previous to MRS measurements, MPRAGE9 images were acquired for voxel positioning, and voxel-based 2nd-order B0-shimming with FAST(EST)MAP10,11 and B1-calibration was performed. Inversion times for the DIR acquisition were optimized for in vivo application in the first volunteer. Finally, SPECIAL and DIR-SPECIAL (Fig.1) were performed in one, two, or three voxels in each volunteer (Fig.1), resulting in a total of 14 data sets.
Preprocessing. Spectra were post-processed including summation of odd and even transients for full localization, frequency correction, phase correction, weighted coil combination, and averaging with the Suspect12 Python library. Spectral quantification and modelling was performed in LCModel13.
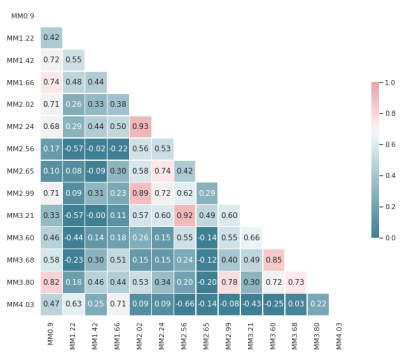
PRaMM Model. MM spectra of four volunteers were averaged for the different regions and used to optimize a basis-set comprising 14 MM peaks and the 3.9ppm creatine (tCr) signal. Subsequently, individual MN spectra were fitted with the obtained basis-set, and the MM amplitudes were tested for correlations. Ratios of highly correlated MM peaks (r>0.70) were then used as soft-constraints in LCModel.
Comparison. The developed PRaMM model, an SCM and an IMNS approach were used for the quantification of all spectra. Four comparison metrics were defined: 1) the fit-quality number (FQN) defined as the ratio of the residual variance of each fit and the pure noise variance2; 2) the signal-to-noise ratio (SNR) defined as the ratio of the maximum in the frequency domain minus the baseline to twice the residual noise13 3) metabolite concentrations; and 4) the relative Cramér-Rao lower bounds (CRLB%). Friedman chi-square and Wilcoxon signed-rank tests were used for group and post-hoc comparisons, respectively. p<0.05 was considered significant. Bonferroni correction was applied where necessary.
Results and Discussion
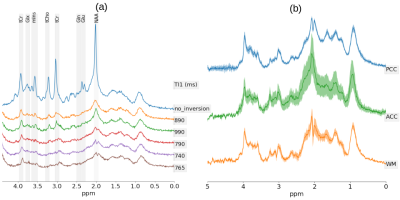
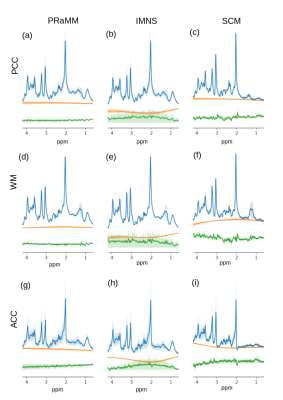
An example metabolite spectrum and MN spectra acquired at different inversion times (TI) are displayed in Fig.2a. Optimal inversion times were TI1/TI2=765ms/35ms (Fig.1). The averaged MN spectra for the three different brain regions used as a basis to derive the PRaMM model are depicted in Fig.2b. Quantification of MN spectra led to 15 highly correlated couples of MM amplitudes (Fig.3) of which the magnitude ratios were subsequently used as soft-constraints in the PRaMM model. The correlations can be partially explained by the assignment of the respective resonances to the same amino acid1,14,15.The PRaMM model resulted in a flatter baseline and lower residual than both reference methods (Fig.4). Furthermore, the PRaMM model results in a significantly lower FQN and higher SNR than the SCM and IMNS method (Fig.5). It should be noted that the resonances of NAA and Ins overlap with major MM signals, and hence a larger impact of the MM treatment on their quantification is expected, compared to other metabolites. Furthermore, a significant reduction of CRLBs% was found for Ins, while a significant increase in CRLBs% was found for NAA. Counterintuitively, this increase in CRLBs% is likely related to the underestimation of the uncertainty of NAA concentrations linked to inadequate MM treatment as found by Elster et al.16, and hence presents an improvement of the quantification.
Conclusion
This work presents the development of the PRaMM model for MM signals for the quantification of proton-MRS spectra, using soft-constraints based on the ratio of correlated MM signal amplitudes. It was demonstrated that the suggested model improves the quantification of metabolite signals in in-vivo proton MRS compared to commonly used approaches.Acknowledgements
This project (15HLT04 - NeuroMET and 18HLT09 - NeuroMET2) has received funding from the EMPIR program co-financed by the Participating States and from the European Union’s Horizon 2020 research and innovation program. This paper reflects only the author's view and EURAMET is not responsible for any use that may be made of the information it contains.References
1. Ioannis-Angelos Giapitzakis, Nikolai Avdievich, and Anke Henning. “Characterization ofmacromolecular baseline of human brain using metabolite cycled semi-LASER at 9.4T”. In:Magnetic Resonance in Medicine 80.2 (Aug. 2018), pp. 462–473. doi: 10.1002/mrm.27070.url: http://doi.wiley.com/10.1002/mrm.27070.
2. Jamie Near et al. “Preprocessing, analysis and quantification in single-voxel magnetic res-onance spectroscopy: experts’ consensus recommendations”. In: NMR in Biomedicine (Feb.2020), e4257. doi: 10.1002/nbm.4257.
3. Považan, M., Hangel, G., Strasser, B., Gruber, S., Chmelik, M., Trattnig, S., & Bogner, W. (2015). Mapping of brain macromolecules and their use for spectral processing of 1H-MRSI data with an ultra-short acquisition delay at 7 T. Neuroimage, 121, 126-135.
4. Cudalbu, C., Behar, K. L., Bhattacharyya, P. K., Bogner, W., Borbath, T., de Graaf, R. A., ... & Mlynárik, V. (2021). Contribution of macromolecules to brain 1H MR spectra: Experts' consensus recommendations. NMR in Biomedicine, 34(5), e4393.
5. Heckova, E., Považan, M., Strasser, B., Motyka, S., Hangel, G., Hingerl, L., ... & Bogner, W. (2020). Effects of different macromolecular models on reproducibility of FID‐MRSI at 7T. Magnetic resonance in medicine, 83(1), 12-21.
6. Kassem, M. N., & Bartha, R. (2003). Quantitative proton short‐echo‐time LASER spectroscopy of normal human white matter and hippocampus at 4 Tesla incorporating macromolecule subtraction. Magnetic Resonance in Medicine: An Official Journal of the International Society for Magnetic Resonance in Medicine, 49(5), 918-927.
7. Kupce, E., and R. Freeman. 1995. “Adiabatic Pulses for Wideband Inversion and Broadband Decoupling.” Journal of Magnetic Resonance. Series A 115 (2): 273–76.
8. Mekle, Ralf, Vladimír Mlynárik, Giulio Gambarota, Martin Hergt, Gunnar Krueger, and Rolf Gruetter. 2009. “MR Spectroscopy of the Human Brain with Enhanced Signal Intensity at Ultrashort Echo Times on a Clinical Platform at 3T and 7T.” Magnetic Resonance in Medicine: Official Journal of the Society of Magnetic Resonance in Medicine / Society of Magnetic Resonance in Medicine 61 (6): 1279–85.
9. Mugler III, J. P., & Brookeman, J. R. (1990). Three‐dimensional magnetization‐prepared rapid gradient‐echo imaging (3D MP RAGE). Magnetic resonance in medicine, 15(1), 152-157.
10. Gruetter, R., and I. Tkác. 2000. “Field Mapping without Reference Scan Using Asymmetric Echo-Planar Techniques.” Magnetic Resonance in Medicine: Official Journal of the Society of Magnetic Resonance in Medicine / Society of Magnetic Resonance in Medicine 43 (2): 319–23.
11. Gruetter, R. (1993) Automatic, Localized in Vivo Adjustment of All First-And Second-Order shim coils. Magnetic Resonance in Medicine, 29, 804-811.
12. Benny Rowland. “ESMRMB 2017, 34th Annual Scientific Meeting, Barcelona, ES, October19-October 21: Electronic Posters / Paper Posters / Clinical Review Posters / SoftwareExhibits”. In: Magnetic Resonance Materials in Physics, Biology and Medicine 30.1 (2017),pp. 501–692. doi: 10.1007/s10334-017-0635-y. url: https://doi.org/10.1007/s10334-017-0635-y
13. S.W. Provencher. “Estimation of metabolite concentrations from localized in vivo protonNMR spectra”. In: Magnetic resonance in medicine 30 (Jan. 1994), pp. 672–9.
14. Behar, K. L., D. L. Rothman, D. D. Spencer, and O. A. Petroff. 1994. “Analysis of Macromolecule Resonances in 1H NMR Spectra of Human Brain.” Magnetic Resonance in Medicine: Official Journal of the Society of Magnetic Resonance in Medicine / Society of Magnetic Resonance in Medicine 32 (3): 294–302.
15. Behar, K. L., and T. Ogino. 1993. “Characterization of Macromolecule Resonances in the 1H NMR Spectrum of Rat Brain.” Magnetic Resonance in Medicine: Official Journal of the Society of Magnetic Resonance in Medicine / Society of Magnetic Resonance in Medicine 30 (1): 38–44.
16. Clemens Elster et al. “Quantitative magnetic resonance spectroscopy: Semi-parametric mod-eling and determination of uncertainties”. In: Magnetic resonance in medicine 53 (June 2005),pp. 1288–96. doi: 10.1002/mrm.20500.
Figures


