0158
Renal fibrosis investigated by in vivo multifrequency MR elastography in a rat model of chronic kidney disease.1Department of Radiology, Charité Universitätsmedizin Berlin, Berlin, Germany, 2Department of Veterinary Pathology, Free University of Berlin, Berlin, Germany, 3Institute of Medical Informatics, Charité Universitätsmedizin Berlin, Berlin, Germany
Synopsis
Using in vivo tomoelastography and multiparametric MRI (mp-MRI) we investigated kidneys of 10 rats with adenine-induced chronic kidney disease (CKD) and 8 healthy controls. In CKD rats, increased kidney volume, shear wave speed (SWS, related to stiffness) and wave penetration rate (related to inverse viscosity) were observed, while water diffusivity was reduced. These imaging findings were correlated with histopathologically quantified renal fibrosis. Our results suggested that collagen accumulation during CKD progression transforms soft-compliant renal tissue into a more rigid-solid state with reduced water mobility and shows that tomoelastography is a promising tool for non-invasive monitoring of disease progression.
Introduction
Chronic kidney disease (CKD) is characterized by structural changes such as tubular atrophy, tubulointerstitial fibrosis and glomerulosclerosis1. Renal fibrosis is considered to be an important biomarker of disease progression2. In vivo multiparametric magnetic resonance imaging (mpMRI) including tomoelastography was used to characterize renal fibrosis through quantitative biophysical properties. Tomoelastography has been previously applied to patients with CKD3, 4, however, it has not yet been used in rats where histopathologic features of the renal extracellular matrix can be examined. Rat model with dietary adenine intake mimics the chronic changes in disease progression, showing gradual loss of renal and cardiovascular function5. Therefore, we developed renal tomoelastography, an advanced multifrequency MRE technique based on wave-number inversion6, for examining rat kidneys in vivo on a clinical 3-T MRI scanner. Combining in vivo imaging and ex vivo histopathology, we aim to identify biomechanical and biophysical parameters that correlate with renal pathologic features during CKD progression.Methods
For in vivo imaging, ten male Wistar rats received 0.3%-adenine diet for 8±1 weeks and 8 age-matched rats as healthy controls were anaesthetized using Isoflurane air/O2. MRI examinations were performed on 3-T clinical MRI-scanner (Simens-Lumina) with a 18-channel-knee coil with the rats placed in supine position. The setup for the tomoelastography is showed in Figure 1, mechanical vibration was generated with two pressure pads powered by compressed air. Mechanical vibrations of 160-200Hz were excited and acquired sequentially. The 3-dimensional wave field was acquired with a single-shot spin-echo echo-planar sequence at eight wave dynamics7. Tomoelastography was performed suing 15 coronal-slices with voxel size of 1.0x1.0x1.5mm³, FOV of 120x96mm², TR of 2590ms, TE of 62ms. Tomoelastography data were processed using multifrequency wave-number inversion6 with Gaussian smoothing kernel size reduced to 1mm. In additional to tomoelastography, turbo-spin-echo T2w (21 coronal-slices, voxel size=0.5x0.5x2.0mm³, FOV=120x120mm², TR=2000ms, TE=51ms) as well as diffusion-weighted-imaging (DWI) (15 coronal-slices, voxel size= 2.0x2.0x2.0mm³, FOV 128x104mm², TR 2000ms, TE 61ms, 4-b-values 0/50/400/800s/mm²) were performed. For imaging data, regions of interest (ROIs) were delineated using ITK-SNAP8 and analyzed using algorithms written in MATLAB (The Mathwork Inc., Natick, MA, USA). Kidney volume was calculated using T2w images by multiplying the number of kidney-containing voxels by image voxel size.After in vivo imaging, rat were euthanized and the kidneys harvested for histology. Histological analysis was performed on 3µm sections stained with hematoxylin and eosin (H&E) and sirius red (SR). Based on SR-staining, collagen-area-fraction (CAF) was quantified using the fibrosis tool (http://dev.mri.cnrs.fr/projects/imagej-macros/wiki/Fibrosis_Tool) in ImageJ software9.
Statistical analysis was performed with GraphPad Prism (GraphPad-Software, San Diego, California USA). Differences in parameters between groups were analyzed using t-test. Relationships between data were assessed by Pearson correlation. p<0.05 was considered significant.
Results
Figure 2 shows representative in vivo MR images of diseased and healthy kidneys, with c-map representing stiffness, a-/ wave penetration rate-map representing inverse viscosity and ADC representing water diffusivity.In comparison with the controls, a significant increase in kidney volume (2224± 971 vs. 1332±263mm³, p=0.023) and renal stiffness (c: 2.51±0.22 vs. 2.23±0.24m/s, p=0.019) was observed in CKD rats which was accompanied by reduction in renal viscosity (a: 1.64±0.18 vs. 1.32±0.19, p=0.002) and water diffusivity (ADC: 1.22±2.01 vs. 1.52±2.07 x10⁻³mm²/s, p=0.007), shown in Figure 3. Based on H&E and SR straining, tubule dilation with adenine crystal depositions and collagen accumulation are visible in the renal tissue of CKD rat (Figure 4). Histology-derived CAF was higher in the CKD than the control group (26.86±5.29% vs. 1.45±0.34%, p≤0.001). Using pooled data from CKD and control groups, CAF showed significant correlations with c (r=0.61, p≤0.01), with a (r=0.72, p≤0.01), and with ADC (r=-0.51, p≤0.05).
Discussion
This is the first in vivo renal tomoelastography application in a CKD rat model. Our findings suggested that increased c and a in diseased rats primarily correlated with interstitial fibrosis – a central pathological feature of CKD10, consistent with data shown in patients with CKD up to stage 4 where stiffness increase was associated with fibrosis progression1. Similar to data obtained in collagen phantoms11 and liver fibrogenesis12, densely packed and cross-linked collagen in fibrotic kidney could lead to the observed increase in wave penetration. These observations indicate that the kidney mechanically transforms into a more rigid-solid state due to fibrosis in our CKD model.Other factors could also contribute to changes in renal biomechanical properties. As reported in patients with advanced CKD, renal hypoperfusion reduced stiffness which in turn masked fibrosis1, 4. Our data suggested that kidney softening associated with hypoperfusion could be compensated by accumulation of adenine crystals. While human kidneys atrophy in advanced CKD4, in our model, dilated tubules in response to crystals occlusion led to significant renal volume increase and the consequent elevation in intraluminal and interstitial pressure, which could contribute to renal stiffening 13, 14.
Reduced water diffusivity observed in CKD rats reflected restricted water mobility due to collagen accumulation in the interstitial space 15, 16. It could also be due to compromised perfusion and tubular flow during CKD progression, as reported previously17.
Conclusion
Our study demonstrated that during CKD progression, renal tissue transformed into a more solid state as a result of collagen accumulation and tomoelastography is useful in noninvasively assessing disease progression, proving biomechanical properties that are sensitive to different CKD pathologic features.Acknowledgements
We acknowledge support from the German Research Foundation (DFG)- SFB1340 Matrix in Vision and BIOQIC; and the excellent cooperation with the Central Biobank Charité (ZeBanC) which was responsible for digitalization of the histological slides.References
1. Han, J.H., J.-H. Ahn, and J.-S. Kim, Magnetic resonance elastography for evaluation of renal parenchyma in chronic kidney disease: a pilot study. La radiologia medica, 2020. 125(12): p. 1209-1215.
2. Gewin, L., R. Zent, and A. Pozzi, Progression of chronic kidney disease: too much cellular talk causes damage. Kidney Int, 2017. 91(3): p. 552-560.
3. Marticorena Garcia, S.R., et al., Full-Field-of-View Time-Harmonic Elastography of the Native Kidney. Ultrasound Med Biol, 2018. 44(5): p. 949-954.
4. Marticorena Garcia, S.R., et al., Multifrequency Magnetic Resonance Elastography for the Assessment of Renal Allograft Function. Invest Radiol, 2016. 51(9): p. 591-5.
5. Diwan, V., L. Brown, and G.C. Gobe, Adenine-induced chronic kidney disease in rats. Nephrology (Carlton), 2018. 23(1): p. 5-11.
6. Tzschatzsch, H., et al., Tomoelastography by multifrequency wave number recovery from time-harmonic propagating shear waves. Med Image Anal, 2016. 30: p. 1-10.
7. Dittmann, F., et al., Tomoelastography of the prostate using multifrequency MR elastography and externally placed pressurized-air drivers. Magn Reson Med, 2018. 79(3): p. 1325-1333.
8. Yushkevich, P.A., et al., User-guided 3D active contour segmentation of anatomical structures: significantly improved efficiency and reliability. Neuroimage, 2006. 31(3): p. 1116-28.
9. Schneider, C.A., W.S. Rasband, and K.W. Eliceiri, NIH Image to ImageJ: 25 years of image analysis. Nature methods, 2012. 9(7): p. 671-675.
10. Cogan, M.G., Medical Staff Conference. Tubulo-interstitial nephropathies--a pathophysiologic approach. The Western journal of medicine, 1980. 132(2): p. 134-140.
11. Sauer, F., et al., Collagen networks determine viscoelastic properties of connective tissues yet do not hinder diffusion of the aqueous solvent. Soft Matter, 2019. 15(14): p. 3055-3064.
12. Sack, I., et al., Structure-sensitive elastography: On the viscoelastic powerlaw behavior of in vivo human tissue in health and disease. Soft Matter, 2013. 9: p. 5672-5680.
13. Hirsch, S., J. Braun, and I. Sack, Magnetic Resonance Elastography - Physical Background And Medical Applications. 2017.
14. Gilmer, G.G., et al., Flow resistance along the rat renal tubule. Am J Physiol Renal Physiol, 2018. 315(5): p. F1398-f1405.
15. Caroli, A., et al., Diffusion-weighted magnetic resonance imaging to assess diffuse renal pathology: a systematic review and statement paper. Nephrol Dial Transplant, 2018. 33(suppl_2): p. ii29-ii40.
16. Friedli, I., et al., New Magnetic Resonance Imaging Index for Renal Fibrosis Assessment: A Comparison between Diffusion-Weighted Imaging and T1 Mapping with Histological Validation. Scientific reports, 2016. 6: p. 30088-30088.
17. Wittsack, H.J., et al., Temporally resolved electrocardiogram-triggered diffusion-weighted imaging of the human kidney: correlation between intravoxel incoherent motion parameters and renal blood flow at different time points of the cardiac cycle. Invest Radiol, 2012. 47(4): p. 226-30.
Figures
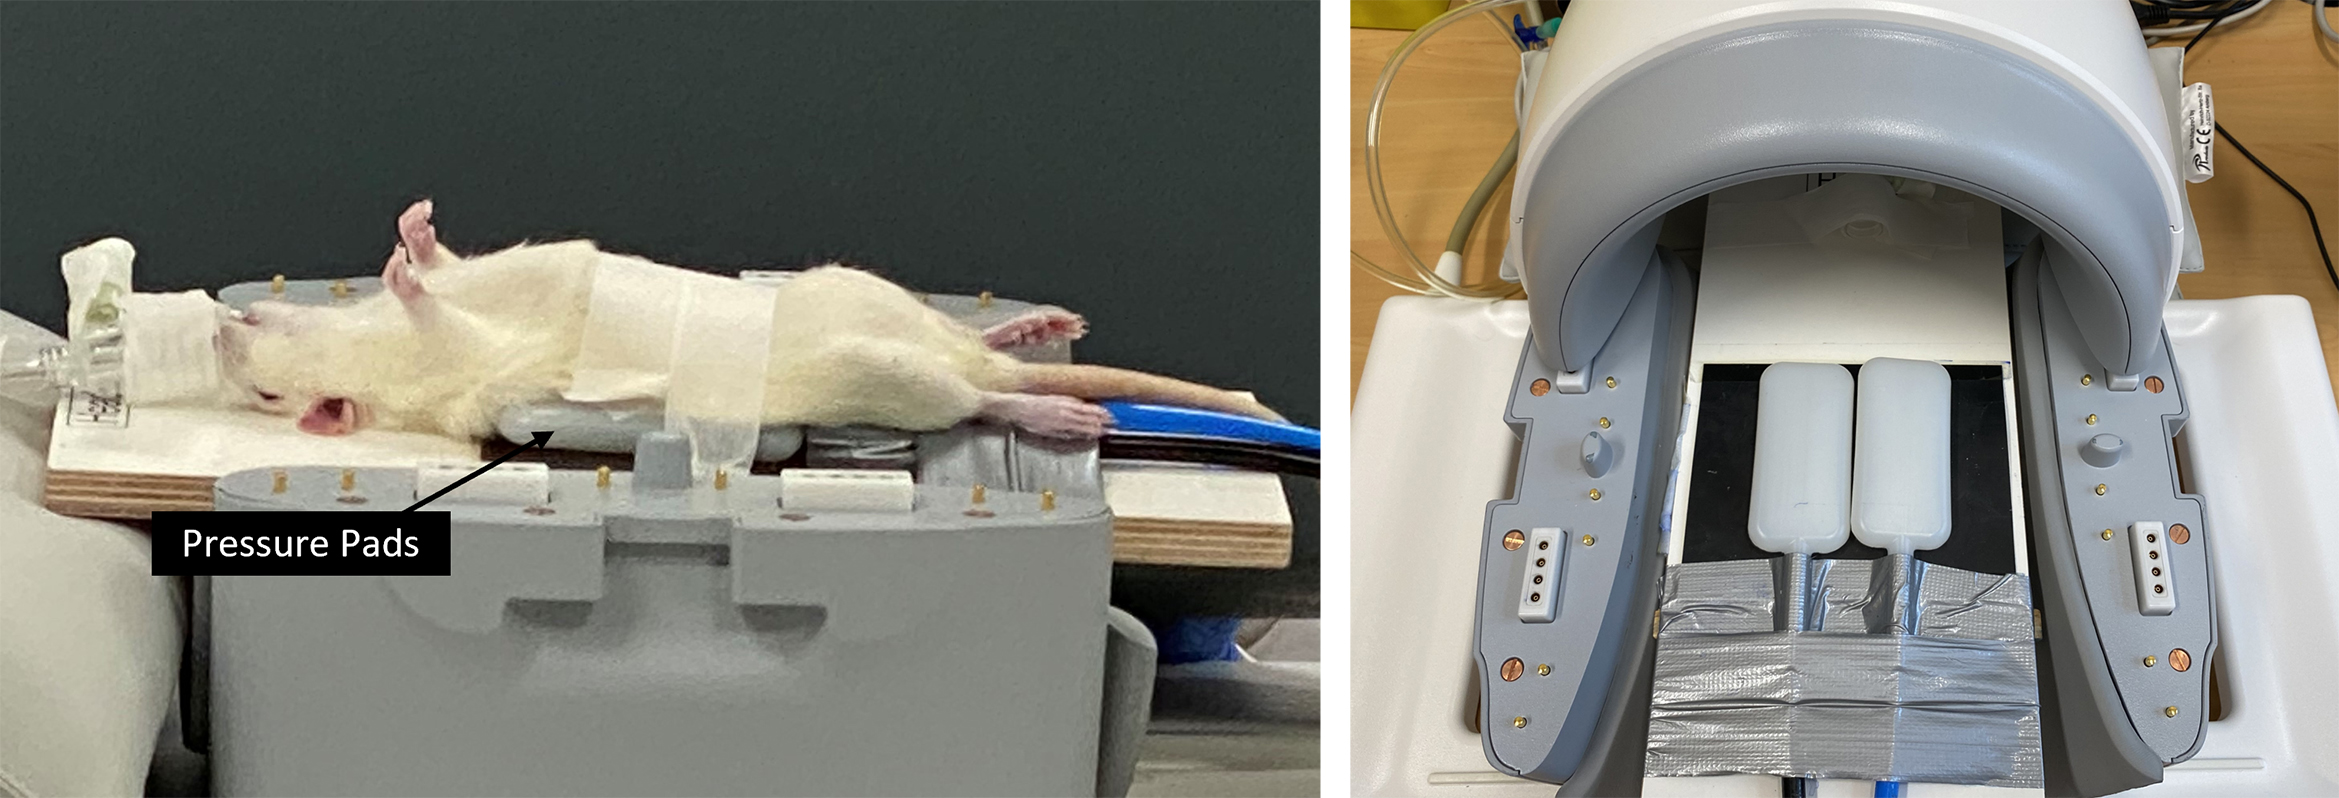
Setup of in vivo renal tomoelastography in rats.
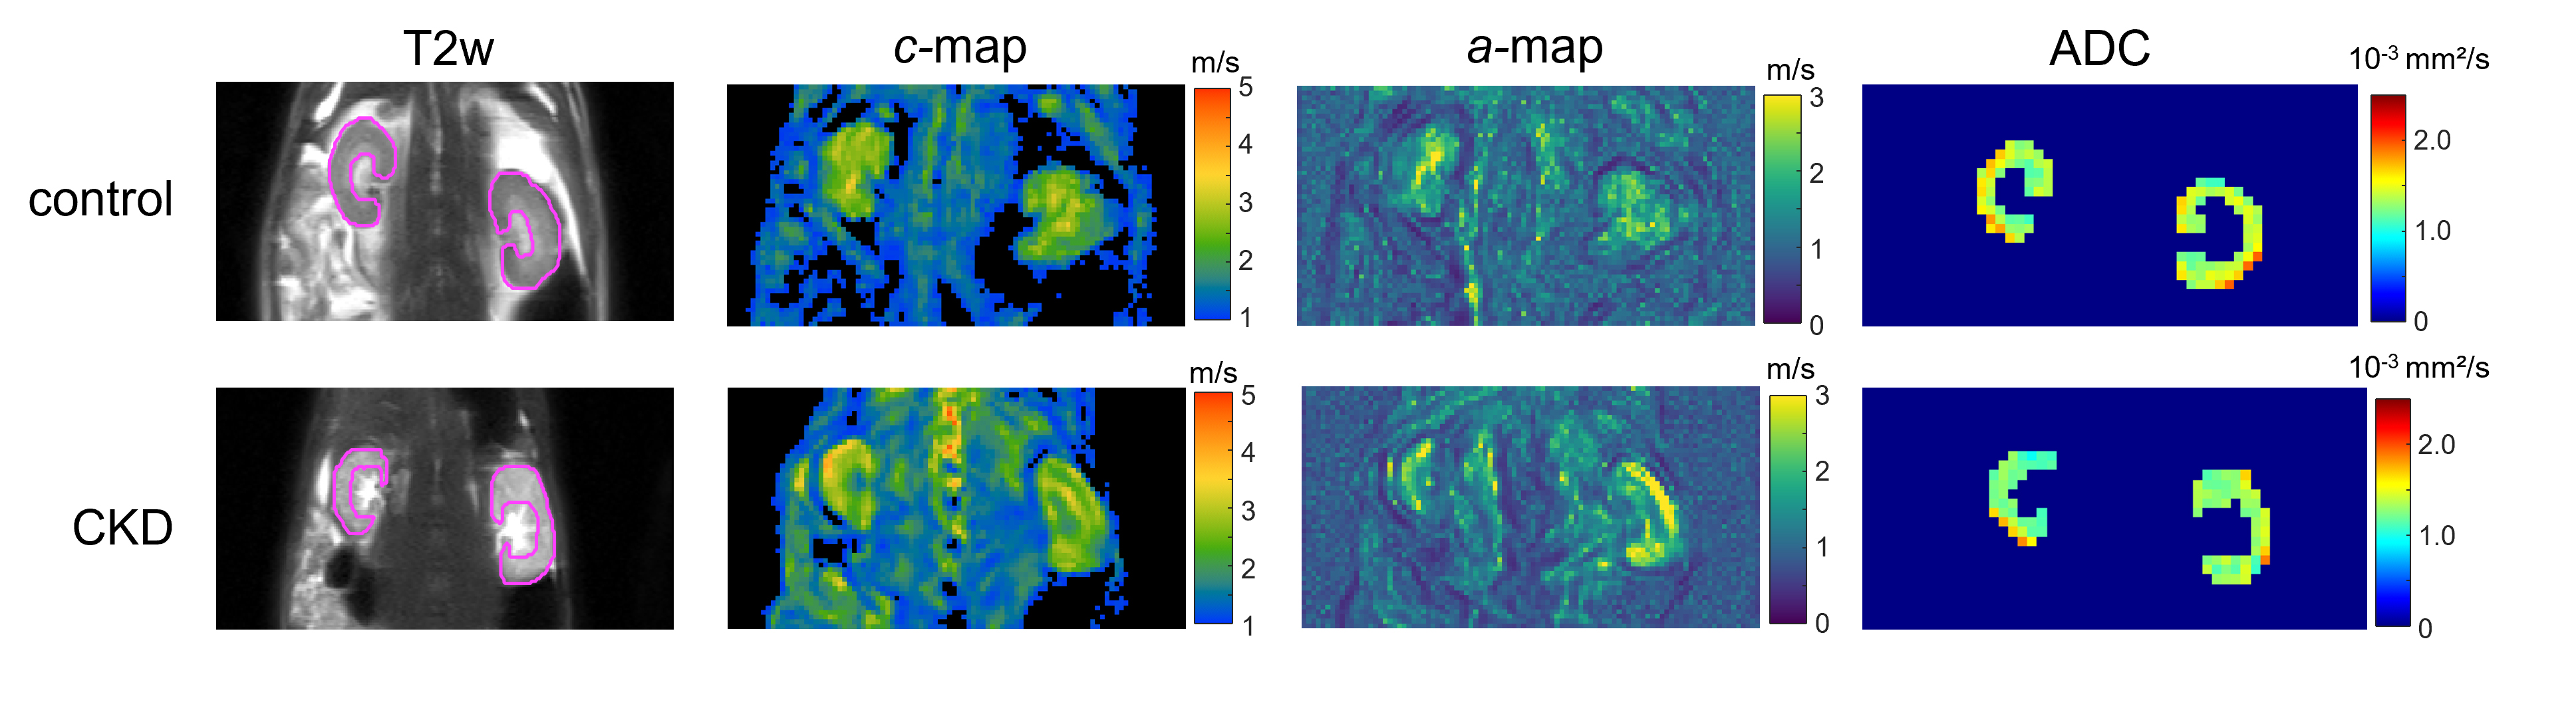
Representative T2-weighted (T2w) images, shear wave speed c- and penetration rate a-maps, and apparent diffusion coefficient (ADC) images from one control and one CKD rat. Region of interest (ROI) in renal parenchyma is outlined in magenta on the T2w images.
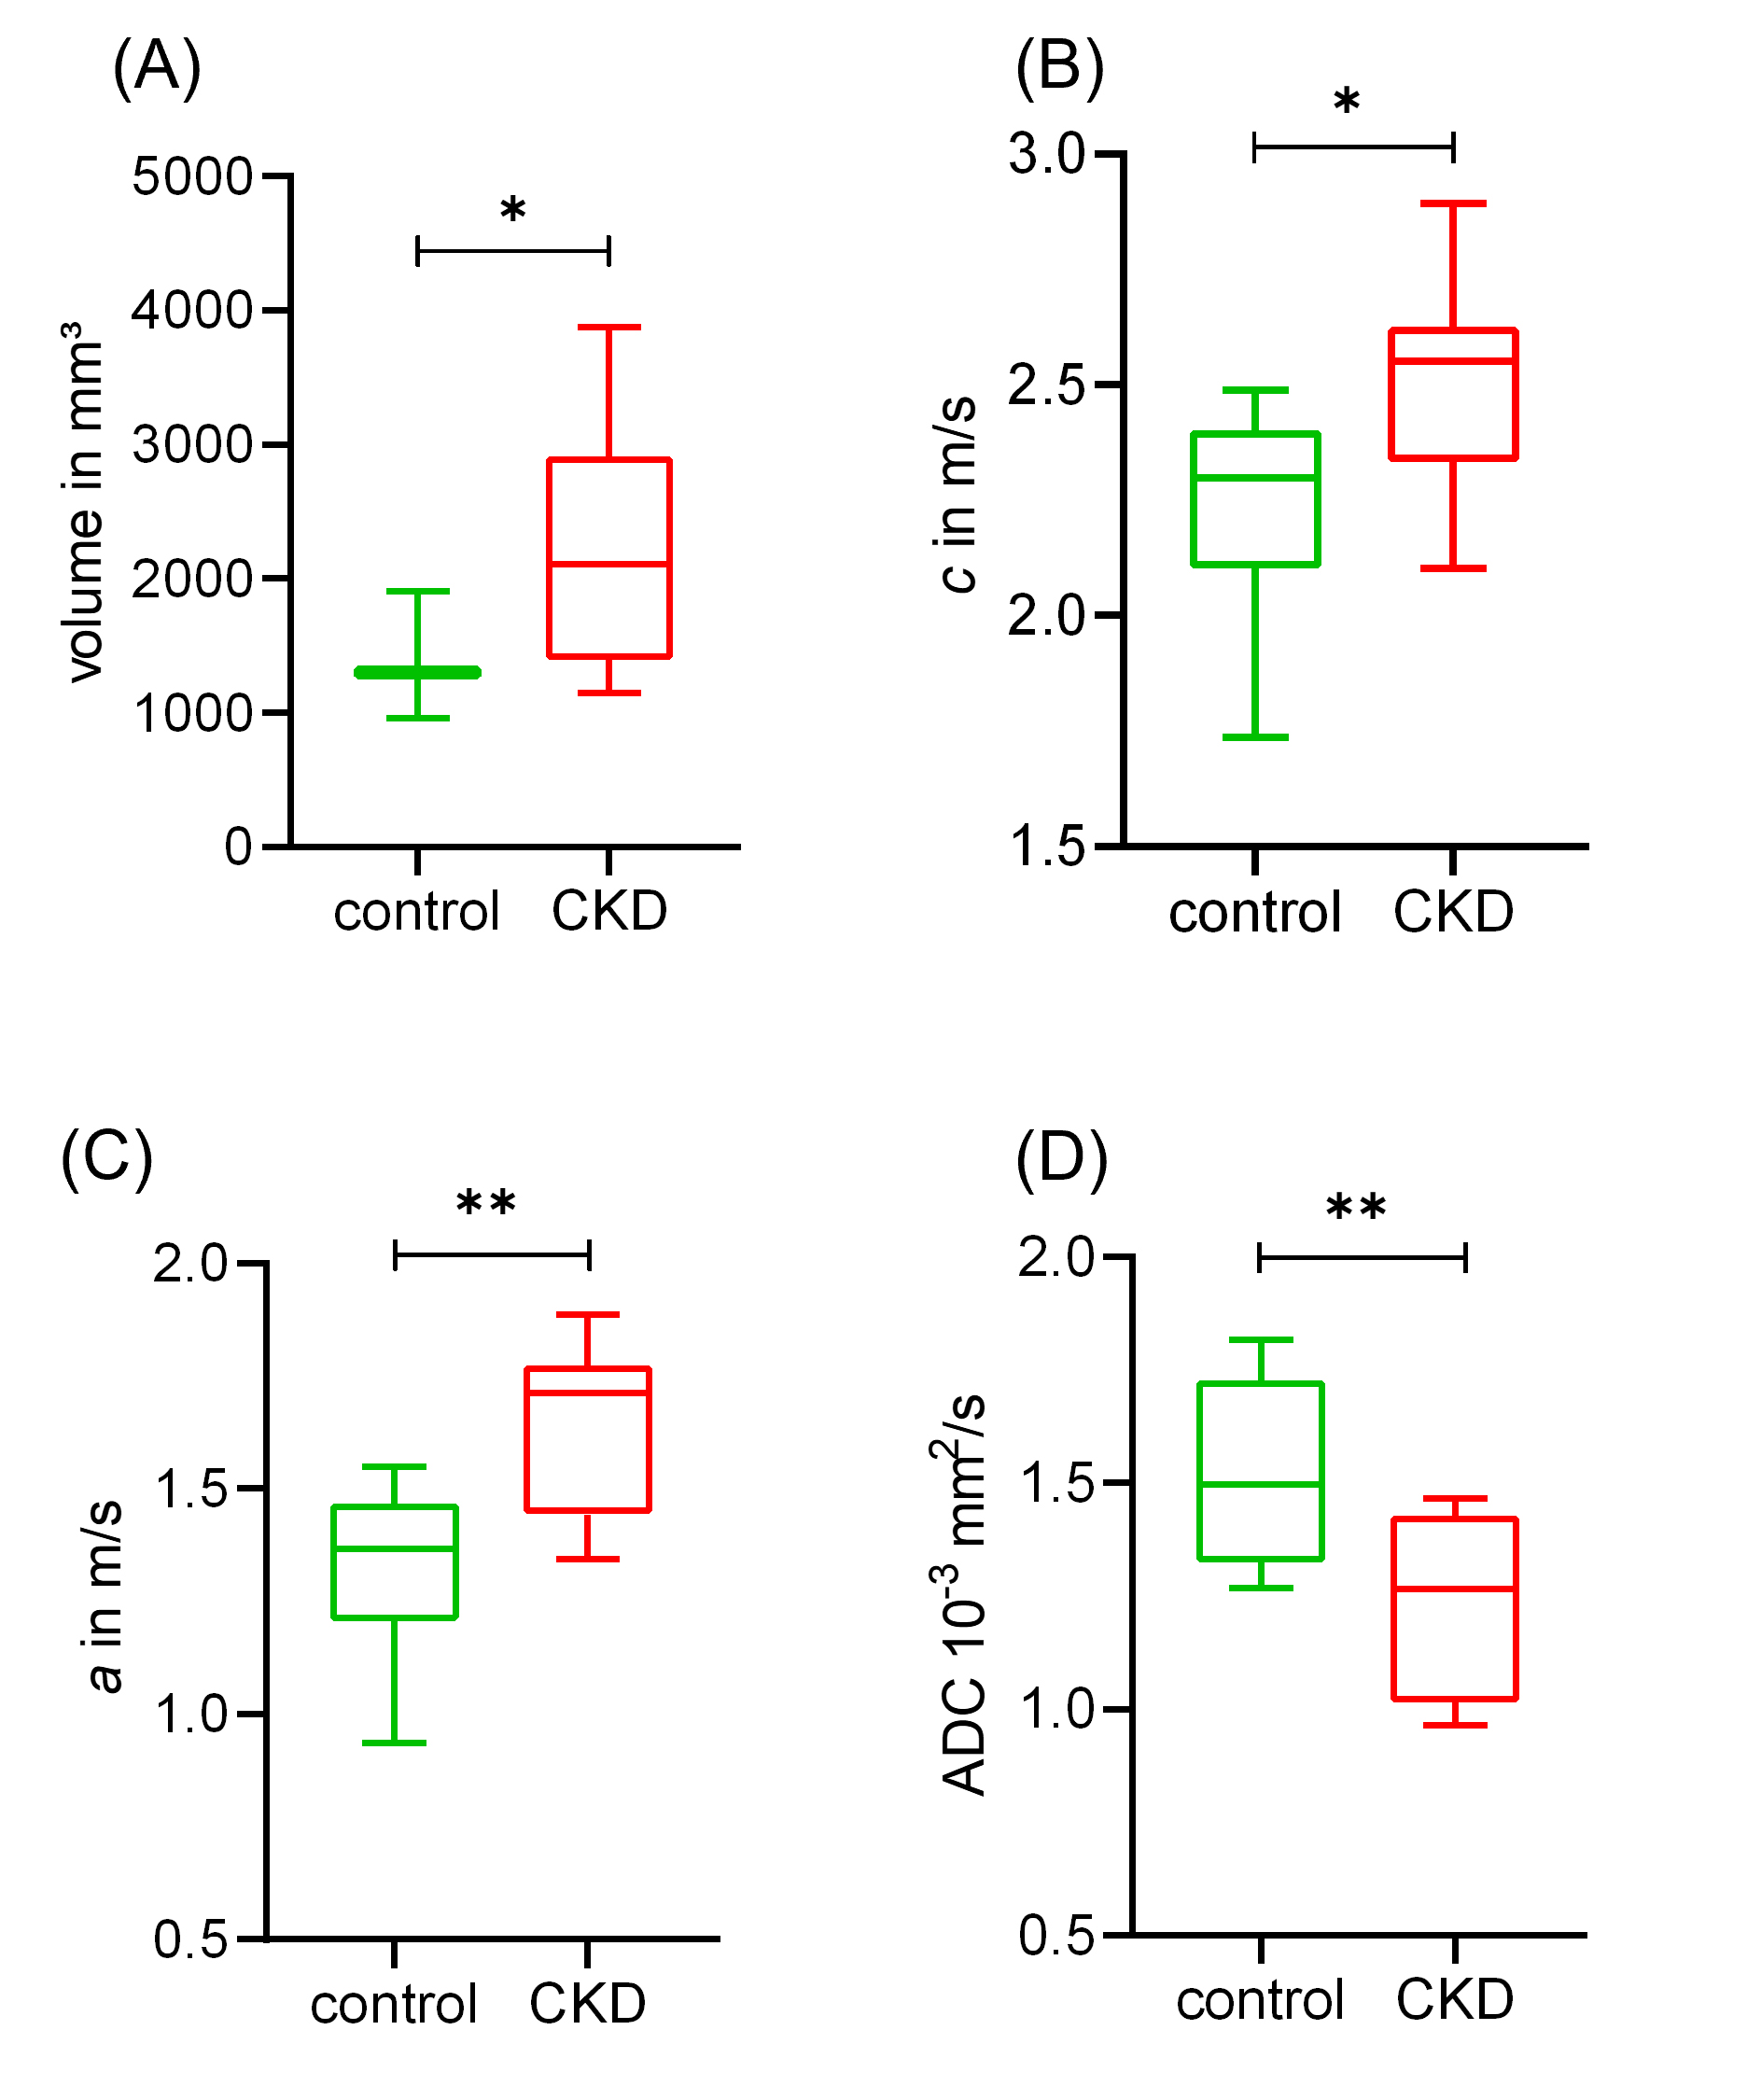
Box plots of (A) renal parenchymal volume, (B) c, (C) a, and (D) ADC in the control and CKD groups. Data are presented as minimum to maximum with interquartile range and median; * p ≤ 0.05 and ** p ≤ 0.01.
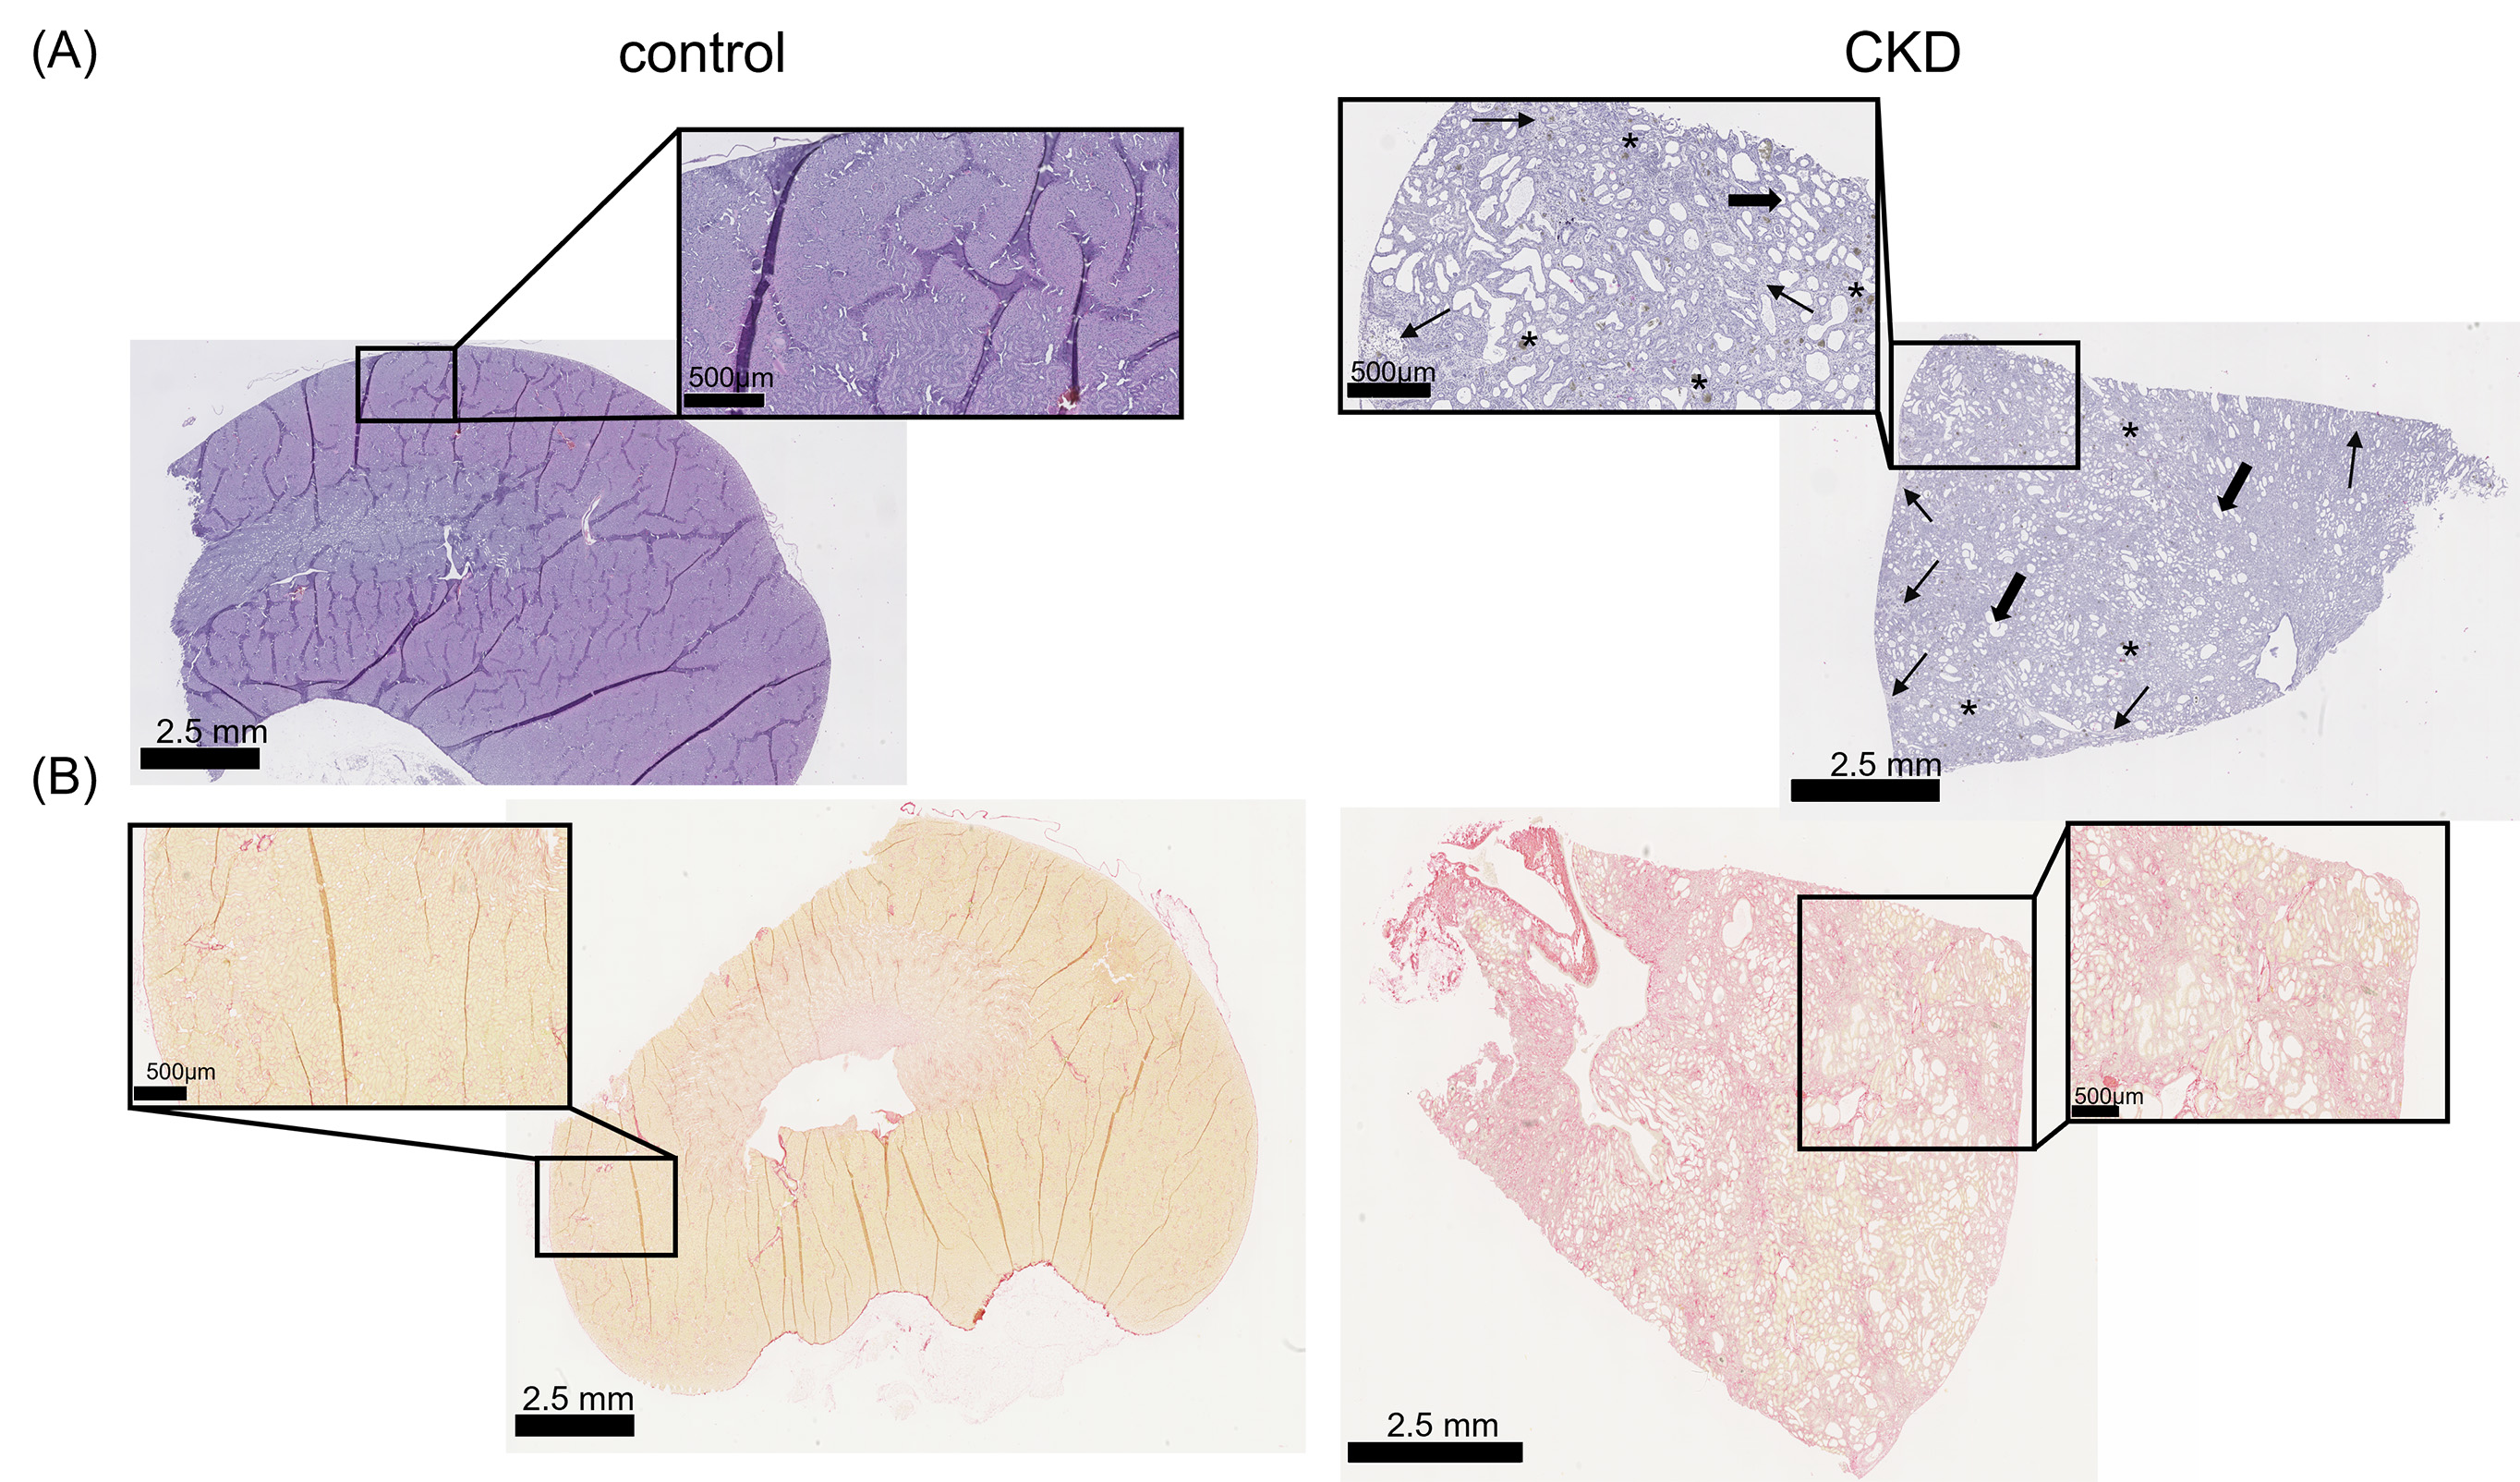
Representative micrographs of (A) H&E-stained and (B) sirius red-stained kidney sections from control and CKD rats. Pathologic features such as dilated tubules (thick arrow), interstitial fibrosis (thin arrow) and adenine crystal deposition (asterisks) are indicated on the H&E-stained image.