0157
Mechanically Induced contrast in OA and control cartilage tissues at histological length scales probed by multi-scale 1H/23Na MRS and MRI at 9.4T.
Galina Pavlovskaya1, Onur Belek2, Thomas Meersmann1, Christopher Philp1, Jane McLaren2, David A Walsh2, and Brigitte E Scammell2
1SPMIC/Medicine, University of Nottingham, Nottingham, United Kingdom, 2Medicine, University of Nottingham, Nottingham, United Kingdom
1SPMIC/Medicine, University of Nottingham, Nottingham, United Kingdom, 2Medicine, University of Nottingham, Nottingham, United Kingdom
Synopsis
We reveal intriguing experimental results providing the evidence that triple quantum filtered sodium relaxation time associated with histologically confirmed sodium bound to glycosaminoglycans (GAGs) in the cartilage matrix could be a marker for earlier osteoarthritis. The change appears only when cartilage specimens are subjected to mechanical load corresponding to 200N force applied normal to the cartilage surface. Hence, this mechanically induced change can potentially serve as a health score of cartilage tissues in health and disease in vivo.
Introduction
Osteoarthritis (OA) is a heterogeneous disease characterised by diarthrodial joint multi-tissue failure1; it is the most prevalent chronic rheumatic illness and the leading cause of disability worldwide2. With the implementation of MRI, increased early detection rates could allow faster intervention and alleviation of burden upon the NHS. In addition, the analysis and comparison between histology of a cartilage tissue sample and MRI are critical for validating novel imaging methods and contrasts, particularly in molecular imaging research3. This study investigated the correlation between the OA cartilage tissue MRI contrast (under compression/relaxation) with histological staining. Implications are noteworthy as we can sensitise OA protocols during MRI analysis to target specific histological features and perform non-invasive monitoring of the disease in response to therapeutic interventions to improve the response of the impaired cartilage tissue to a natural load in OA.Methods
Human Cartilage OA (n=7) Specimens were taken following knee replacement surgery (conducted at the University of Nottingham) from the tibia plateau cartilage. Control cartilage specimen (n=6) were obtained from cadavers. The cartilage and subchondral bone were sectioned into 1cm3 cubes, staged for OA, vacuum-sealed to prevent evaporation, and utilised in MRI studies. The samples were subsequently histochemically examined to determine the sites of PG and collagen in the cartilage. NMR and MRI of all spin species reported in this study were performed on a 9.4 T Bruker Avance III Microimaging system (Bruker, Germany) using 25mm dual tuned 1H/23Na microimaging coil (Bruker, Germany). 1H multi-slice T1 weighted /T2* gradient echo MRI protocol (Paravision 6.01) was used to visualise anatomy of the cartilage with 20mm in-plane resolution and monitor the compression. 23Na MRI was performed using non-slice selective gradient echo home-written protocol for TopSpin 3.2 environment and spectroscopically determined triple quantum filter (TQF) was integrated into the code to visualise stored sodium in the same cartilage specimen. Sodium levels of cartilage samples in the images were expressed in SNRs. Tripe quantum filtered spectroscopy was used to characterise both fast and slow sodium transverse relaxation and residual quadrupolar coupling constant in all cartilage specimens.Results
The concept for co-registration of MRI contrast induced by sodium and water protons in the cartilage tissue is outlined in Figure 1. Changes in collagen fibres probed by T2* of water protons in the cartilage during compression/relaxation cycle for OA and Control specimen are shown in Figure 2. The co-localisation of free and bound sodium in OA and cartilage specimens visualised by 23Na MRI during compression/relaxation cycle are shown in Figure 3 where sodium levels were compared using sodium SNRs. 23Na triple quantum filtered spectroscopy was used to characterise sodium transverse fast and slow relaxation, as well residual quadrupolar coupling constant. Only slow component of sodium transverse relaxation demonstrated statistically significant outcome that is displayed in Figure 4 for all studied control and OA specimens.Discussion
We demonstrate that microimaging can be used to correlate proton induced T2* contrast with collagen response during compression/relaxation cycle. We demonstrate that sodium contrast reflects GAGs behaviour during compression/relaxation cycle for both control and OA specimens. We show that both free and bound sodium are located within the cartilage tissue that consists mostly of the extracellular matrix enriched with glycosaminoglycans (GAGs) at similar levels during compression/relaxation cycle. Hence the characterisation of the cartilage tissue was performed using triple quantum filtered sodium spectroscopy. We found that the slow component of sodium transverse relaxation was sensitive to distinguish between OA and control cases only when compression/relaxation cycle applied. Without compression we found no difference between control and OA specimen in all studied sodium and proton markers.Conclusion
We provide the evidence that the slow component of sodium triple quantum filtered relaxation is a marker for OA during compression/relaxation cycle. Our data demonstrate that the compression/relaxation cycle subjects the cartilage tissue to undergo changes that result in the same relaxed state as the tissue was initially for the controls while in the case of OA the tissue never restores to its original pre-compression state. This is indicative of different mechanical response to the normal stress, probably associating with the loss of GAGs in the cartilage scaffold linked to OA progression. This hypothesis should be further tested in vivo.Acknowledgements
GEP and TM thank the Medical Research Council for funding (Grant No. MC_PC_15074).References
1. LOESER, R. F., GOLDRING, S. R., SCANZELLO, C. R. & GOLDRING, M. B. 2012. Osteoarthritis: a disease of the joint as an organ. Arthritis Rheum, 64, 1697-707. 2. WITTENAUER R, S. L., ADEN K. 2013. Background Paper 6.12 Osteoarthritis. Priority Medicines for Europe and the World “A Public Health Approach to Innovation”. Update on 2004 background paper. World Health Organization. 3. MEADOWCROFT, M. D., ZHANG, S., LIU, W., PARK, B. S., CONNOR, J. R., COLLINS, C. M., SMITH, M. B. & YANG, Q. X. 2007. Direct magnetic resonance imaging of histological tissue samples at 3.0T. Magn Reson Med, 57, 835-41. 4. Jaccard G, Wimperis S, Bodenhausen G. MULTIPLE-QUANTUM NMR-SPECTROSCOPY OF S=3/2 SPINS IN ISOTROPIC-PHASE - A NEW PROBE FOR MULTIEXPONENTIAL RELAXATION. Journal of Chemical Physics 1986;85(11):6282-93 doi: 10.1063Figures
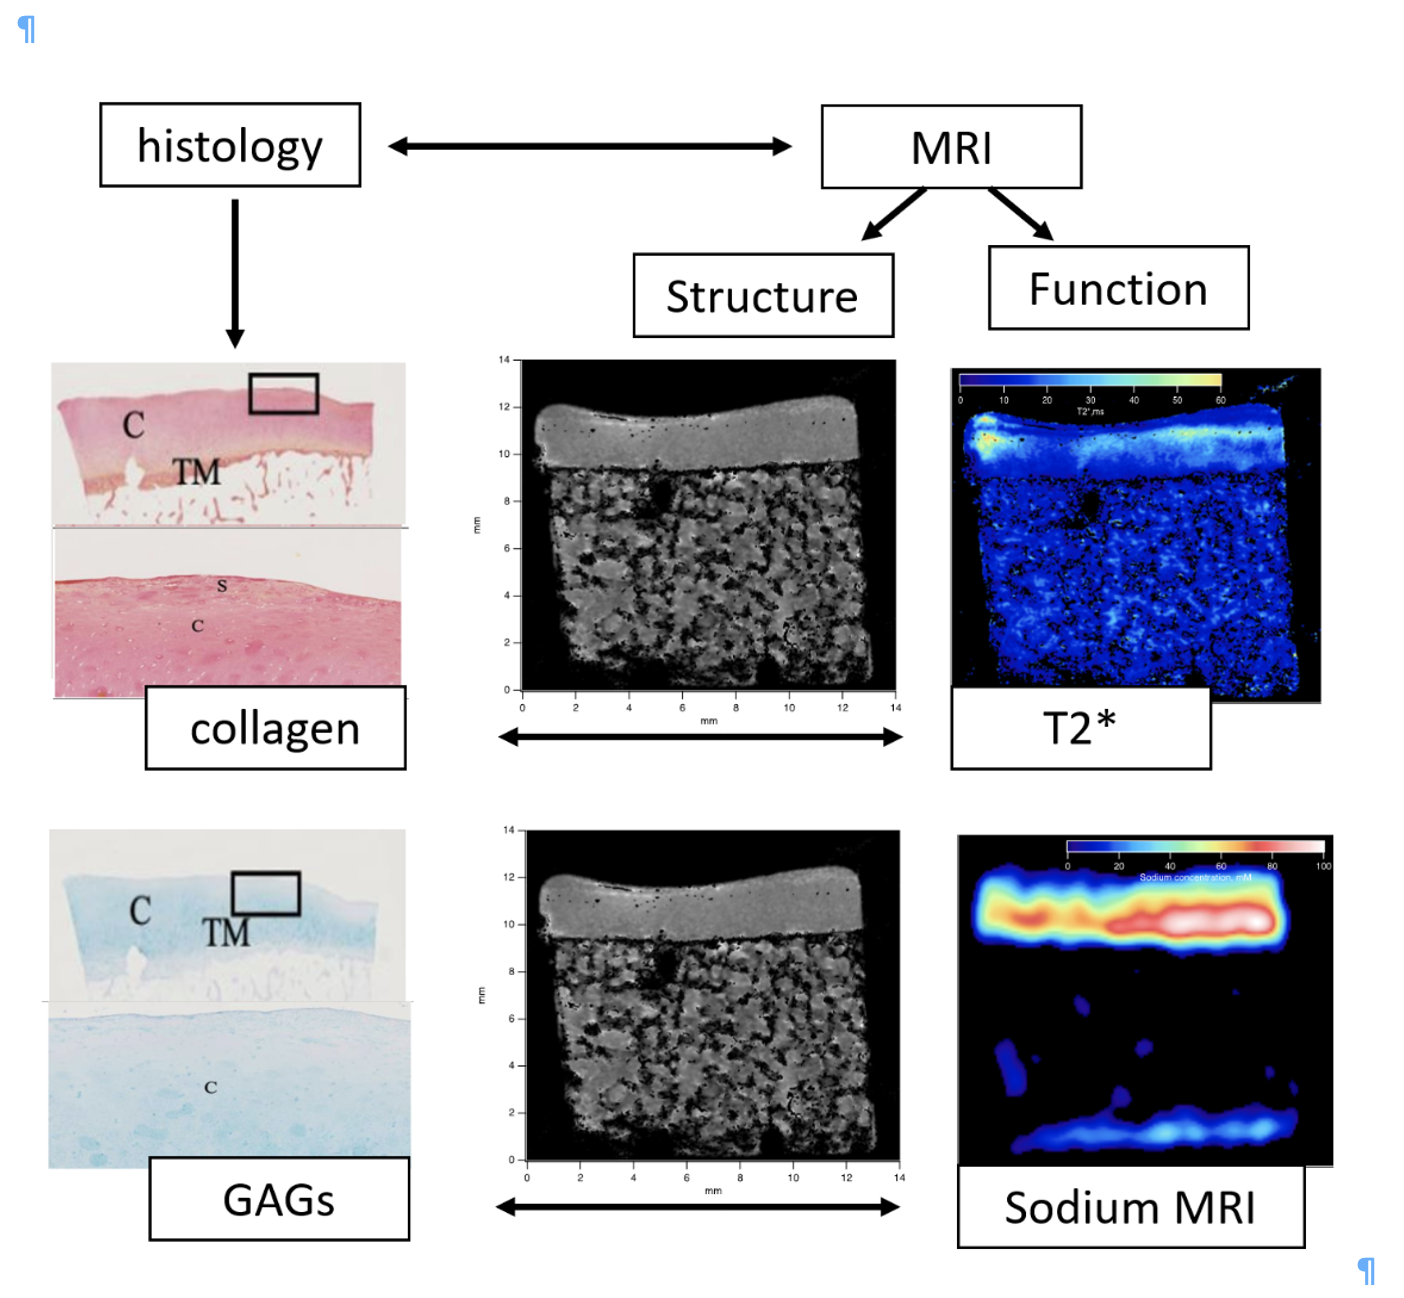
Overlap between histochemistry and microimaging contrast.
Histology images were obtained at 0.5x magnification and 8.00x magnification
for low magnification and high magnification, respectively. PR=PR
staining, AB=AB staining, C=cartilage, TM=tidemark
zone, S=superficial zone. Proton signals
demonstrate the abundance of water across the superficial and deep zones of AC.
23Na MRI reflect GAG distribution in cartilage specimens. The dark blue T2*
intensities (< 20 ms) reveals water-bound collagen and higher
intensities displays free water within the AS specimen.
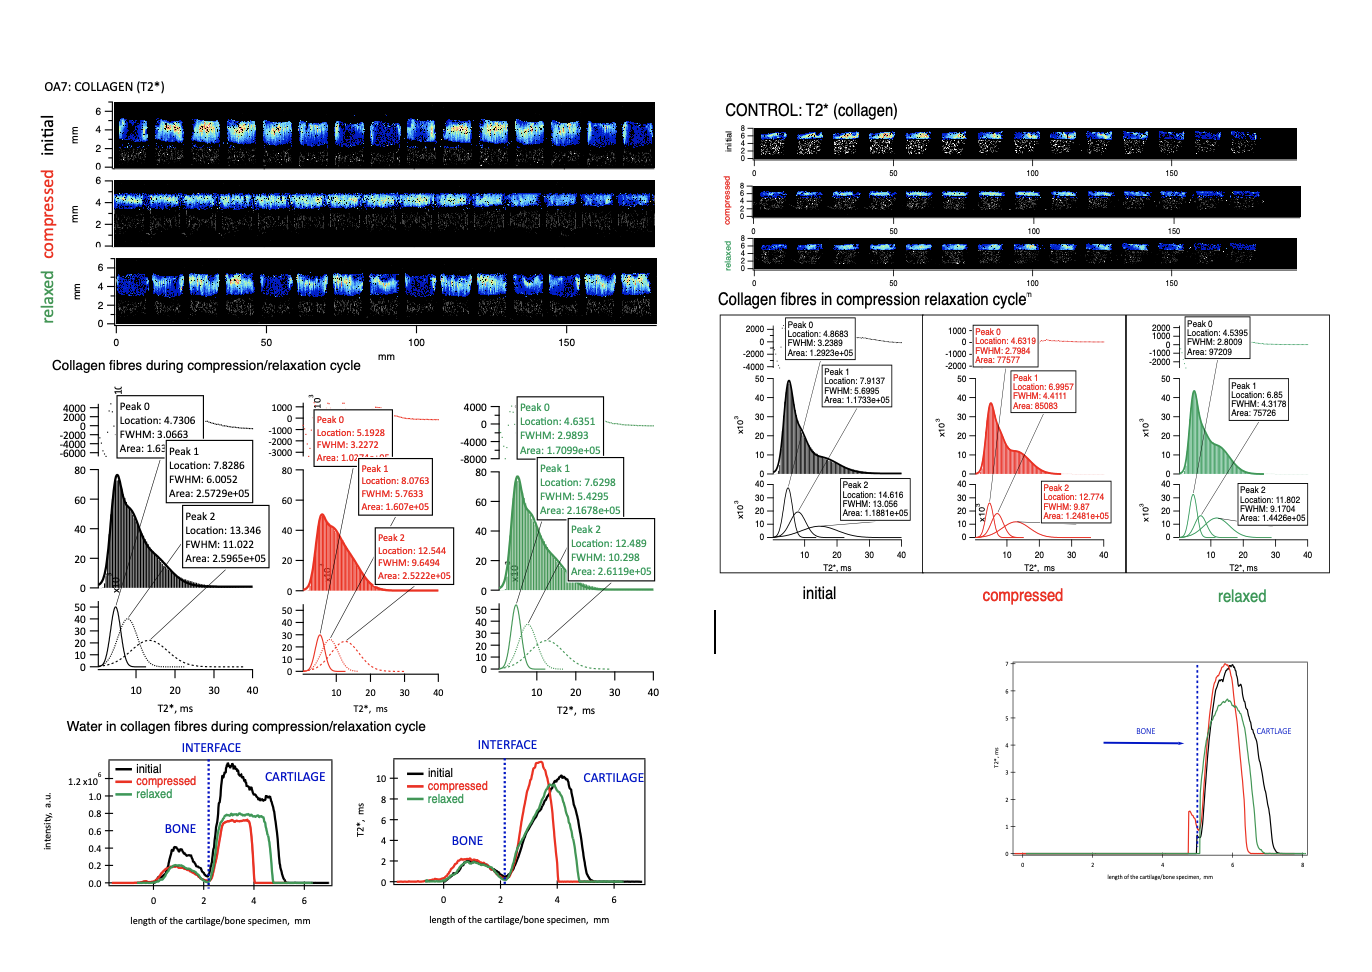
1H high resolution sagittal
plane MRI of OA7 and Control cartilage specimens using gradient echo MRI
protocol with TE = 8ms (1H GE) during compression / relaxation cycle.
T2* maps are overlayed with anatomical images with T2* distribution determined
for OA and Control specimens during compression/relaxation cycle. The 1D
profiles demonstrate how water intensity
and T2* relaxation change across bone/cartilage interface during mechanical
cycle.
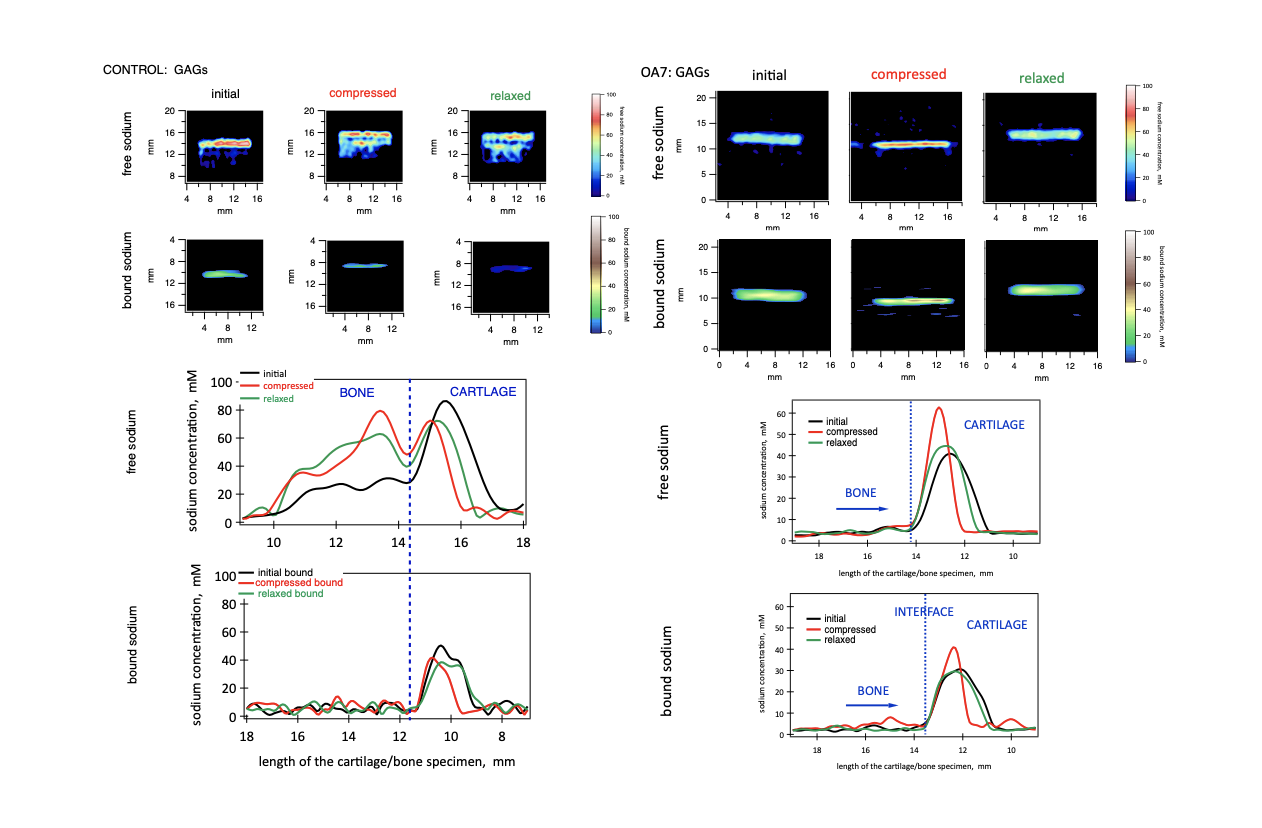
Localisation
of sodium in the control (left) and osteoarthritic (right) cartilage specimens
during compression/relaxation cycle. Sodium levels expressed in sodium SNRs are
similar suggesting that sodium senses GAG located in the cartilage scaffold. One
dimensional profiles demonstrate free and bound sodium distributions across
bone/cartilage interface during compression/relaxation cycle. Free sodium signal localised in the bone in
the control specimen is due to contamination during sectioning. Note the
absence of the signal in the bound sodium imaging experiment.
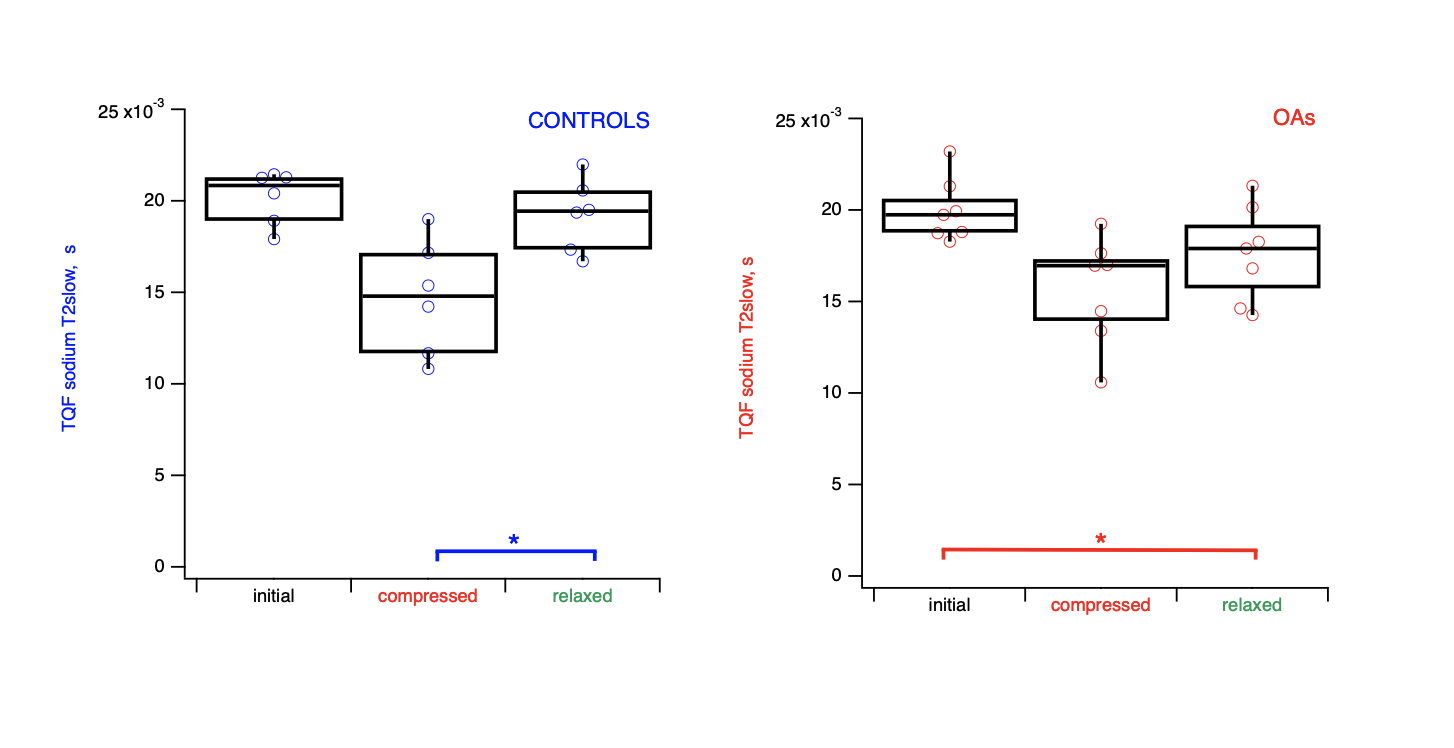
Wilcoxon
Rank statistics of sodium slow
relaxation during compression/relaxation cycle for control (n=6) and OA (n=7) cartilage
specimens. Application of the mechanical load in the case of controls results in the relaxed tissue state indifferent
form its initial state (p*< 0.05), while
in the case of OA the tissue never restores to its original state (p*< 0.05), thus indicating on the changes in the mechanical properties of
the cartilage tissue occurring during OA.
DOI: https://doi.org/10.58530/2022/0157