0155
Diffusion MRI and MRS probe cerebellar microstructure alterations in the rat developing brain during hepatic encephalopathy1CIBM Center for Biomedical Imaging, Lausanne, Switzerland, 2Animal Imaging and Technology (AIT), EPFL, Lausanne, Switzerland, 3LIFMET, EPFL, Lausanne, Switzerland, 4Service de radiodiagnostic et radiologie interventionnelle, Lausanne University Hospital CHUV, Lausanne, Switzerland
Synopsis
Children affected by hepatic encephalopathy (HE) suffer from irreversible cognitive damage, and thus exploring the developing brain during HE is of crucial interest. Histology in an adult rat model of HE suggested alterations in the cerebellar microstructure, but there is a need for in vivo probes of these changes. Combining diffusion MRS and diffusion MRI, we measured increased metabolites’ diffusivities, as well as an increased intra-neurite/axon water diffusivity in white and gray matter in the cerebellum of a young rat model of HE compared to control rats, suggesting an alteration of cell density and/or of neurite network complexity.
Introduction
Type C hepatic encephalopathy (HE) is a severe brain disease arising as a consequence of chronic liver disease (CLD). Toxins (bilirubin, ammonia) that the liver fails to clear from the systemic circulation accumulate in the brain, leading to a cascade of neurometabolic changes resulting in cognitive impairment and eventually death1. Mounting evidence suggests that children are more vulnerable to irreversible neurological damages associated with CLD than adults, even after liver transplantation2. In parallel, in animal studies using the bile duct ligated (BDL) rat model of type C HE, the cerebellum has shown stronger metabolic changes measured by 1H magnetic resonance spectroscopy (MRS) compared to other brain regions3, underlining its crucial role in the disease development. Changes in hippocampal and cerebellar cells shape have also been reported in BDL rats using post-mortem immuno-histochemistry stainings1,4. Diffusion MRS (dMRS) and MRI (dMRI) hold the promise of providing non-invasive in vivo probes of these changes, the former being cell-specific and the latter highly sensitive. We performed here an in vivo longitudinal study of microstructural alterations in the developing brain during HE, using dMRS and dMRI in the cerebellum of young BDL rats.Methods
The bile duct ligated (BDL) rat model of type C HE, where the surgery was performed 21 days after the rats’ birth, was used.Diffusion MRS: Experiments were conducted at week 4 (SHAM/BDL: N=3/6) and at week 6 (SHAM/BDL: N=6/5) post-surgery on a Bruker 14.1T scanner, with a homemade quadrature surface coil. Steady-state concentrations were measured using the STEAM sequence with water as internal reference and dMRS experiments with the STE-LASER sequence5 (Fig. 1). Eddy currents, B0 drift and phase corrections were applied on individual transients. Metabolites were reported when their relative CRBs at b=0.05ms/μm2 was <10% for all rats (Gln, Glu, Ins, Tau, tNAA, tCr). A metabolites basis-set was simulated with NMRScope-B (jMRUI). A macromolecule spectrum was acquired in vivo in the cerebellum using double inversion recovery (TI=2200/800ms) with b=5ms/μm2 and residual metabolites were removed6 using AMARES (jMRUI). Metabolite signals were normalized to the first b-value before averaging and the Gaussian diffusion model and the randomly oriented sticks model7 were fitted to the mean decay up to b=5ms/μm2 and b=15ms/μm2 respectively.
Diffusion MRI: Experiments were conducted at week 6 post-surgery (SHAM: N=3, BDL: N=2) using a spin echo EPI sequence (Fig. 1). MP-PCA denoising, Gibbs ringing, Rician noise bias, and Eddy currents/motion artefacts corrections were performed following the DESIGNER pipeline8. The SANDI model9 for gray matter (GM) (hypothesis: Dsoma=3μm2/ms) and the WMTI-Watson model10 for white matter (WM) (hypothesis: Daxon,WM>De//,WM11) were fitted for each rat and the parameters averaged over a region of GM or WM.
Results and discussion
In the present study the ultra-high field led to a good spectral separation of glutamine (Gln) and glutamate (Glu), allowing to disentangle their behaviour. In addition, we achieved short and artefact-free dMRI acquisitions in a brain region prone to motion artefacts due to the animal’s respiration.A strong increase of Gln concentration in the BDL group and a decrease in the summed concentrations of the main osmolytes (Ins, Tau, tCho and tCr) were observed from week 4 onwards, suggesting that the osmotic response occurs early in the disease progression, as previously reported in young BDL rats12 (Fig. 3). Of note, some differences were observed within the SHAM group across weeks due to the ongoing brain development at this age13.
The Gaussian diffusion and the randomly oriented sticks model (Fig. 2) highlighted the same overall trend in dMRS: all metabolites’ ADC and Dneurite,MRS increased in the BDL group compared to the SHAM group at weeks 4 and 6 (Fig. 4). The increased diffusivity of the main brain osmolytes (Ins, Tau, tCr) is in agreement with the presence of an osmotic stress, which could cause an increased permeability with the extracellular space. Additionally, immuno-histochemistry in the cerebellum of adult BDL rats showed a reduced dendritic spine density in neurons and fewer ramifications for astrocytes processes14, which might contribute to a less restricted cellular environment leading also to an increased diffusivity for both neuronal (Glu, NAA) and astrocytic metabolites (Ins, Gln).
Due to the small number of animals in the dMRI study, no statistical difference between groups was observed (Fig. 5). Trends for group differences are however present: in both GM and WM, increased Dneurite and Daxon, respectively, are observed in BDL rats, echoing metabolites increased diffusivity in dMRS, and suggesting a loss of neurofilaments and thus a freer intracellular space. The SANDI model estimates also showed a trend for reduced neurite fraction fneurite and increased extracellular and soma spaces in the BDL rats; and the WMTI-Watson model a trend for increased extracellular diffusivity, possibly suggesting cellular loss and a freer extracellular space.
In conclusion, we exploited the potential of both dMRI and dMRS to characterize microstructural changes in a complex region made of interleaved WM and GM through the implementation of tissue- and method-specific biophysical modelling. Collectively, our results suggest a loss of neurite network complexity and/or density in the cerebellum of BDL rats. The next objectives are to increase the sample size, to jointly model dMRS and dMRI and to validate the results against histology.
Acknowledgements
Supported by the European Union's Horizon 2020 research and innovation program under the Marie Sklodowska-Curie grant agreement No 813120 (INSPiRE-MED), the SNSF projects no 310030_173222, 310030_201218 and the Foundation Carigest SA. We acknowledge access to the facilities and expertise of the CIBM Center for Biomedical Imaging, founded and supported by Lausanne University Hospital (CHUV), University of Lausanne (UNIL), Ecole polytechnique fédérale de Lausanne (EPFL), University of Geneva (UNIGE) and Geneva University Hospitals (HUG). We acknowledge Stefanita Mitrea and Dario Sessa for the BDL surgeries, Analina Da Silva and Mario Lepore for veterinary support.References
1. Braissant, O. et al. Longitudinal neurometabolic changes in the hippocampus of a rat model of chronic hepatic encephalopathy. J. Hepatol. 71, 505–515 (2019).
2. Sorensen, L. G. et al. Longitudinal Study of Cognitive and Academic Outcomes after Pediatric Liver Transplantation. The Journal of Pediatrics 165, 65-72.e2 (2014).
3. Simicic, D. et al. P: 33 In Vivo Longitudinal 1H MRS Study of Hippocampal, Cereberal and Striatal Metabolic Changes in the Adult Brain Using an Animal Model of Chronic Hepatic Encephalopathy. The American Journal of Gastroenterology 114, S17 (2019).
4. Pierzchala, K. et al. P: 68 Brain Regional Susceptibility to Oxidative Stress in a Rat Model of Chronic Hepatic Encephalopathy. The American Journal of Gastroenterology 114, S33–S36 (2019).
5. Ligneul, C., Palombo, M. & Valette, J. Metabolite diffusion up to very high b in the mouse brain in vivo: Revisiting the potential correlation between relaxation and diffusion properties. Magnetic Resonance in Medicine 77, 1390–1398 (2017).
6. Simicic, D. et al. In vivo macromolecule signals in rat brain 1H-MR spectra at 9.4T: Parametrization, spline baseline estimation, and T2 relaxation times. Magnetic Resonance in Medicine 86, 2384–2401 (2021).
7. Callaghan, P. T., Jolley, K. W. & Lelievre, J. Diffusion of water in the endosperm tissue of wheat grains as studied by pulsed field gradient nuclear magnetic resonance. Biophys J 28, 133–141 (1979).
8. Ades-Aron, B. et al. Evaluation of the accuracy and precision of the Diffusion parameter EStImation with Gibbs and NoisE Removal pipeline. Neuroimage 183, 532–543 (2018).
9. Palombo, M. et al. SANDI: A compartment-based model for non-invasive apparent soma and neurite imaging by diffusion MRI. NeuroImage 215, 116835 (2020).
10. Jespersen, S. N., Olesen, J. L., Hansen, B. & Shemesh, N. Diffusion time dependence of microstructural parameters in fixed spinal cord. Neuroimage 182, 329–342 (2018).
11. Jelescu, I. O. & Budde, M. D. Design and Validation of Diffusion MRI Models of White Matter. Frontiers in Physics 5, 61 (2017).
12. Rackaova, V., Braissant, O., Rougemont, A.-L., Cudalbu, C. & Mclin, V. Longitudinal osmotic and neurometabolic changes in young rats with chronic cholestatic liver disease. Scientific Reports 10, 7536 (2020).
13. Račkayová, V. et al. Late post-natal neurometabolic development in healthy male rats using 1 H and 31 P magnetic resonance spectroscopy. J Neurochem 157, 508–519 (2021).
14. Mosso, J. et al. Diffusion-weighted magnetic resonance spectroscopy in the cerebellum of a rat model of hepatic encephalopathy at 14.1T. in Proc. Intl. Soc. Mag. Reson. Med. 29 (2021).
Figures
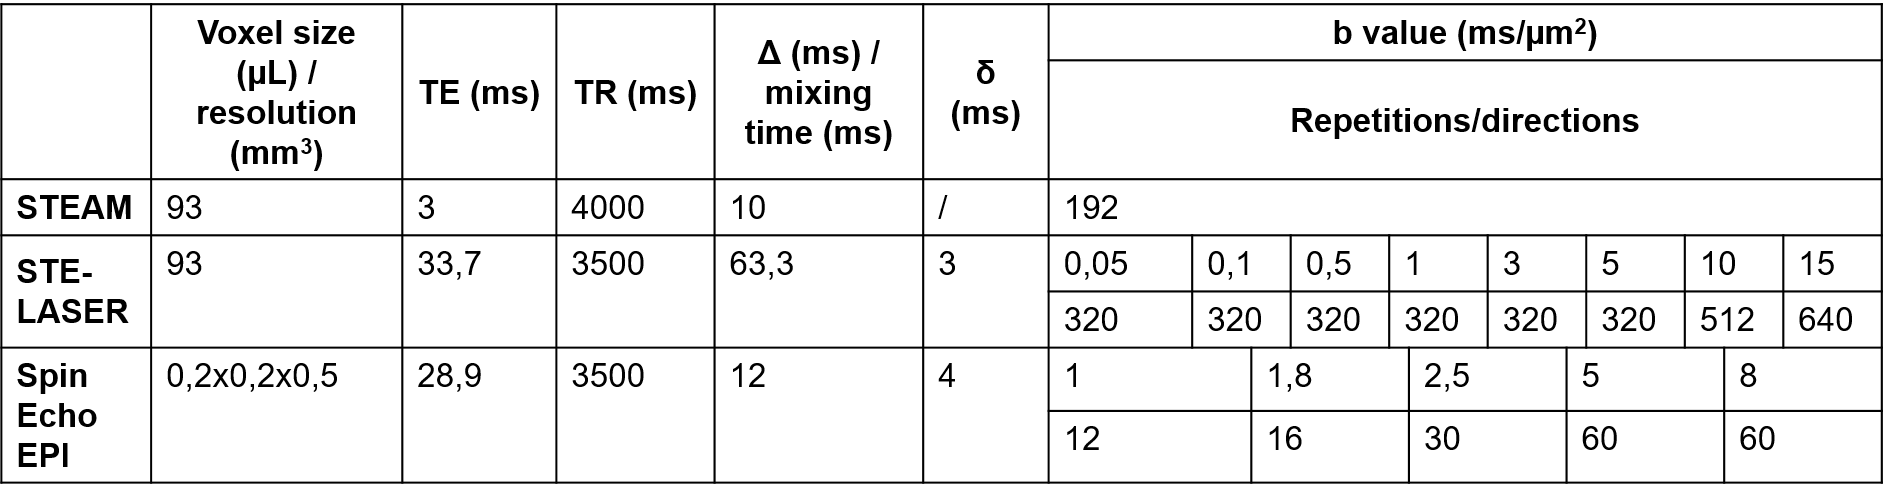
Fig. 1 – Sequence parameters for the standard 1H MRS, the diffusion MRS and diffusion MRI acquisitions. Δ: diffusion time, δ: duration of diffusion gradients.
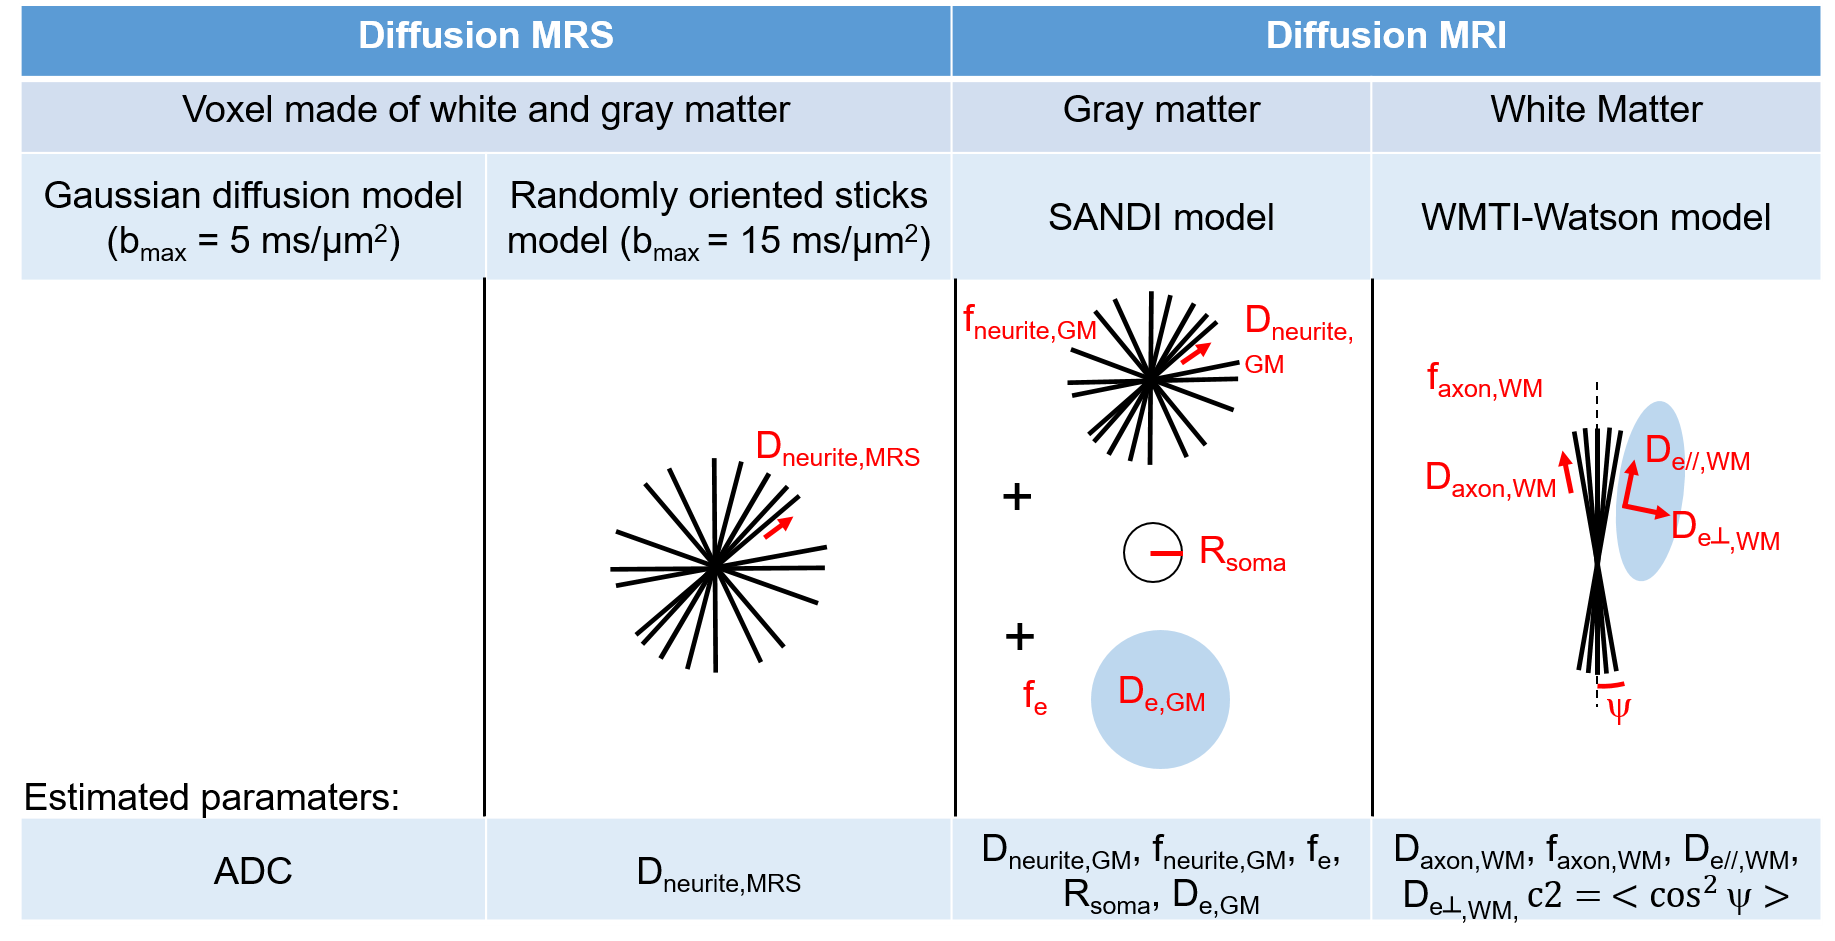
Fig. 2 – Models used for diffusion MRS and MRI data fitting. Dneurite,MRS: metabolites intra-neurite diffusivity, Dneurite,GM: water intra-neurite diffusivity in GM, fneurite,GM: neurite fraction in GM, fsoma: soma fraction in GM, Rsoma: soma radius in GM, De,GM: isotropic extracellular water diffusivity in GM, faxon,WM: neurite fraction in WM, Daxon,WM: water intra-neurite diffusivity in WM, De//or┴,WM: water extracellular diffusivity (// and perp. to axons) in WM.
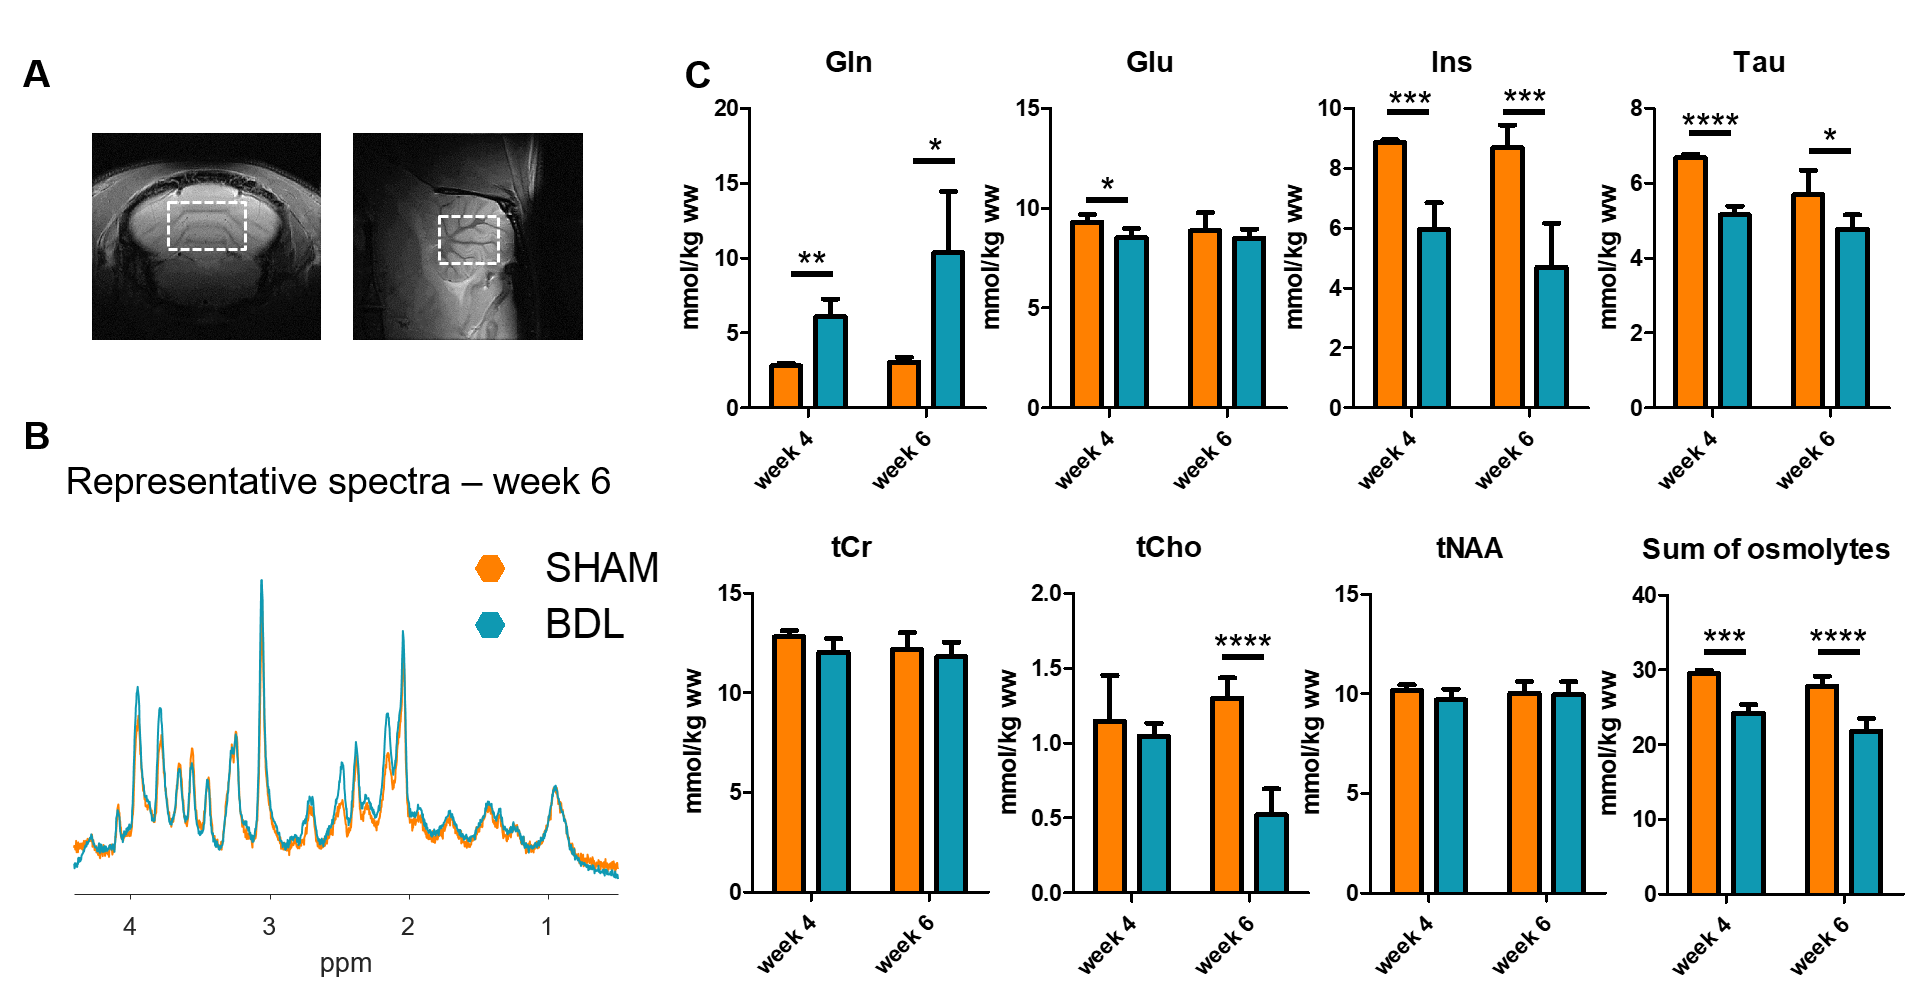
Fig. 3 – Metabolites concentration in the cerebellum at week 4 and week 6 post-surgery for both groups (STEAM). A: voxel location. B: representative spectra at week 6. C: metabolites concentrations. Gln: glutamine, Glu: glutamate, Ins: myo-inositol, Tau: taurine, tCr: total creatine, tCho: total choline, tNAA: total N-acetylaspartate, Sum of osmolytes: Ins+Tau+tCr+tCho. A Student’s t-test (or a Welch’s t-test when non-equal variance was found) was performed for all metabolites at week 4 and 6 between groups (*: p<0.05, ***: p<0.001, ****: p<0.0001).
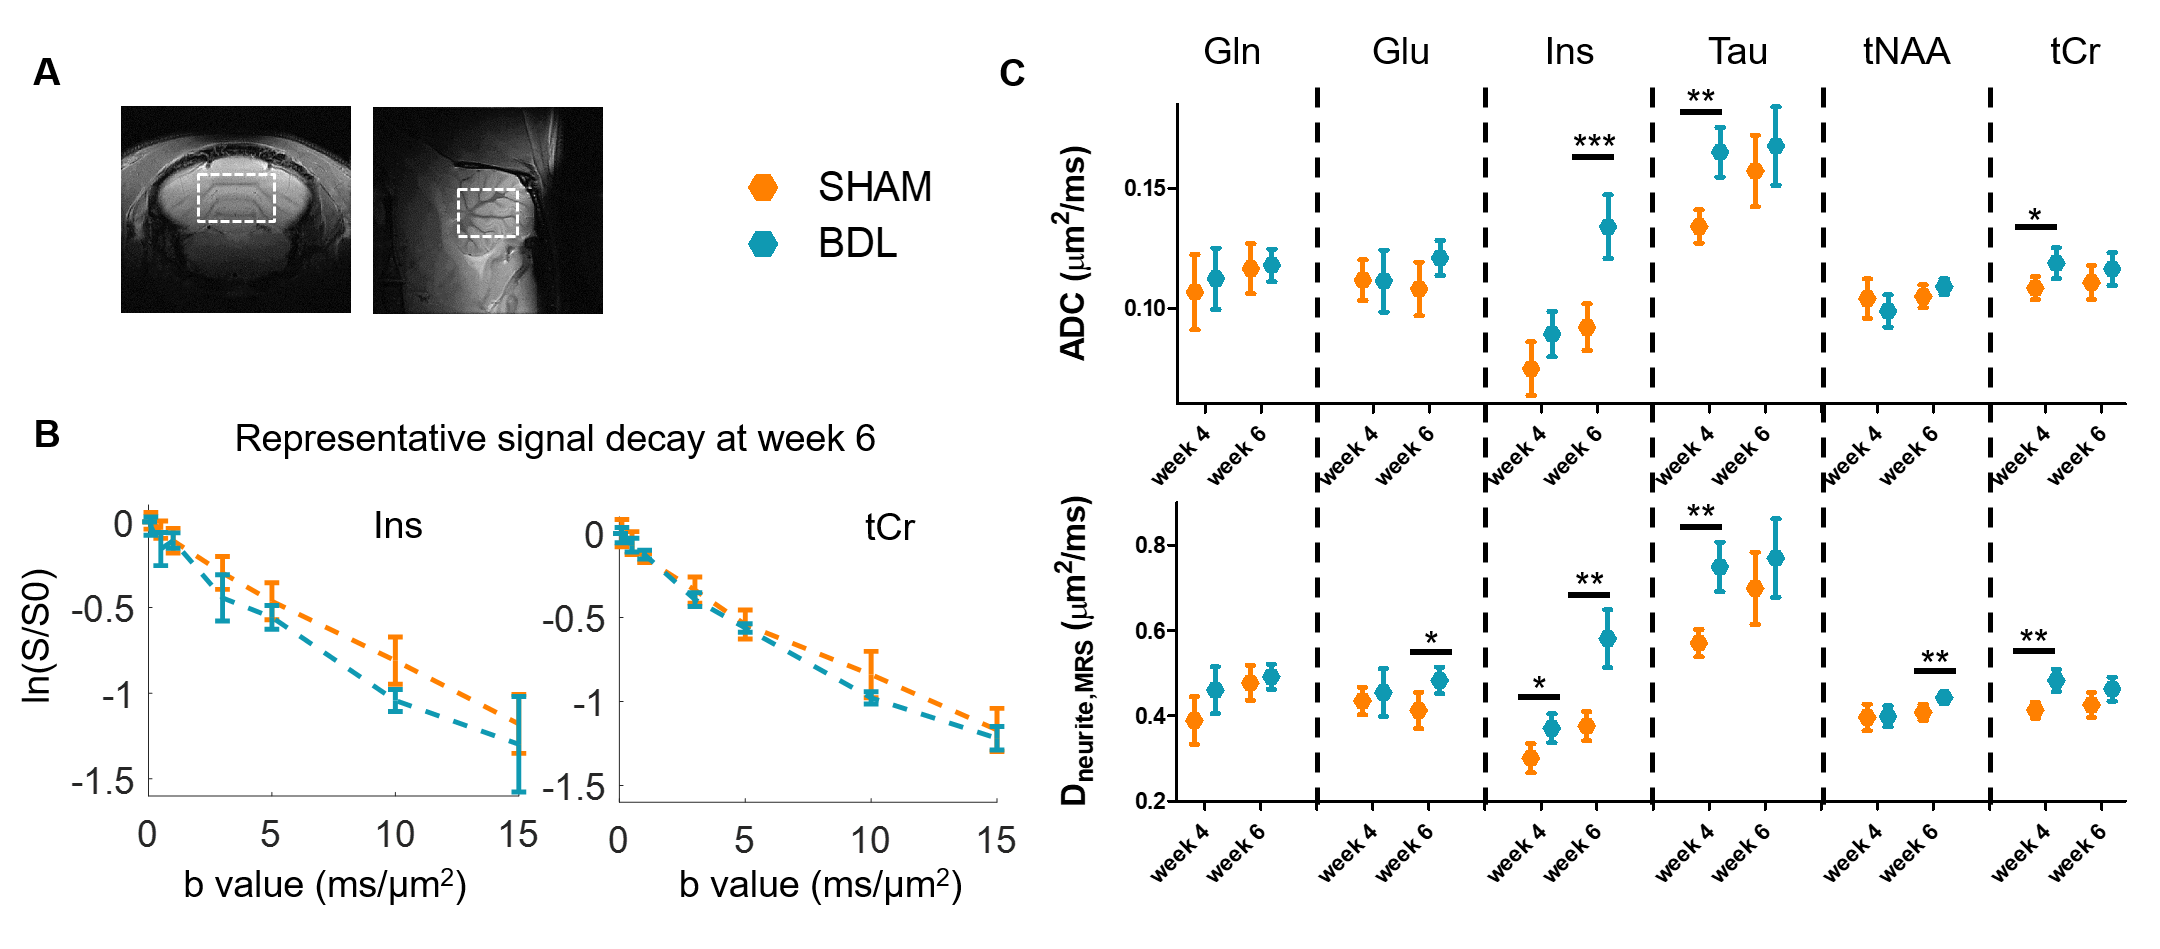
Fig 4 – Diffusion MRS. A: voxel location. B: representative diffusion decays at week 6 for Ins and tCr. C: estimated diffusion parameters for all metabolites. Errors estimated using Monte Carlo, with the standard deviation around the mean decay at all b-values. ADC: apparent diffusion coefficient. A Student’s/Welch’s t-test was performed for all diffusion coefficients at week 4 and 6 between groups (*: p<0.05, **: p<0.01, ***: p<0.001), showing increased ADC/Dneurite,MRS for osmolytes (Ins, Tau, tCr) and neuronal metabolites (tNAA, Glu).
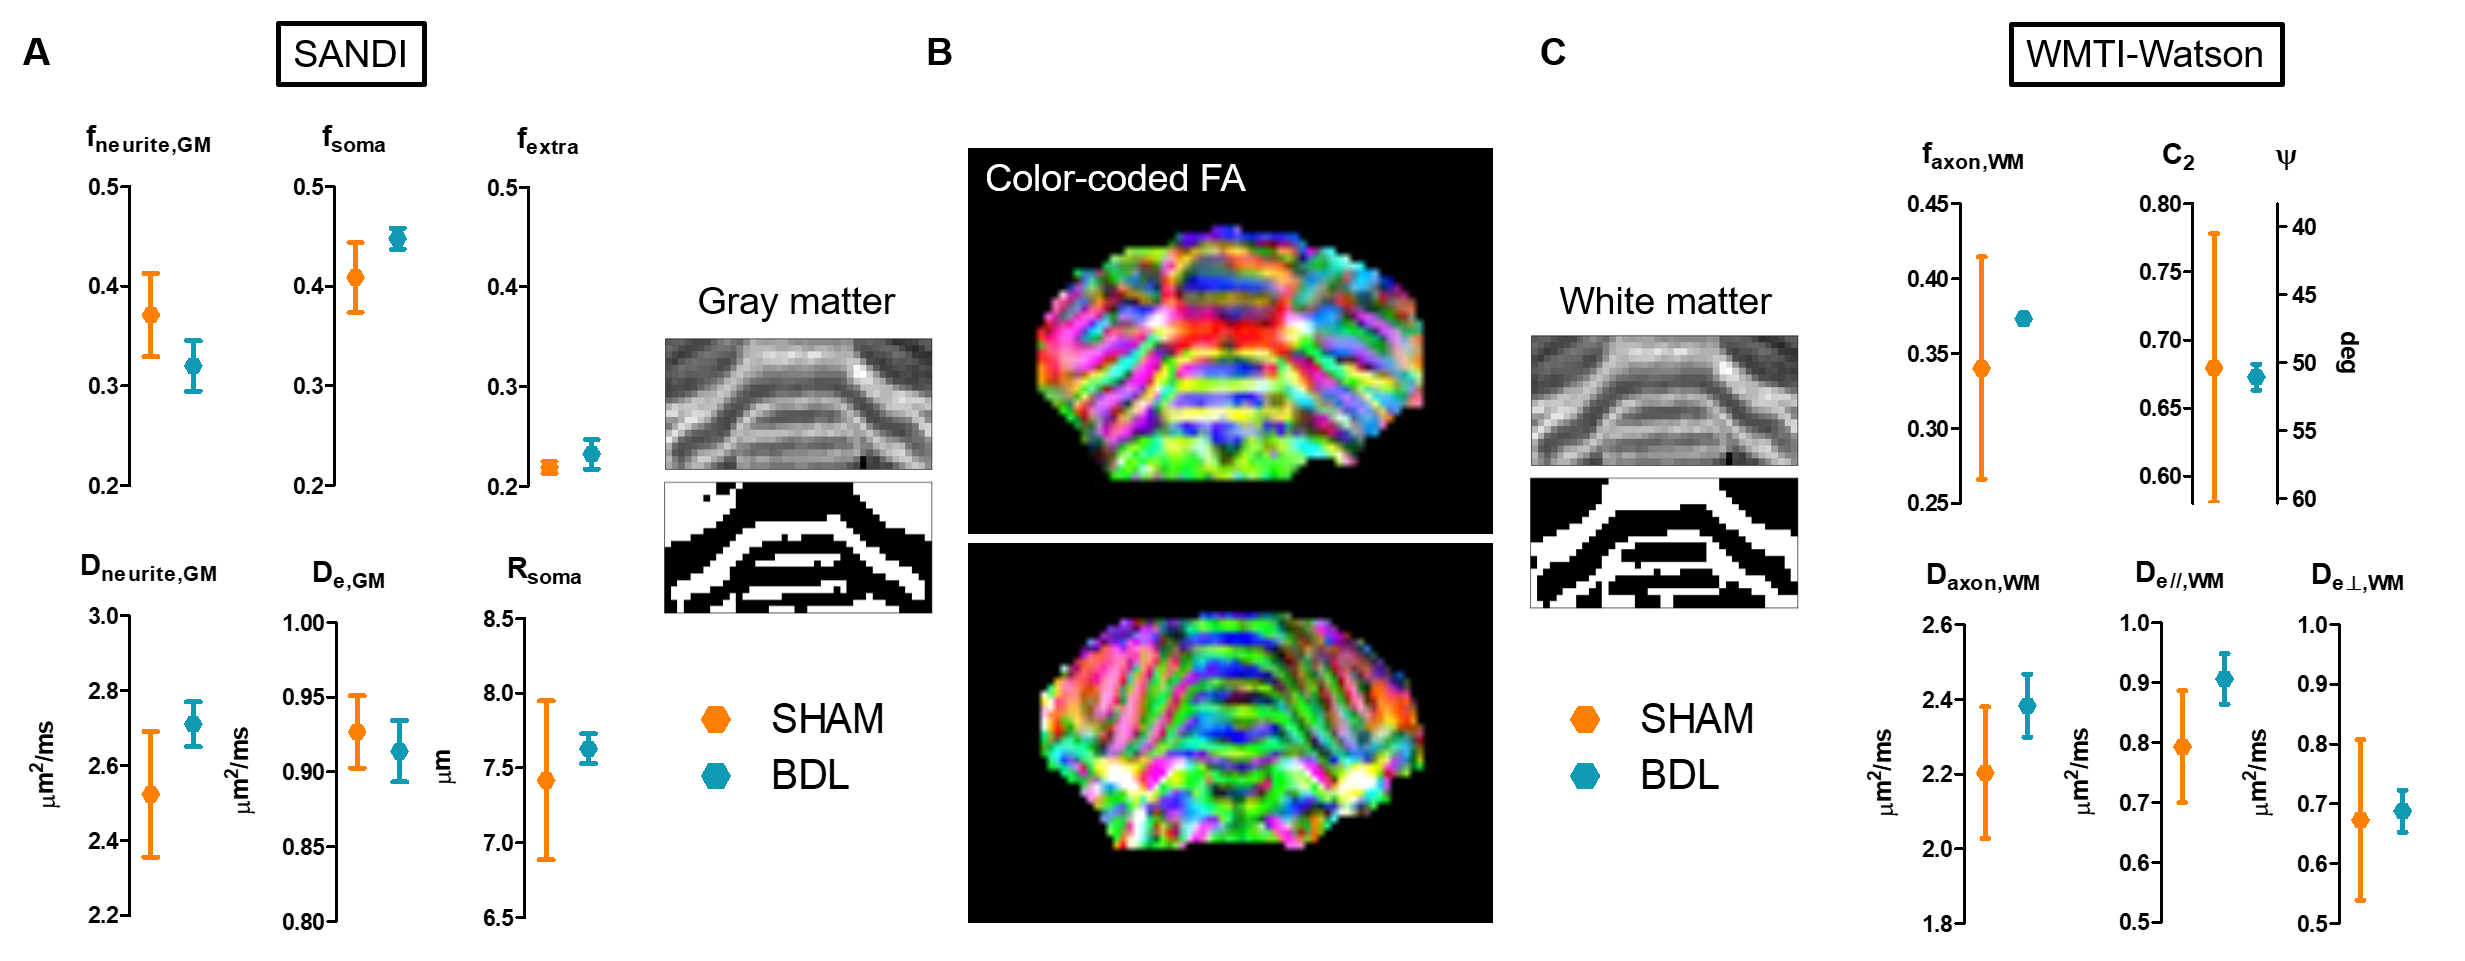
Fig. 5 – Diffusion MRI. B. Additive overlap of the 3 eigenvectors scaled by FA in two slices of the cerebellum of one rat. SANDI (A) and WMTI-Watson (C) parameter estimates. The GM and WM masks were automatically selected on the fneurite,GM map using an adaptative Gaussian threshold followed by a morphological erosion to limit the selection of contentious areas. A Student’s /Welch’s t-test was performed for all parameters between groups. No statistical differences can be observed, yet a trend of increased neurite/axon diffusivities in GM and WM.