0153
Evaluation of the lipid composition in mice transplanted with obese human microbiota using magnetic resonance spectroscopy1Institute of Metabolic and Cardiovascular Diseases (I2MC), Team Dynamix, Toulouse, France, 2Regional center of functional exploration and experimental resources (CREFRE), Noninvasive exploration service (ENI), Toulouse, France, 3Toulouse NeuroImaging Center (ToNIC), INSERM UMR 2314/UPS, Toulouse, France, 4Unitat de Diabetologia, Endocrinologia i Nutricio, University Hospital of Girona Dr. Josep Trueta, Girona, Spain
Synopsis
In this project, mice devoid of microbiota were transplanted with human microbiota from obese patients. Our work focused on evaluating and comparing the lipid composition in the white adipose in mice with different gut microbiota backgrounds using MRS. Our findings showed differences in white adipose tissue storage, lipid composition, and fatty acid composition among the different groups. This suggests that MRS can be used as a noninvasive tool to monitor dysbiotic gut microbiota in obese patients and evaluate a potential therapeutic response for obesity.
Introduction
The gut of mammals is colonized by a huge and complex microbial community known as gut microbiota. Microbiota plays a key role in intestinal and physiological homeostasis, immunity, and energy metabolism1. Recent studies have observed alterations in the composition and function of the gut microbiota of patients with cardiovascular and metabolic diseases, such as obesity2,3. The gut microbiota can be a regulator of white adipose tissue, contributing to its expansion, dysfunction, and inflammation. Magnetic resonance spectroscopy (MRS) has been widely used to study and identify biomarkers of the lipid metabolism in adipose tissues4,5. In this project, mice devoid of microbiota were transplanted with human microbiota from obese patients. Our work focused on evaluating and comparing the lipid composition in the white adipose in mice with different gut microbiota backgrounds using MRS.Methods
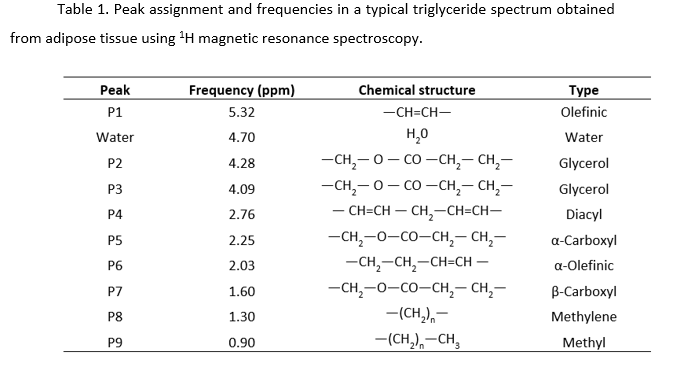
Three groups of sixteen-week-old adult C57BL/6J male mice (Charles River, France) were used for the study. The experimental groups consisted of a specific pathogen-free (SPF) group (n=6), a second group of germ-free (GF) mice (n=5), and a third group of transplanted GF mice with fecal microbiota from obese patients (GF-T) (n=16). All groups were fed on an γ-irradiated complete breeding diet (R03-10), ad libitum (3.24kcal/g :14% energy from fat, 25% energy from proteins, 61% energy from carbohydrates) (SAFE, France).Mice were anesthetized with 1.5-2% isoflurane inside a biological safety cabinet and placed in a prone tail position inside a specialized imaging cell to keep their initial sanitary status. All MRS experiments were performed on a 7T Bruker system (PharmaScan 70/16 US) with a transmit-receive volume coil with 40mm inner diameter, respiratory triggering, and mouse body temperature was kept at 37°C. In vivo MRS signals were acquired with a stimulated echo acquisition mode (STEAM) sequence with the following parameters: TR=3000ms, TE=3ms, voxel size of 1x1x1mm3, 60 averages, bandwidth 3.3kHz, and 2024 points. MRS spectra were analyzed with a nonlinear AMARES algorithm implemented in jMRUI1. Prior to quantification, spectra were preprocessed with an apodization 3Hz, and a manually zero-order phase correction. The area under the curve for each pic of triglyceride molecule was fitted assuming a Lorentzian line shape.
The number of double bonds (ndb), the number of double bonds separated by a single CH2 (nmidb), and mean chain length (MCL), such as the fractions of polyunsaturated (PUFA), monounsaturated (MUFA), and saturated (SFA) fat were calculated with equations described in previous studies 4,5. Data were expressed as mean ± SD. One-way ANOVA with a Tukey’s test multiple comparisons (GraphPad-Prism 9) were used. P-values < 0.05 were considered significant.
Results
T2-weighted images showed higher accumulation of white adipose tissue in GF-T mice relative to the SPF and the GF mice (Figure 1 A-C). Noticeable storage of adipose tissue in SPF mice and GF-T mice was seen in the subcutaneous, and perigonadal regions. In GF mice, adipose tissue was mostly observed in the perigonadal region. Interestingly, the difference in fat accumulation between SPF and GF mice was not related to the body weight since both groups showed no difference in this feature (body weight SPF: 25.33 ± 2.34g; GF: 26 ± 2.28g; GF-T: 35.19 ± 2.76g).The representative spectra obtained from the perigonadal regions for all three study groups using single-voxel MR spectroscopy are shown in Figure 1D. All the relevant resonance peaks of triacylglycerol were identified (P1-P9). The water peak (at 4.7ppm) was negligible for most of the mice.
The ndb in the perigonadal adipose tissue was significantly lower in the GF-T mice compared to the SPF (p=0.0003) and GF mice (p=0.0026) (Figure 2A). There was no a significant difference between the SPF and the GF groups (p=0.0915), however, ndb tended to be higher in GF mice.
A significantly lower nmidb and MCL were also observed in the GF-T group compared to the SPF (nmidb: p=0.0003, MCL: p=0.0136) and GF (nmidb: p=0.0001, MCL: p=0.0026) groups.
The PUFA were 15% and 10% higher in SPF and GF mice relative to those in GF-T mice, respectively. The MUFA in GF-T group were over 6% higher compared to the SPF group. No differences were observed in SFA among the three groups of mice.
Discussion
In this work, we evaluated several MRS biomarkers of the lipid composition in mice with different microbiota backgrounds. Our findings showed differences in white adipose tissue storage, lipid composition, and fatty acid composition among the different groups. In line with our results, it has been previously reported that microbiota transplantation leads to a change in gut microbes and genes expression, influencing the relative proportion of lipid and fatty acid contents in other organs such as brain and liver8. Given the importance of adipose tissue in the energy balance and lipid metabolism, the study of lipid composition using MRS can contribute to understanding and monitoring noninvasively the relationship between microbiota and adipose tissue in obesity.Conclusion
Our study showed that MRS can be used to evaluate differences in the lipid composition in the white adipose tissue in mice with different microbiota. This suggests that MRS can be used as a noninvasive tool to monitor dysbiotic gut microbiota in obese patients and evaluate a potential therapeutic response for obesity.Acknowledgements
We thank Louis Lambret for helping with the MRS acquisitions during his master internship granted by Genotoul.
References
1. Wrzosek, L., Ciocan, D., Borentain, P. et al. Transplantation of human microbiota into conventional mice durably reshapes the gut microbiota. Sci Rep 8, 6854 (2018). https://doi.org/10.1038/s41598-018-25300-3.
2. Virtue AT, McCright SJ, Wright JM, et al. The gut microbiota regulates white adipose tissue inflammation and obesity via a family of microRNAs. Sci Transl Med. 2019;11(496):eaav1892. doi:10.1126/scitranslmed.aav1892.
3. Suárez-Zamorano N, Fabbiano S, Chevalier C, et al. Microbiota depletion promotes browning of white adipose tissue and reduces obesity. Nat Med. 2015;21(12):1497-1501. doi:10.1038/nm.3994.
4. Hamilton G, Yokoo T, Bydder M, Cruite I, Schroeder ME, Sirlin CB, Middleton MS. In vivo characterization of the liver fat ¹H MR spectrum. NMR Biomed. 2011 Aug;24(7):784-90. doi: 10.1002/nbm.1622. Epub 2010 Dec 12. PMID: 21834002; PMCID: PMC3860876.
5. Strobel K, van den Hoff J, Pietzsch J. Localized proton magnetic resonance spectroscopy of lipids in adipose tissue at high spatial resolution in mice in vivo. J Lipid Res. 2008 Feb;49(2):473-80. doi: 10.1194/jlr.D700024-JLR200. Epub 2007 Nov 16. PMID: 18024705.
6. Stefan D, Di Cesare F, Andrasescu A, Popa E, Lazariev A, Vescovo E, Strbak O, Williams S, Starcuk Z, Cabanas M, van Ormondt D, Graveron-Demilly D. Quantitation of magnetic resonance spectroscopy signals: the jMRUI software package. Meas. Sci. Technol. 2009;20:104035.
7. Vanhamme L, van den Boogaart A, Van Huffel S. Improved method for accurate and efficient quantification of MRS data with use of prior knowledge. J Magn Reson. 1997;129:35–43. doi: 10.1006/jmre.1997.1244.
8. Albouery M, Buteau B, Grégoire S, Cherbuy C, Pais de Barros JP, Martine L, Chain F, Cabaret S, Berdeaux O, Bron AM, Acar N, Langella P, Bringer MA. Age-Related Changes in the Gut Microbiota Modify Brain Lipid Composition. Front Cell Infect Microbiol. 2020 Jan 14;9:444. doi: 10.3389/fcimb.2019.00444. PMID: 31993375; PMCID: PMC6970973.
Figures
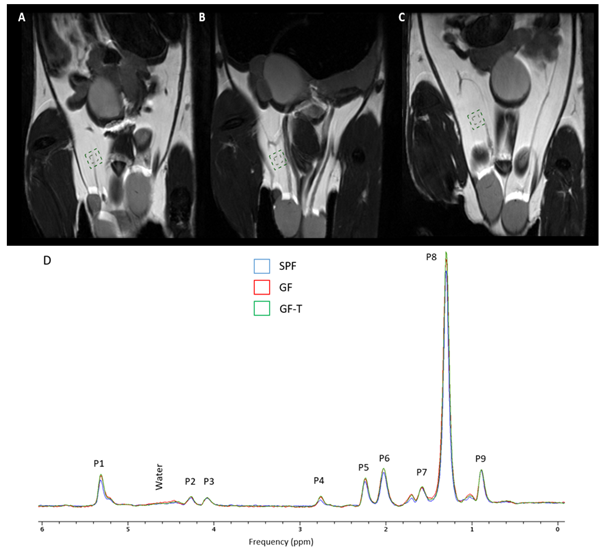
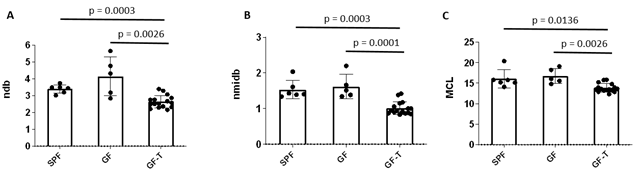
Figure 2. Bar graphs of the number of double bonds (ndb) (A), the number of double bonds separated by a single CH2 (nmidb), and mean chain length (MCL) for the specific pathogen-free (SPF), germ-free (GF), and germ-free mice transplanted (GF-T) mice.
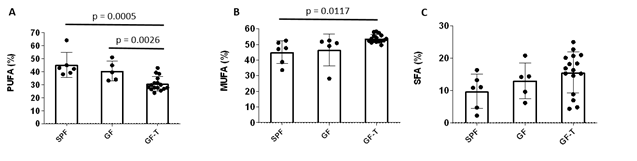
Figure 3. Bar graphs of the fractions of polyunsaturated (PUFA)(A), monounsaturated (MUFA)(B), and saturated (SFA)(C) fat for the specific pathogen-free (SPF), germ-free (GF), and germ-free mice transplanted (GF-T) mice.