0152
Field-Cycling imaging identifies breast cancer at low magnetic field strengths1Aberdeen Biomedical Imaging Centre, University of Aberdeen, Aberdeen, United Kingdom, 2Institute of Medical Engineering, Graz University of Technology, Graz, Austria, 3Breast unit, Aberdeen Royal Infirmary, Aberdeen, United Kingdom, 4Institute of eHealth, University of Applied Sciences FH JOANNEUM, Graz, Austria, 5BioTechMed-Graz, Graz, Austria
Synopsis
Field-Cycling imaging (FCI) can image over a range of low magnetic field strengths (0.2 T to 0.2 mT) through rapid switching between magnetic field levels. This allows measuring the field-depended changes of the longitudinal T1 relaxation time, known as T1 dispersion, exploring new approaches for breast tumour contrast. FCI images were acquired from patients with breast tumours to generate multi field-T1 maps and T1 dispersions. The T1 maps exhibited visible contrast of the tumour region. T1 dispersion profiles from tumours differed from those in healthy breast tissues, showing that FCI can detect breast tumours at low field strengths.
Introduction
Standard clinical MRI is the mainstay of diagnosis in breast cancer. However standard MRI has limitations in determining the subtypes of tumours, which originate from different cells and therefore contain different types of proteins, and in certain cases may underestimate breast tumour margins. New approaches are being explored using low-field devices but breast cancer contrast in such regime is poorly known.Field-Cycling imaging1,2 (FCI) is a novel modality that can image over a range of low magnetic field strengths through rapid switching between magnetic field levels. This allows measuring the field-depended changes of the longitudinal T1 relaxation time, known as T1 dispersion. T1 dispersion provides information on molecular dynamics exploiting novel biomarkers that is invisible to conventional MRI. A whole-body field cycling system2 has been developed for clinical studies in Aberdeen, allowing multi-field T1 mapping at any field from 0.2 T to 0.2 mT. The aim of our study was to determine if FCI can detect and characterise breast tumours without the need for exogenous contrast or exposure to strong magnet, which present higher risks.
Methods
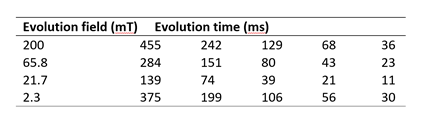
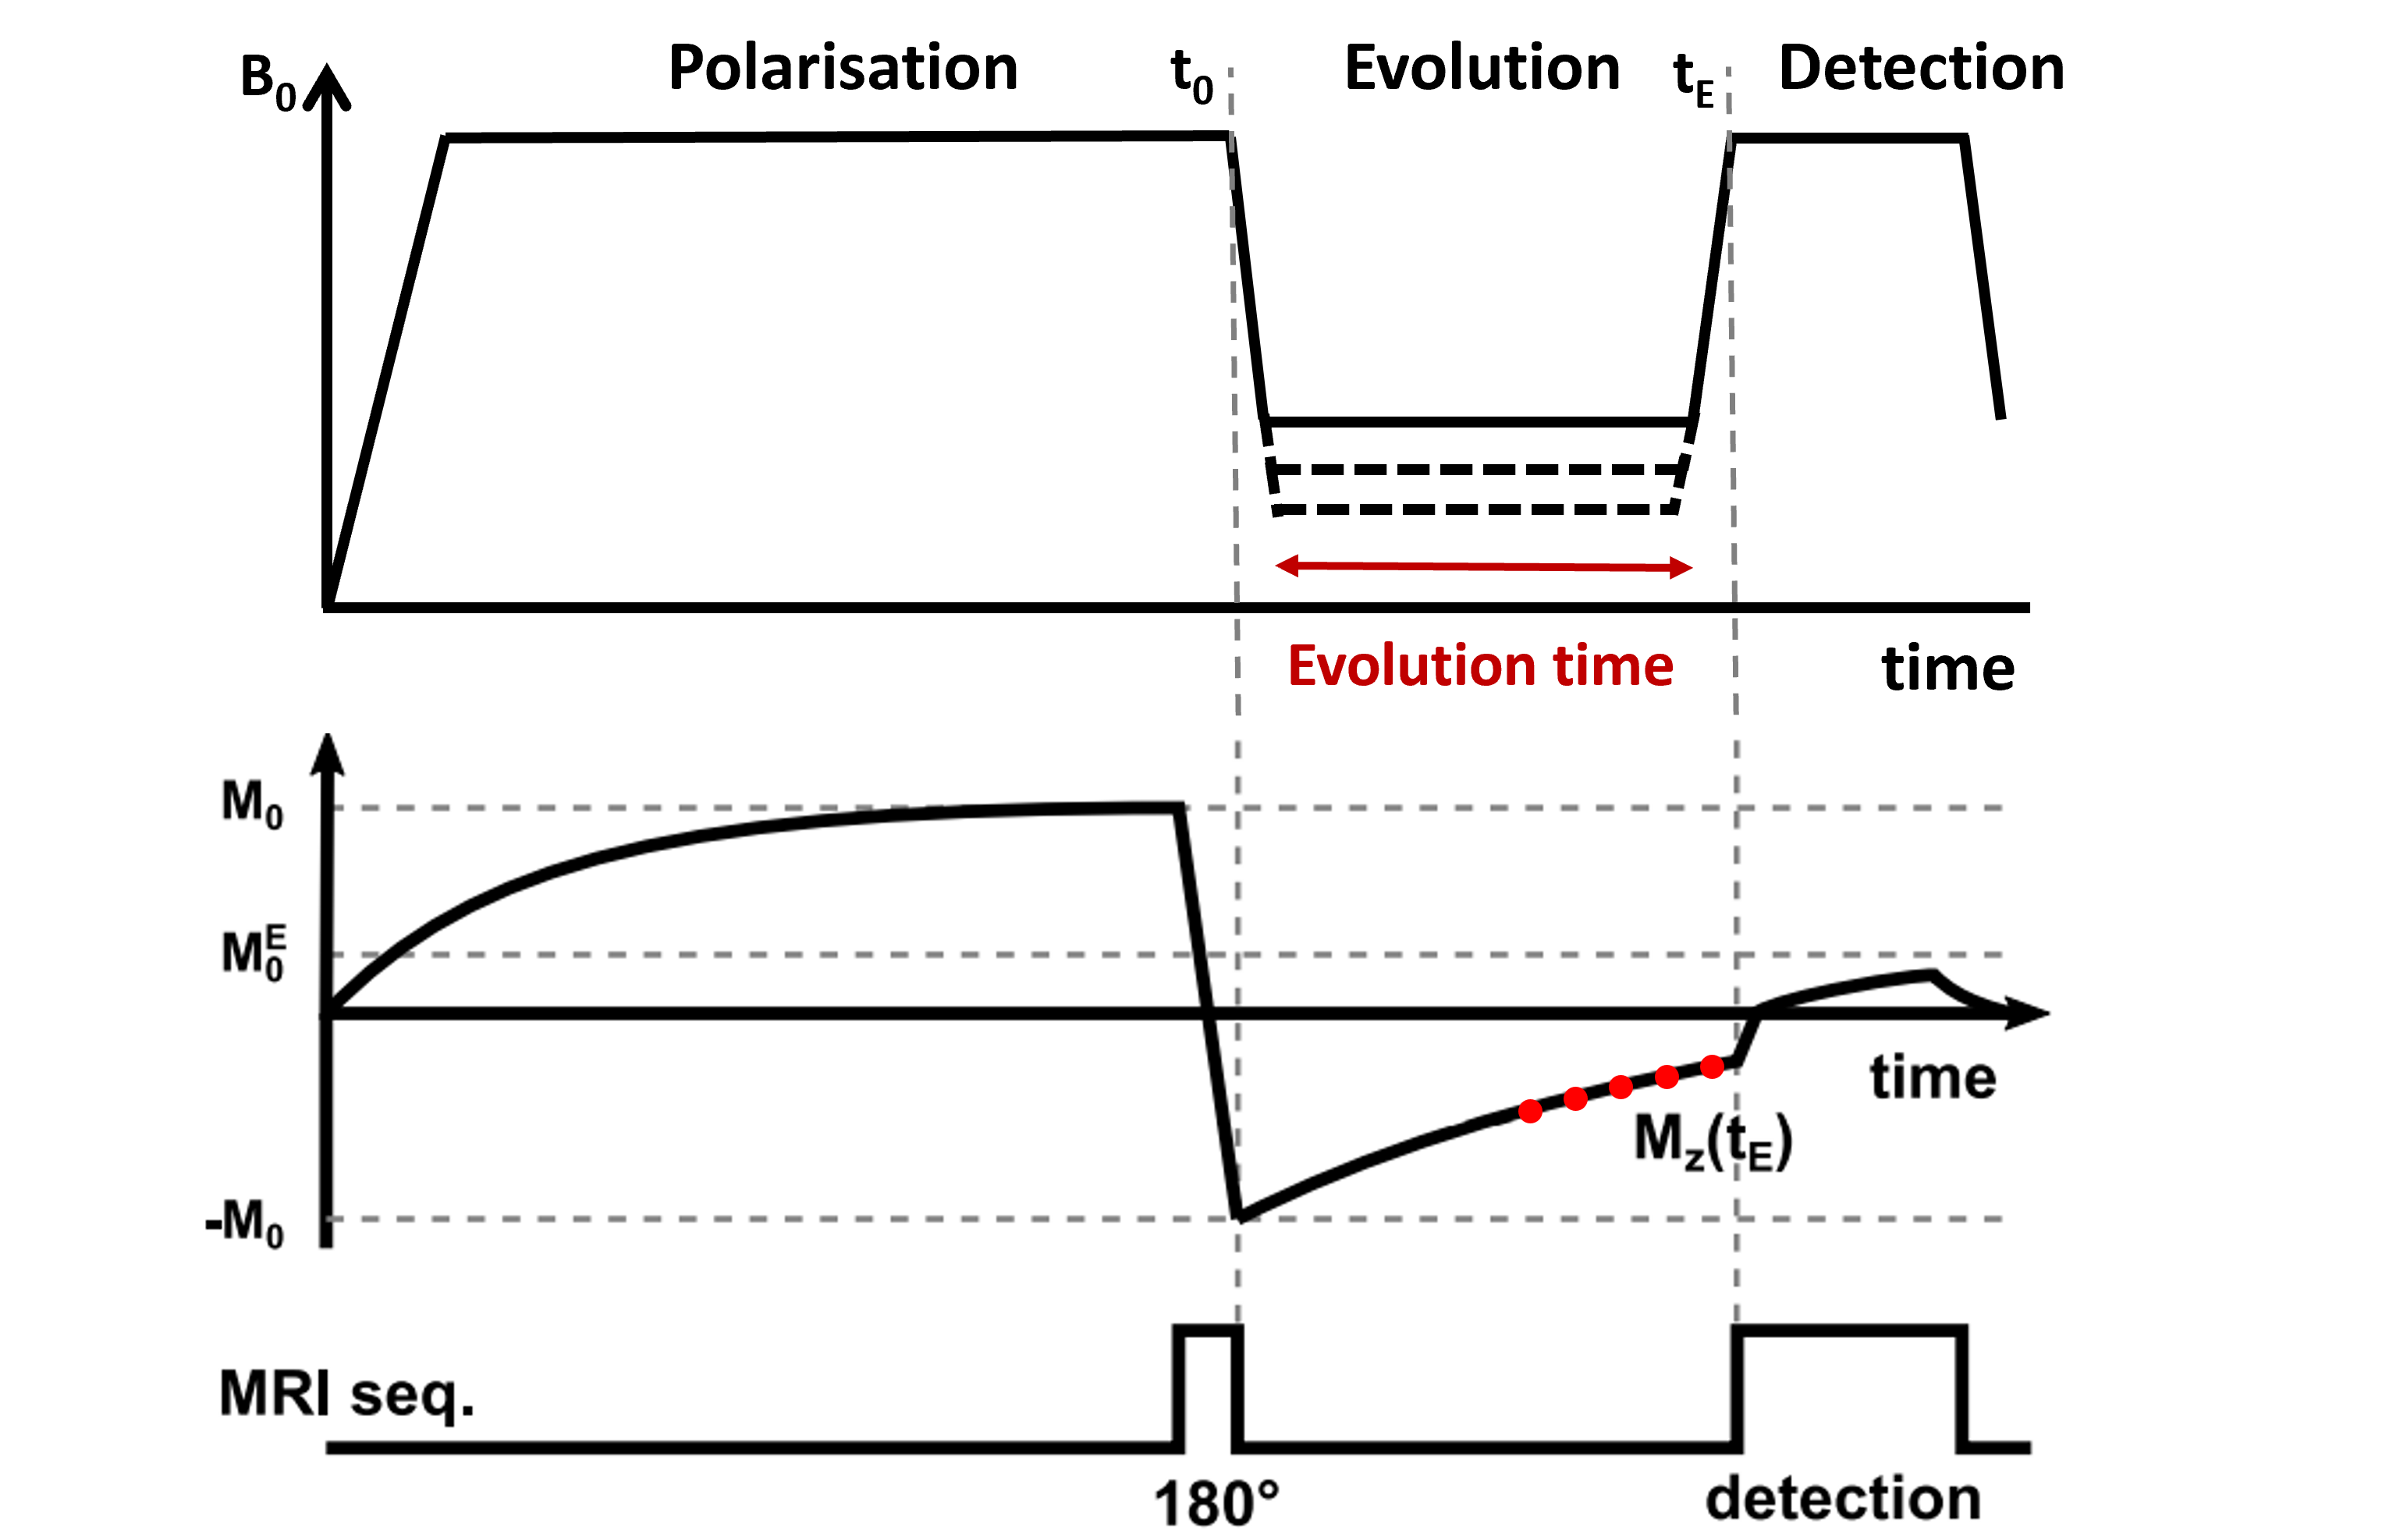
Six patients with breast cancer gave informed consent to participate to the study from 01/2019 to 10/2021 (ethics approved by NoSREC, number 19/NS/0064). Patients were diagnosed with DCIS (n = 3), IDC (n=1), ILC with high-grade DCIS (n = 1), and multi fragmented tumour (n = 1). FCI images were acquired using a field-cycled inversion recovery spin echo sequence (Figure 1) with four evolution fields (at 200 mT, 65.8 mT, 21.7 mT, 2.3 mT), five evolution times (Table 1), in-plane resolution of 2 to 4 mm, FOV of 300 to 500 mm, slice thickness of 10 mm, TE of 16 ms, matrix size of 128 x128, one slice and no averaging. Duration of the FCI examination was 45 minutes including setup, axial and sagittal scout images and FCI images. The patients had a clinical mammogram and ultrasound (US) and a 1.5T MRI scan if clinically indicated, which were used for comparison.Data analysis was done in MATLAB (Mathworks, 2019a, Natick, USA) using in-house software3. Multi-field T1 quantification was performed in Python using a joint TGV regularisation in conjunction with an iteratively regularized Gauss-Newton approach4,5. Region of interest (ROI) selection was performed manually using MATLAB. T1 dispersions were extracted from two ROIs: tumour and breast adipose tissue in the contralateral breast. The position of the tumour found from T1 maps was compared with mammograms, US and MRI images for validation.
Results
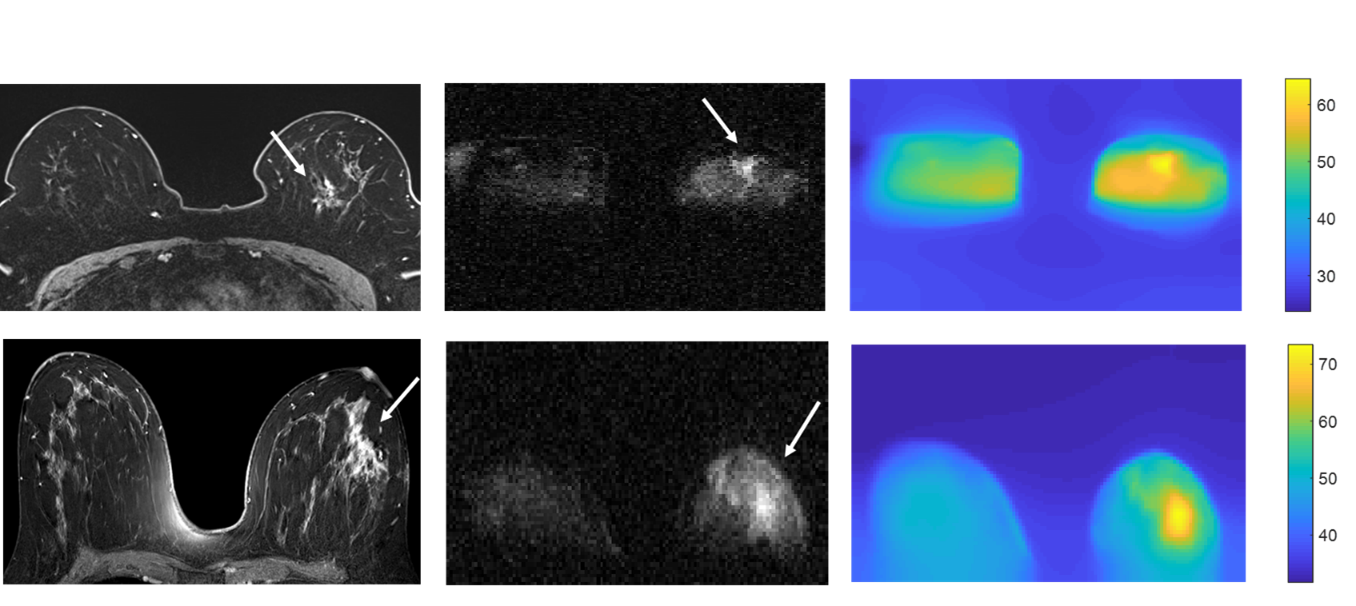
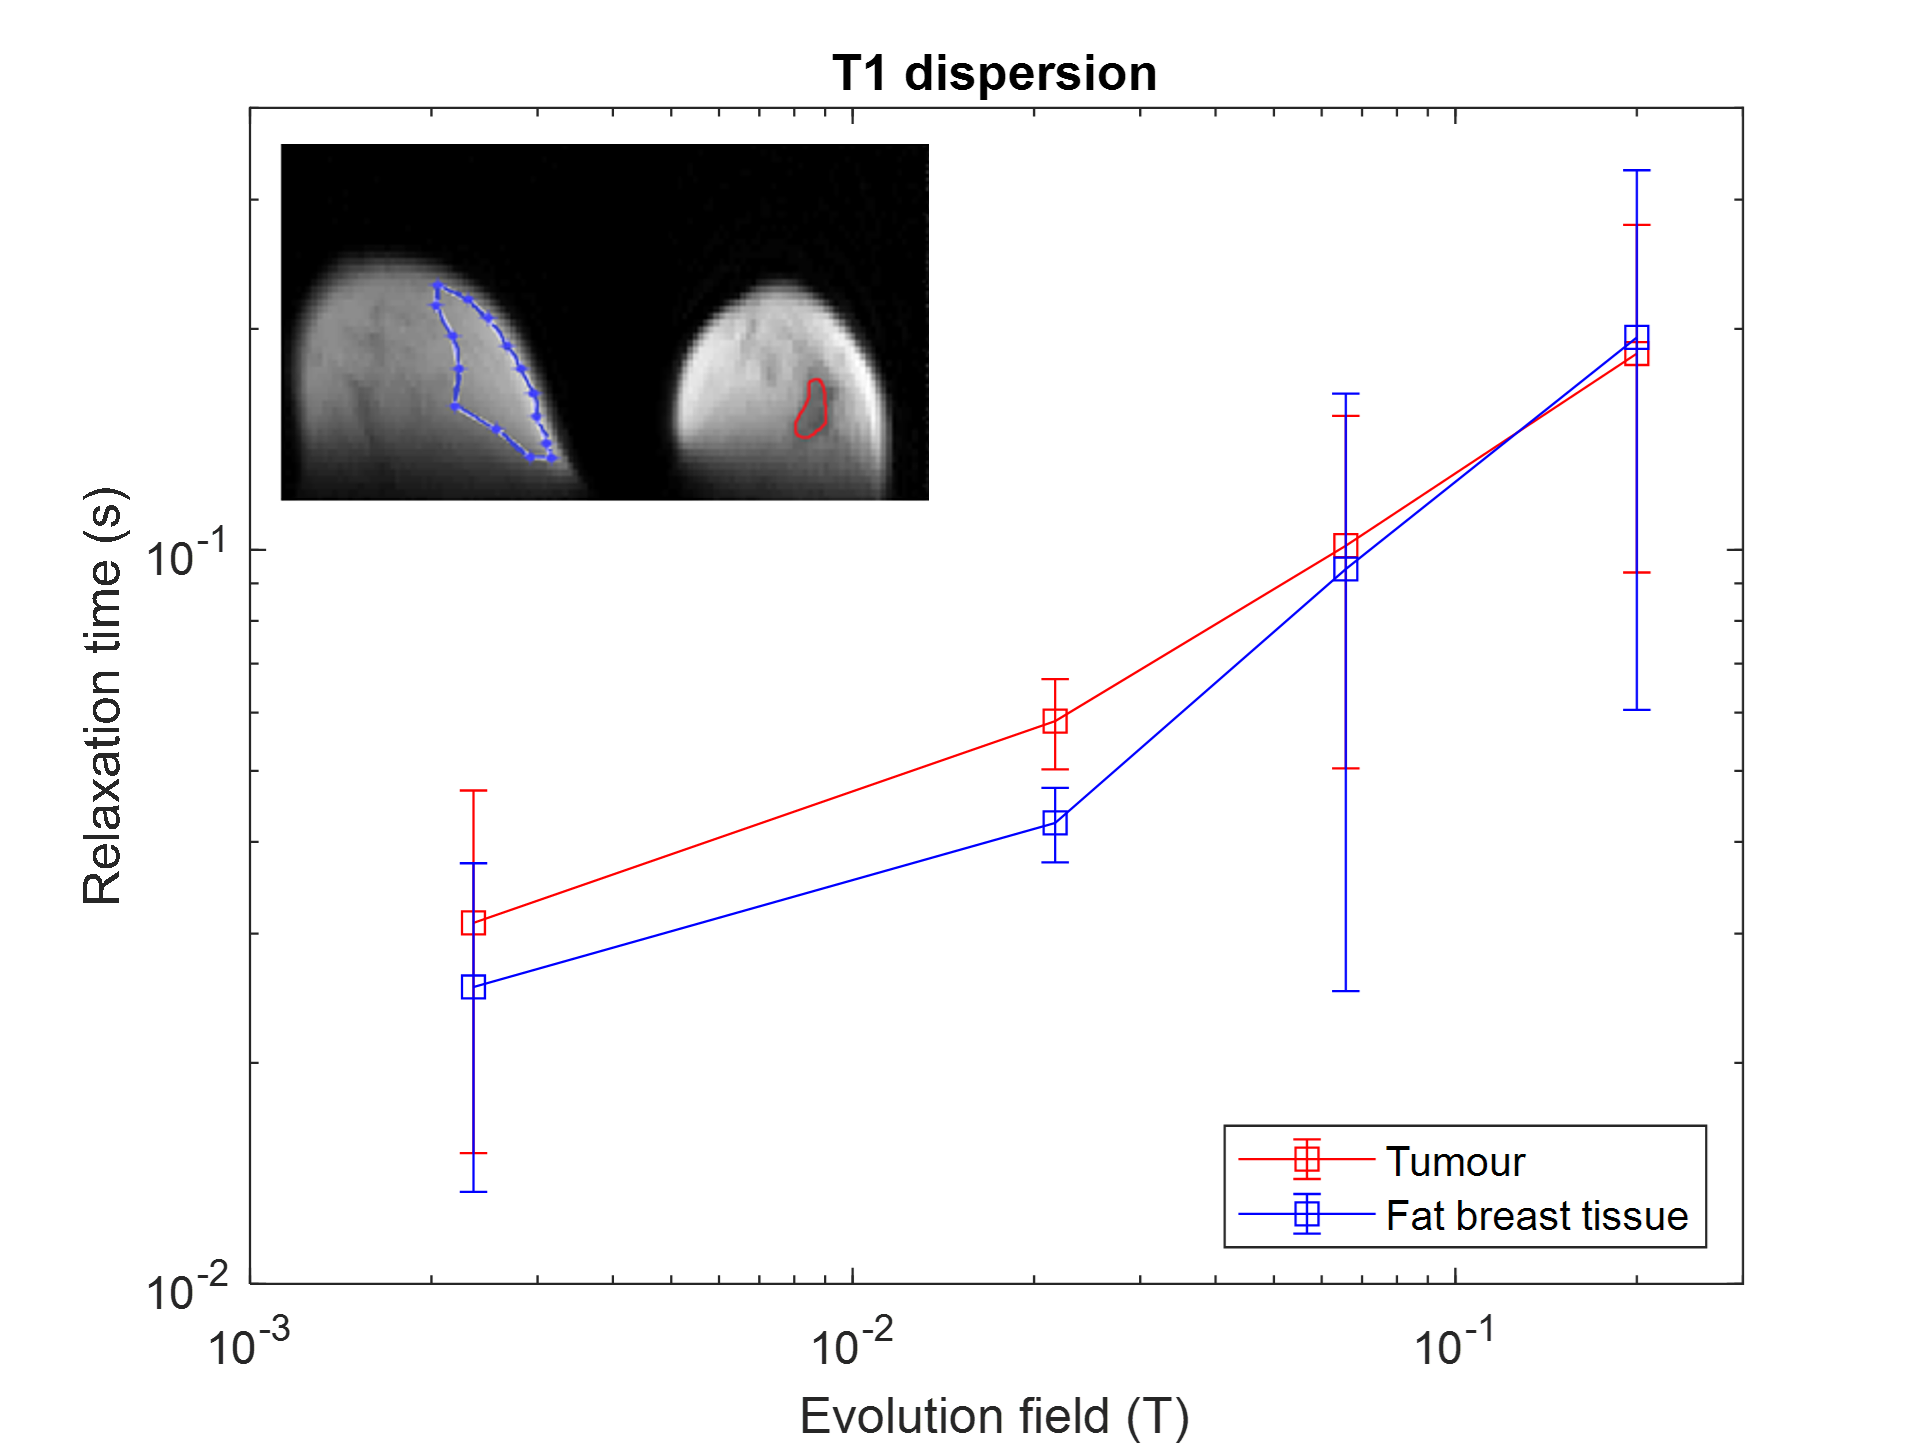
The tumour region measured by FCI exhibited hyper-intense regions at low field strengths that corresponded with the clinical MRI images (Figure 2). The region of the tumour measured by T1 maps corresponded with the clinical MRI images (Figure 2). In two patients, the tumour appeared larger in FCI than conventional imaging, as confirmed at pathology. In patient I (ILC with high-grade DCIS), the tumour size was approximately 40 mm on FCI as confirmed at pathology compared to 17-22 mm on US/MRI/mammography, with conventional imaging locating mainly the ILC (Figure 2, top row). In patient II (high-grade DCIS), the tumour size was 55 mm on FCI and MRI, as confirmed at pathology, compared to 10 mm on US (Figure 2, bottom row). The in-vivo T1 dispersions showed different profiles between breast tumours and healthy fat breast tissues at 21.7 mT and below (Figure 3).Discussion
This is the first-ever measurement of T1 dispersion in patients with breast cancer. The results showed that FCI can differentiate between breast tumours and healthy breast tissue without the use of contrast agents at low field strengths. FCI was shown to perform well to locate high-grade DCIS. Changes in T1 relaxation may reflect enhanced water diffusion across tumour cell membranes6 and we are exploring the mechanisms of T1 differences by conducting relaxometry experiments on ex vivo human breast tumour samples7. We are currently recruiting more patients to explore the optimal T1 contrast and test if FCI can differentiate between different types of breast tumours.Acknowledgements
No acknowledgement found.References
1. Lurie, D. J. et al. Fast field-cycling magnetic resonance imaging. Cr Phys. 2010;11, 136-148.
2. Broche LM, Ross PJ, Davies GR, MacLeod MJ, Lurie DJ. A whole-body Fast Field-Cycling scanner for clinical molecular imaging studies. Sci. Rep. 2019;9(1):10402.
3. Broche LM, Ross PJ, Davies GR, Lurie DJ. Simple algorithm for the correction of MRI image artefacts due to random phase fluctuations. Magn. Reson. Imaging. 2017;44:55-59.
4. Bödenler M, Maier O, Stollberger R, Broche LM, Ross PJ, MacLeod MJ, Scharfetter H. Joint multi-field T1 quantification for fast field-cycling MRI. Magn. Reson. Med. 2021; 86:2049–2063.
5. Maier O, Spann SM, Bödenler M, Stollberger R. PyQMRI: An accelerated Python based Quantitative MRI toolbox. Open Source Softw. 2020;5: 2727.
6. Ruggiero MR, Baroni S, Pezzana S, Ferrante G, Geninatti Crich S, Aime S. Evidence for the Role of Intracellular Water Lifetime as a Tumour Biomarker Obtained by In Vivo Field-Cycling Relaxometry. Angew Chem Int Ed Engl. 2018;57(25):7468-7472.
7. Hanna K, Husain E, Masannat Y, Abu-Eid R, Speirs V, Broche L. Pre-clinical fast field-cycling NMR for the detection and classification of breast cancer. ISMRM 2022 [Conference presentation abstract].
Figures