0143
Heterogeneous diffusivity changes within human stroke lesions measured with oscillating gradient spin echo diffusion MRI1Biomedical Engineering, University of Alberta, Edmonton, AB, Canada, 2Neurology, University of Alberta, Edmonton, AB, Canada, 3Radiology and Diagnostic Imaging, University of Alberta, Edmonton, AB, Canada, 4Siemens Healthcare GmbH, Erlangen, Germany
Synopsis
Short diffusion time oscillating gradient spin echo (OGSE) showed less water diffusion reduction in acute human stroke lesions (n=28) than the typical clinically used long diffusion time pulsed gradient spin echo (PGSE) method. The diffusion time dependency is far greater in ischemic lesions, particularly white matter, than in contralateral healthy brain. These effects were heterogeneous across the lesion with larger OGSE-PGSE differences in regions indicative of larger axons. The range of MD decrease in lesions across patients as measured with OGSE and PGSE showed a linear correlation and is consistent with concomitant axon beading and swelling implied from prior simulations.
Introduction
The origin of lower mean diffusivity (MD) in acute ischemia is uncertain, although membrane beading has been proposed as a viable option1. Oscillating gradient spin-echo (OGSE) diffusion MRI with short diffusion time (e.g., 6 ms) can be compared to pulsed gradient spin-echo (PGSE) with longer diffusion time (e.g., 40 ms) to investigate microstructure alteration at different spatial scales. MD values in ischemic cortical gray matter (GM) were reduced by less for OGSE than PGSE in rat post-mortem2 and mouse hypoxia-ischemia3, as well as in white matter (WM) of human acute stroke (n=9; OGSE -8% MD reduction, PGSE -37%), where Monte Carlo simulations suggested a combination of axonal beading and swelling4. The purpose here was to explore the heterogeneity of OGSE-PGSE diffusivity differences in acute human stroke, and to do so in a larger independent population on a clinical 3T scanner (4.7T previous4).Methods
The 28 (sub)acute stroke patients were 65±17 (28-93) years old, 20 males, NIH stroke scale score 6±5 (0-21), scanned 21±12 (1.3-49) hours after stroke onset, and had lesion volumes of 8±12 (0.3-47) cm3. Both OGSE and PGSE were acquired with a prototype single shot spin-echo EPI sequence at 3T (MAGNETOM Prisma, Siemens Healthcare, Erlangen, Germany) with: 20 axial slices, 3 mm thick (no gap), 1.85x1.85 mm2 in-plane resolution, GRAPPA R=2, TR 5600ms, TE 78ms, b=500 s/mm2 (compared to b=300 s/mm2 in reference4), 6 directions, 3 averages, and scan time 2:26 min for each. OGSE used trapezoid cosines at 40 Hz with diffusion time ~6 ms (compared to 50 Hz in reference4) while PGSE had a typical diffusion time of 40 ms. Maps of OGSE-PGSE MD difference were created by voxel-to-voxel subtraction following image coregistration, excluding CSF. Radial diffusivity (RD) and axial diffusivity (AD) differences were also compared. Manual regions-of-interest were identified in WM (n=26) or GM (n=21) within the acute lesion and the contralateral hemisphere for comparison of OGSE- and PGSE-derived DTI metrics (i. ipsi-/contralateral difference for OGSE and PGSE separately, ii. OGSE versus PGSE in both regions).Results
Representative OGSE MD – PGSE MD subtraction maps in Figure 1 show greater MD difference in lesions compared to contralateral tissue. OGSE MD is slightly greater than PGSE MD in contralateral tissue, but is substantially less reduced than PGSE MD in lesions. Notably, the OGSE-PGSE MD difference maps show heterogeneity within the lesion, with some areas (e.g., internal capsule part of a lesion in patient #4) yielding OGSE-PGSE MD differences as high as 0.21x10⁻³ mm2/s.Lesion WM MD was 35% lower than contralateral MD for PGSE, but only 26% lower for OGSE, while in contralateral tissue itself, OGSE MD was 4% greater than PGSE MD (Figure 2a). The OGSE-PGSE difference in lesions is greater for AD (0.13x10⁻³ mm2/s) than RD (0.10x10⁻³ mm2/s) (p=0.000227), although the relative change is greater for RD (24%) than AD (17%) (Figure 2b, c). Similar trends were observed in GM albeit to a lesser extent (data not shown). The OGSE-PGSE diffusivity differences did not correlate with age, stroke onset, or NIHSS score (data not shown).
The OGSE ΔMDrel [(Contra-Lesion)/Contra)] showed a strong linear correlation (R2=0.68, p=1.85x10⁻⁷) with PGSE ΔMDrel in lesion WM (Figure 3). The PGSE ΔMDrel ranged from 20-50% over all 26 stroke patients, and across this range the linear fit suggests an OGSE ΔMDrel approximately 10% less, such that 25/35/45% MD drops on PGSE corresponded to 15/25/35% MD drops on OGSE.
Discussion
Greater OGSE-PGSE diffusivity differences in the ischemic lesion (primarily in WM) compared to ‘healthy’ contralateral brain is consistent with animal models2,3 and a human study4. However, the OGSE MD reduction measured here (-26%) was considerably greater than in reference4 (-8%) despite similar PGSE MD reduction (-35% versus -37%). Our greater OGSE MD drop could be due to our use of lower OGSE frequency (40 Hz versus 50 Hz) and different OGSE waveforms5 (1 period on current 3T study versus 2 periods on former 4.7T study4).OGSE-PGSE MD map examination highlights heterogeneity within lesions, with the greatest MD differences typically occurring in large medial WM tracts like internal capsule. Coherent, larger axons demonstrate greater diffusivity differences with diffusion time6 and are expected to show greater changes with beading than crossing or dispersed fibres7.
The 10% offset in ΔMDrel between OGSE and PGSE (regardless of the ΔMDrel magnitude) is a new observation enabled by the large sample size of 26 patients. The Monte Carlo simulations in Figure 4c,d of reference4 show several combinations of beading and increased intracellular volume fraction (with ischemia) that fit this 10% less MD reduction in WM lesions on OGSE than PGSE.
In summary, the interrogation of short diffusion times with OGSE yields insight into the axonal perturbations of human acute stroke that lead to clinically useful reduced diffusivity.
Acknowledgements
Supported by the Heart and Stroke Foundation of Canada and China Scholarship Council.References
1. Budde M, Frank J. Neurite beading is sufficient to decrease the apparent diffusion coefficient after ischemic stroke. PNAS, 2010, 107: 14472.
2. Does M, Parsons E, Gore J. Oscillating gradient measurements of water diffusion in normal and globally ischemic rat brain. Magnetic Resonance in Medicine: An Official Journal of the International Society for Magnetic Resonance in Medicine, 2003, 49: 206.
3. Wu D, Martin L, Northington F, Zhang J. Oscillating gradient diffusion MRI reveals unique microstructural information in normal and hypoxia‐ischemia injured mouse brains. Magnetic Resonance in Medicine, 2014, 72: 1366.
4. Baron C, Kate M, Gioia L, Butcher K, Emery D, Budde M, Beaulieu C. Reduction of diffusion-weighted imaging contrast of acute ischemic stroke at short diffusion times. Stroke, 2015, 46: 2136.
5. Van A, Holdsworth S, Bammer R. In vivo investigation of restricted diffusion in the human brain with optimized oscillating diffusion gradient encoding. Magnetic Resonance in Medicine, 2014, 71: 83.
6. Xu J, Li H, Harkins K, Jiang X, Xie J, Kang H, Does M, Gore J. Mapping mean axon diameter and axonal volume fraction by MRI using temporal diffusion spectroscopy. Neuroimage, 2014, 103: 10.
7. Skinner N, Kurpad S, Schmit B, Budde M. Detection of acute nervous system injury with advanced diffusion‐weighted MRI: a simulation and sensitivity analysis. NMR in Biomedicine, 2015, 28: 1489.
Figures

Figure 1. Raw DWI b500, PGSE- and OGSE-derived MD (scaled the same), and the MD difference maps (overlaid on FA map) are shown for a single slice from six acute stroke patients. The lower MD in the ischemic lesion is not as pronounced on OGSE as it is on PGSE, which is better visualized on the OGSE MD – PGSE MD difference map. There is also heterogeneity in the MD diffusion time differences within many of the lesions, e.g., left anterior limb of internal capsule (arrow) of patient 4.

Figure 2. (a) MD, (b) AD, and (c) RD of contralateral WM (blue) and lesion WM (orange) in 26 acute stroke patients (mean ± SD). The % reduction of MD, AD and RD in lesion WM relative to contralateral WM (top numbers) was greater for typical PGSE (33-38%) than OGSE (22-31%). From PGSE to OGSE, MD, AD and RD had larger changes in lesion WM (17-24%) than in contralateral WM (4-6%), with RD showing the greatest percent changes with diffusion time. * p<0.05.
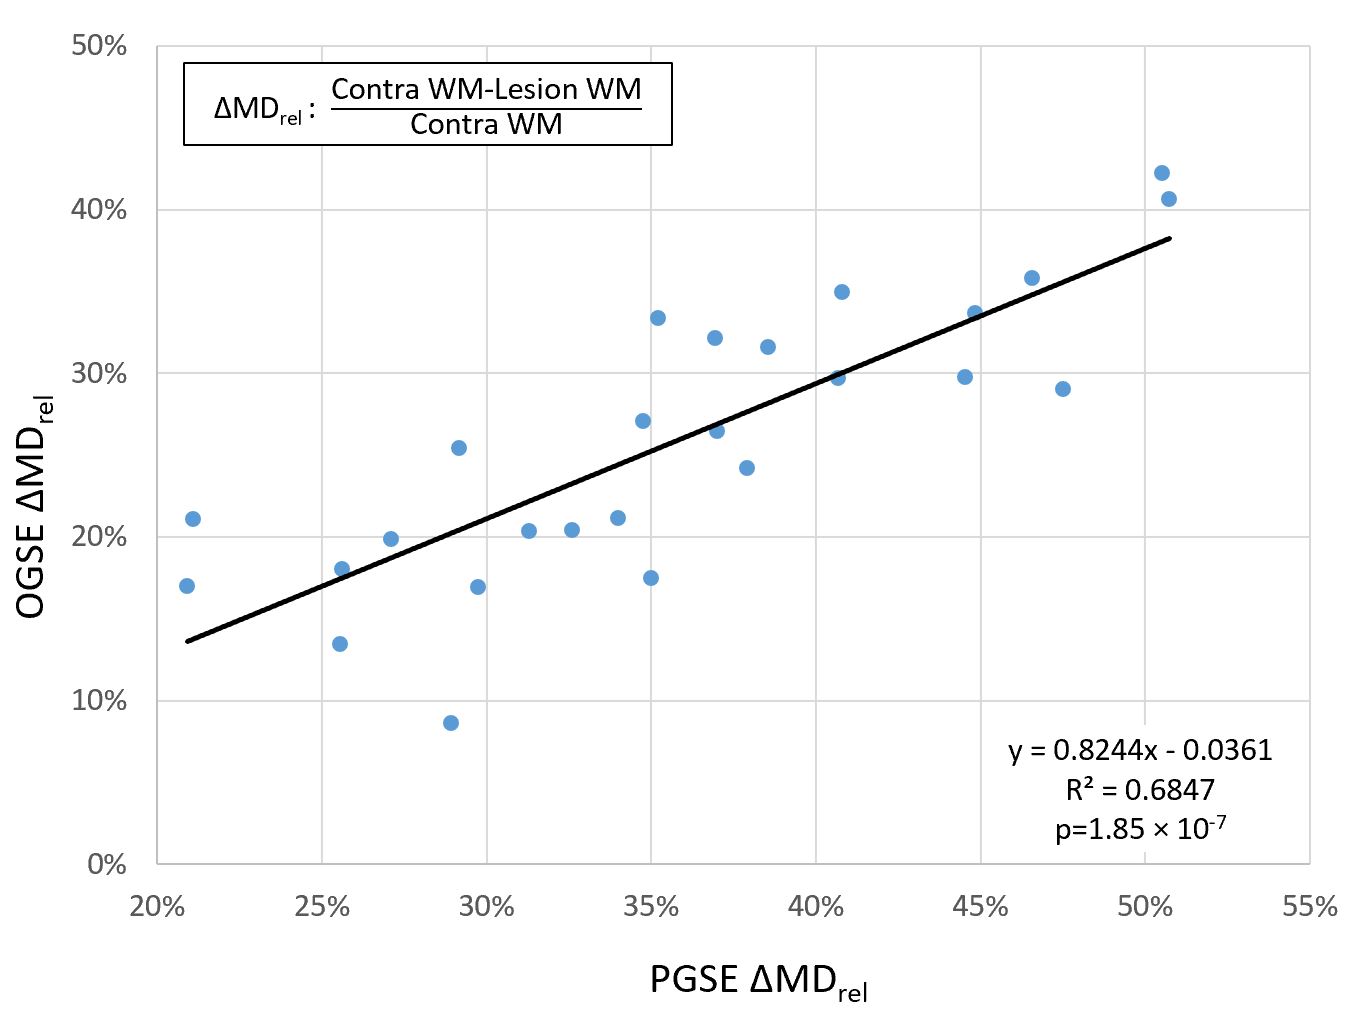
Figure 3. The long diffusion time PGSE shows a typical ΔMDrel range of 20-50% in the lesion WM relative to contralateral WM in the 26 stroke patients (each circle) with WM lesions. Interestingly, a new observation was that the short diffusion time OGSE ΔMDrel was linearly correlated to the PGSE ΔMDrel. However, the OGSE ΔMDrel is about 10% less than the PGSE ΔMDrel in each patient (e.g., 50% for PGSE corresponds to 40% for OGSE, etc.).