0141
Cortical thickness at 3 years post-ischemic stroke: seeking vascular imaging signatures1The Florey Institute of Neuroscience and Mental Health, Parkville, Australia, 2Turner Institute for Brain and Mental Health, Monash University, Clayton, Australia
Synopsis
Cortical thinning has been used both for diagnosis and disease monitoring. Few studies have examined longitudinal changes in cortical thickness following ischemic stroke. We compared cortical thinning, vortex-wise and region-wise, between ischemic stroke survivors and stroke-free control participants at 3 months and 3 years post-stroke using linear mixed-effect regression and correcting for age and sex. At 3 years, there was widespread cortical thinning in ischemic stroke, especially in the ipsilesional cortex, in lobes implicated in motor, sensory, and memory processing and recovery.
Introduction
Cortical thinning patterns have been described in many neurodegenerative diseases including Alzheimer’s disease1-4. Assessment of cortical thinning has also been used both for diagnosis and disease monitoring5,6. The imaging signatures of post-stroke and vascular cognitive impairment have not been well described. In this study, we compared cortical thinning between ischemic stroke survivors and stroke-free control participants at 3 months and 3 years post the stroke incident.Methods
Forty healthy controls and 111 ischemic stroke survivors from the Cognition And Neocortical Volume After Stroke (CANVAS)7 study were scanned at 3 months with 1-mm isotropic T1-weighted MRI. At the 3-year follow-up, MRI and cognitive data for 38 controls and 90 stroke patients were available. Vertex-wise cortical thicknesses on ipsilesional and contralesional hemispheres were estimated using longitudinal FreeSurfer (V6) cortical reconstruction and volumetric segmentation according to the ‘Desikan-Killiany' parcellation atlas. FreeSurfer inaccuracies in the cortical ribbon were manually corrected and ipsilesional vertices affected by stroke infarcts were excluded using binary stroke lesion masks traced a-priori using FLAIR MRI. Family-wise corrections for multiple comparisons were completed using a two-stage adaptable false detection rate (FDR) at a significance level of 0.05.Differences at 3 months between control and stroke groups on demographic and clinical variables were examined using two-sample t-test, Wilcoxon Rank Sum test, or Fisher Exact test (in MATLAB, R2019b) depending on variable type and distribution normality. A linear mixed-effect regression model with random intercept was used to compare vertex-wise cortical thickness between groups adjusting for age and sex. Comparison between groups was also completed based on mean regional thickness (i.e., thickness averaged over each of FreeSurfer 34 cortical parcellations in each hemisphere).
Results
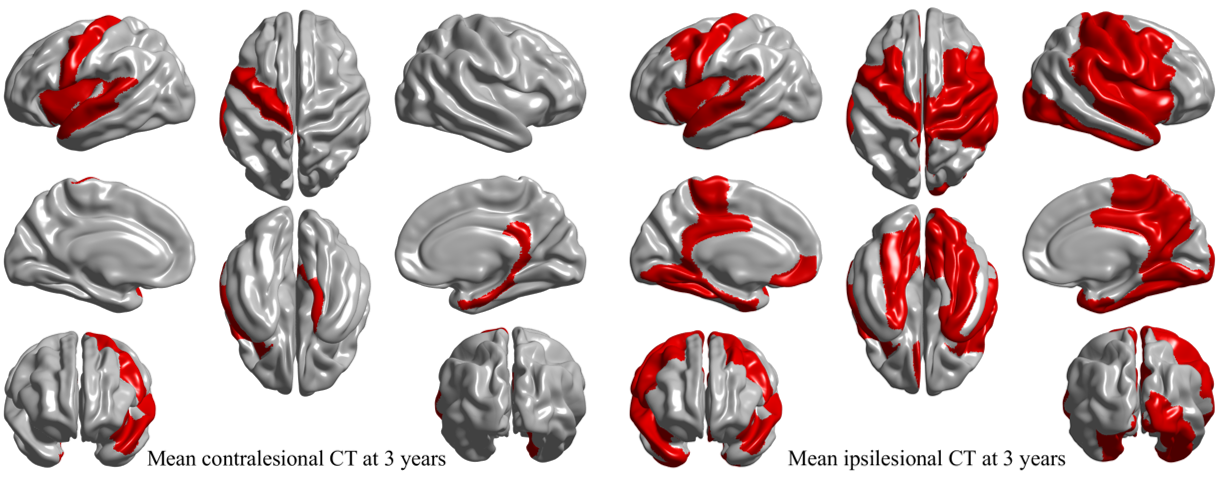
Groups were matched on age, sex, Charlson comorbidity index, hypertension, diabetes mellitus history, and apolipoprotein-E ɛ4 carrier allele presence. Controls had more years of education and had less atrial fibrillation (see Table 1). Age was significantly associated with global mean cortical thickness beyond group or sex influences. Sex was also associated with cortical thickness with women in both groups having significantly thicker cortex (p = 0.002).Differences in vertex-wise cortical thickness between healthy individuals and stroke patients were limited at 3 months post-stroke but were more pronounced at 3 years (see Figure 1). Contralesionally, significant cortical thinning in stroke was observed at 3 years in areas including bilateral insula and precentral, left superior temporal, fusiform, and precuneus, and right parahippocampal and temporal pole cortices (p < 0.0003). Ipsilesionally, clusters with significant cortical thinning in stroke were larger and included bilateral insula, central and temporal regions and precuneus; left posterior cingulate and medial orbitofrontal; and right cuneus and superior frontal cortices (p<0.0031). Areas of vertex-wise significant thinning in stroke at 3 years (as shown in Figure 1) were also replicated with the assessment of cortical thinning based on mean regional cortical thickness (see Figure 2).
Discussion
Few studies have examined longitudinal changes in cortical thickness following ischemic stroke. In this study, we have investigated vertex-wise and region-wise cortical thinning in ischemic stroke survivors in comparison to an age-matched and sex-matched cohort of healthy individuals. We have shown that global mean cortical thickness was negatively associated with age with no significant interaction between age and sex or between age and participating group. We also have found females to have a thicker cortex with no interaction with group after correcting for age. These findings are well aligned with a study of a large healthy cohort where cortical thickness was found to steeply decrease with age during second and third decades of life and gradually thereafter8. The study also reported steeper cortical thinning in males during mid-life (30 – 59 years).Early after stroke (i.e., at 3 months), there were limited areas with significant vertex-wise thinning on both ipsilesional and contralesional hemispheres. Over 3 years, cortical thinning in these areas expanded and the expansion was more pronounced in the ipsilesional hemisphere. There results were also corroborated by analyses based on region-wise mean cortical thickness. Consistent with stroke effects, areas of significant cortical thinning at 3 years included precentral, insula, posterior singular cortex, superior temporal, medial temporal primary motor (entorhinal and fusiform), and precuneus; areas implicated in motor, sensory, and memory processing and recovery.
Conclusions
Significant widespread cortical thinning, especially in the ipsilesional hemisphere, was observed in stroke survivors at 3 years. Post-stroke cortical thinning patterns may contribute to our understanding of imaging signatures of vascular cognitive impairment.
Acknowledgements
This work was supported by the National Health and Medical Research Council project grant (APP1020526), the Brain Foundation, Wicking Trust, Collie Trust, and Sidney and Fiona Myer Family Foundation. The Florey Institute of Neuroscience and Mental Health acknowledges the strong support from the High Performance Computing (HPC) system operated by Research Platform Services at the University of Melbourne.References
1. Gupta, Y., Lee, K. H., Choi, K. Y., Lee, J. J., Kim, B. C., & Kwon, G.-R. (2019). Alzheimer’s Disease Diagnosis Based on Cortical and Subcortical Features. Journal of Healthcare Engineering, 2019, 2492719. doi:10.1155/2019/2492719.
2. Julkunen, V., Niskanen, E., Muehlboeck, S., Pihlajamäki, M., Könönen, M., Hallikainen, M., . . . Soininen, H. (2009). Cortical thickness analysis to detect progressive mild cognitive impairment: a reference to Alzheimer's disease. Dement Geriatr Cogn Disord, 28(5), 404-412. doi:10.1159/000256274.
3. Racine, A. M., Brickhouse, M., Wolk, D. A., Dickerson, B. C., & Initiative, A. s. D. N. (2018). The personalized Alzheimer's disease cortical thickness index predicts likely pathology and clinical progression in mild cognitive impairment. 10(1), 301-310. doi:https://doi.org/10.1016/j.dadm.2018.02.007.
4. Wang, L., Goldstein, F. C., Veledar, E., Levey, A. I., Lah, J. J., Meltzer, C. C., . . . Mao, H. (2009). Alterations in Cortical Thickness and White Matter Integrity in Mild Cognitive Impairment Measured by Whole-Brain Cortical Thickness Mapping and Diffusion Tensor Imaging. 30(5), 893-899. doi:10.3174/ajnr.A1484 %J American Journal of Neuroradiology.
5. Cheng, C. P.-W., Cheng, S.-T., Tam, C. W.-C., Chan, W.-C., Chu, W. C.-W., & Lam, L. C.-W. (2018). Relationship between Cortical Thickness and Neuropsychological Performance in Normal Older Adults and Those with Mild Cognitive Impairment. Aging and disease, 9(6), 1020-1030. doi:10.14336/AD.2018.0125.
6. Zarei, M., Ibarretxe-Bilbao, N., Compta, Y., Hough, M., Junque, C., Bargallo, N., . . . Martí, M. J. (2013). Cortical thinning is associated with disease stages and dementia in Parkinson's disease. J Neurol Neurosurg Psychiatry, 84(8), 875-881. doi:10.1136/jnnp-2012-304126.
7. Brodtmann, A., et al. (2014). "Charting cognitive and volumetric trajectories after stroke: protocol for the Cognition And Neocortical Volume After Stroke (CANVAS) study. Int J Stroke 9(6): 824-828.
8. Frangou, S., Modabbernia, A., Williams, S. C. R., Papachristou, E., Doucet, G. E., Agartz, I., . . . Dima, D. (2021). Cortical thickness across the lifespan: Data from 17,075 healthy individuals aged 3-90 years. Hum Brain Mapp. doi:10.1002/hbm.25364.
Figures

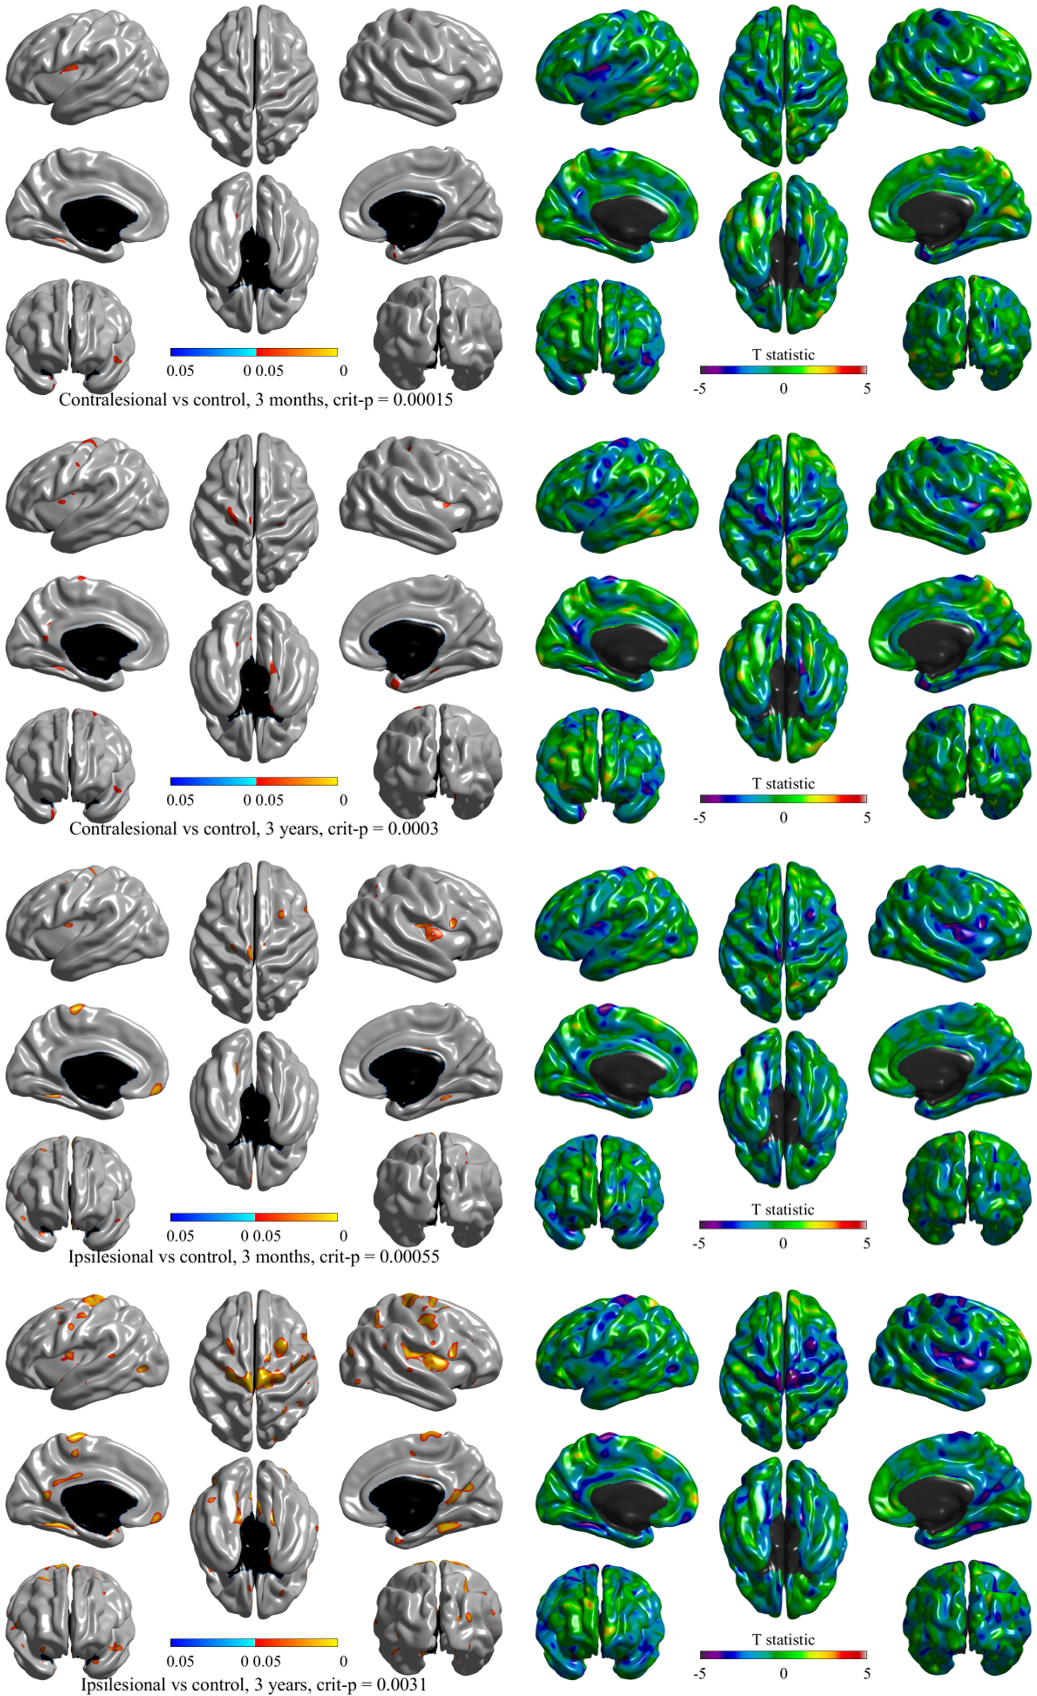
Figure 1 Cortical thickness differences at 3 months and 3 years between healthy controls and stroke patients contralesionally and ipsilesionally. T-statistic maps show all cross-sectional cortical thickness differences while p-maps show significant differences only where p ≤ crit-p obtained with adaptive 2-step FDR correction.