0139
Lesion-specific Metabolic Fingerprinting in Relapsing-Remitting Multiple Sclerosis via 7T Magnetic Resonance Spectroscopic Imaging1High Field MR Centre, Department of Biomedical Imaging and Image-guided Therapy, Medical University of Vienna, Vienna, Austria, 2Department of Neurology, Medical University of Vienna, Vienna, Austria, Vienna, Austria, 3Department of Neurosurgery, Medical University of Vienna, Vienna, Austria, Vienna, Austria, 4Biomedical Center Martin, Jessenius Faculty of Medicine in Martin, Comenius University in Bratislava, Martin, Slovakia, 5Clinic of Neurology, Jessenius Faculty of Medicine in Martin, Comenius University in Bratislava, Martin, Slovakia, 6Karl Landsteiner Institute for Clinical Molecular MRI in Musculoskeletal System, Vienna, Austria
Synopsis
Conventional T1/T2-weighted magnetic resonance imaging (cMRI) is the method of choice for diagnosis and treatment monitoring of multiple sclerosis (MS), though not being able to explain underlying pathological processes. In contrast to cMRI-lesions, which only reflect the severity of irreversible tissue damage, MR Spectroscopic Imaging (MRSI) can detect pathologies on a biochemical level. In 51 relapsing-remitting (RRMS) patients, we investigate - enabled through ultra-high resolution FID-MRSI at 7T - the metabolic distribution within lesions and their vicinity as well as their location dependency and correlation to T1-hypointensity.
Introduction
cMRI is the method of choice for the diagnosis and treatment monitoring of MS. In contrast to T2-weighted MRI, T1-hypointensity correlates with permanent clinical impairment and reflects the severity of irreversible tissue destruction, but still cannot fully explain all the underlying pathological processes.[1]–[5]FID-MRSI at 7T overcomes prior issues in detecting small focal abnormalities in NAWM and GM due to poor spatial resolution and can thus non-invasively (in a clinically feasible scan time of ~6min) visualize pathophysiological processes by quantifying several brain neurochemicals contributing to lesion formation in MS, such as: elevated choline(Cho)—a marker of myelin turnover—, depleted N-acetylaspartate(NAA)—reflecting reduced neuronal/axonal integrity and function—and increased myo-inositol(mIns)—a marker for astroglial hypertrophy and hyperplasia—the elevation of which correlates with clinical impairment.[6]–[8]
The purpose of our study was, thus, to assess focal metabolic alterations inside and at the periphery of lesions (in)visible on cMRI and to correlate their metabolic changes with T1-hypointensity and the distance of lesions to cortical GM.
Materials and Methods
After approval of the institutional review board, 51 RRMS patients(30 female/21 male; age 35.4±9.9 years) were scanned using a 7T whole-body MR scanner(Magnetom; Siemens Healthcare, Erlangen, Germany) and a 32-channel head coil(NovaMedical, Wilmington, MA).In each session, T1-weighted MP2RAGE images with 0.8x0.8x0.8mm3 spatial resolution and T2-weighted images with 0.86x0.86x0.86mm3 spectral resolution were obtained. FID-MRSI was performed with acquisition delay 1.3ms[9]; TR 200ms; flip angle 27°; 4-fold CAIPIRINHA acceleration[10]; scan time 6:06min; matrix size 100x100; and 2.2x2.2x8mm3 nominal voxel volume.
Inhouse developed MATLAB post-processing included prescan-based coil combination[11], 2D-CAIPIRINHA reconstruction[10], spatial Hamming filtering, and lipid signal removal[12]. Individual spectra were fitted via LCModel in the spectral range of 1.8 to 4.2ppm using a basis-set of 17 simulated metabolites[13] and a measured macromolecular background[14]. Metabolic maps, quantification precision(Cramer-Rao Lower Bounds(CRLBs)) and spectral quality(SNR, linewidth) were created.
After resampling the metabolic maps to the resolution of T1-weighted MRI, ROIs were segmented manually using ITK-SNAP[15] and categorized into three ROI types: “ROI_cMRI”(MS lesions hypointense on MP2RAGE & hyperintense on FLAIR), “ROI_MRSI”(hyperintense on Ins/tNAA & didn’t match any MP2RAGE or FLAIR lesion) and “ROI_NAWM”. To minimize partial volume errors, only lesions with a volume >20mm³ were included. ROI_cMRI were furthermore categorized according to their T1-hypointensity(Figure3B) and proximity to cortex(Figure5A).
All ROI_cMRI were eroded/dilated three times resulting in seven lesion layers(each ~1mm thick) and were corrected for intruding GM or CSF(Figure4A). Only lesions with original size in the range of 100-400mm³ were included. Metabolic ratios for each lesion layer were normalized to the lesion’s outermost layer.
Using SPSS, descriptive statistics for Ins/tNAA, Ins/tCr, tNAA/tCr, and tCho/tCr were derived for all ROIs. Metabolite levels were compared between different lesion types, T1-hypointensity types, cortical lesion subtypes, and lesion layers via one-way ANOVA and Tukey post-hoc analysis. Correlation between metabolite levels and T1 times was investigated via a two-tailed Pearson correlation analysis. A p<0.05 was considered statistically significant.
Results
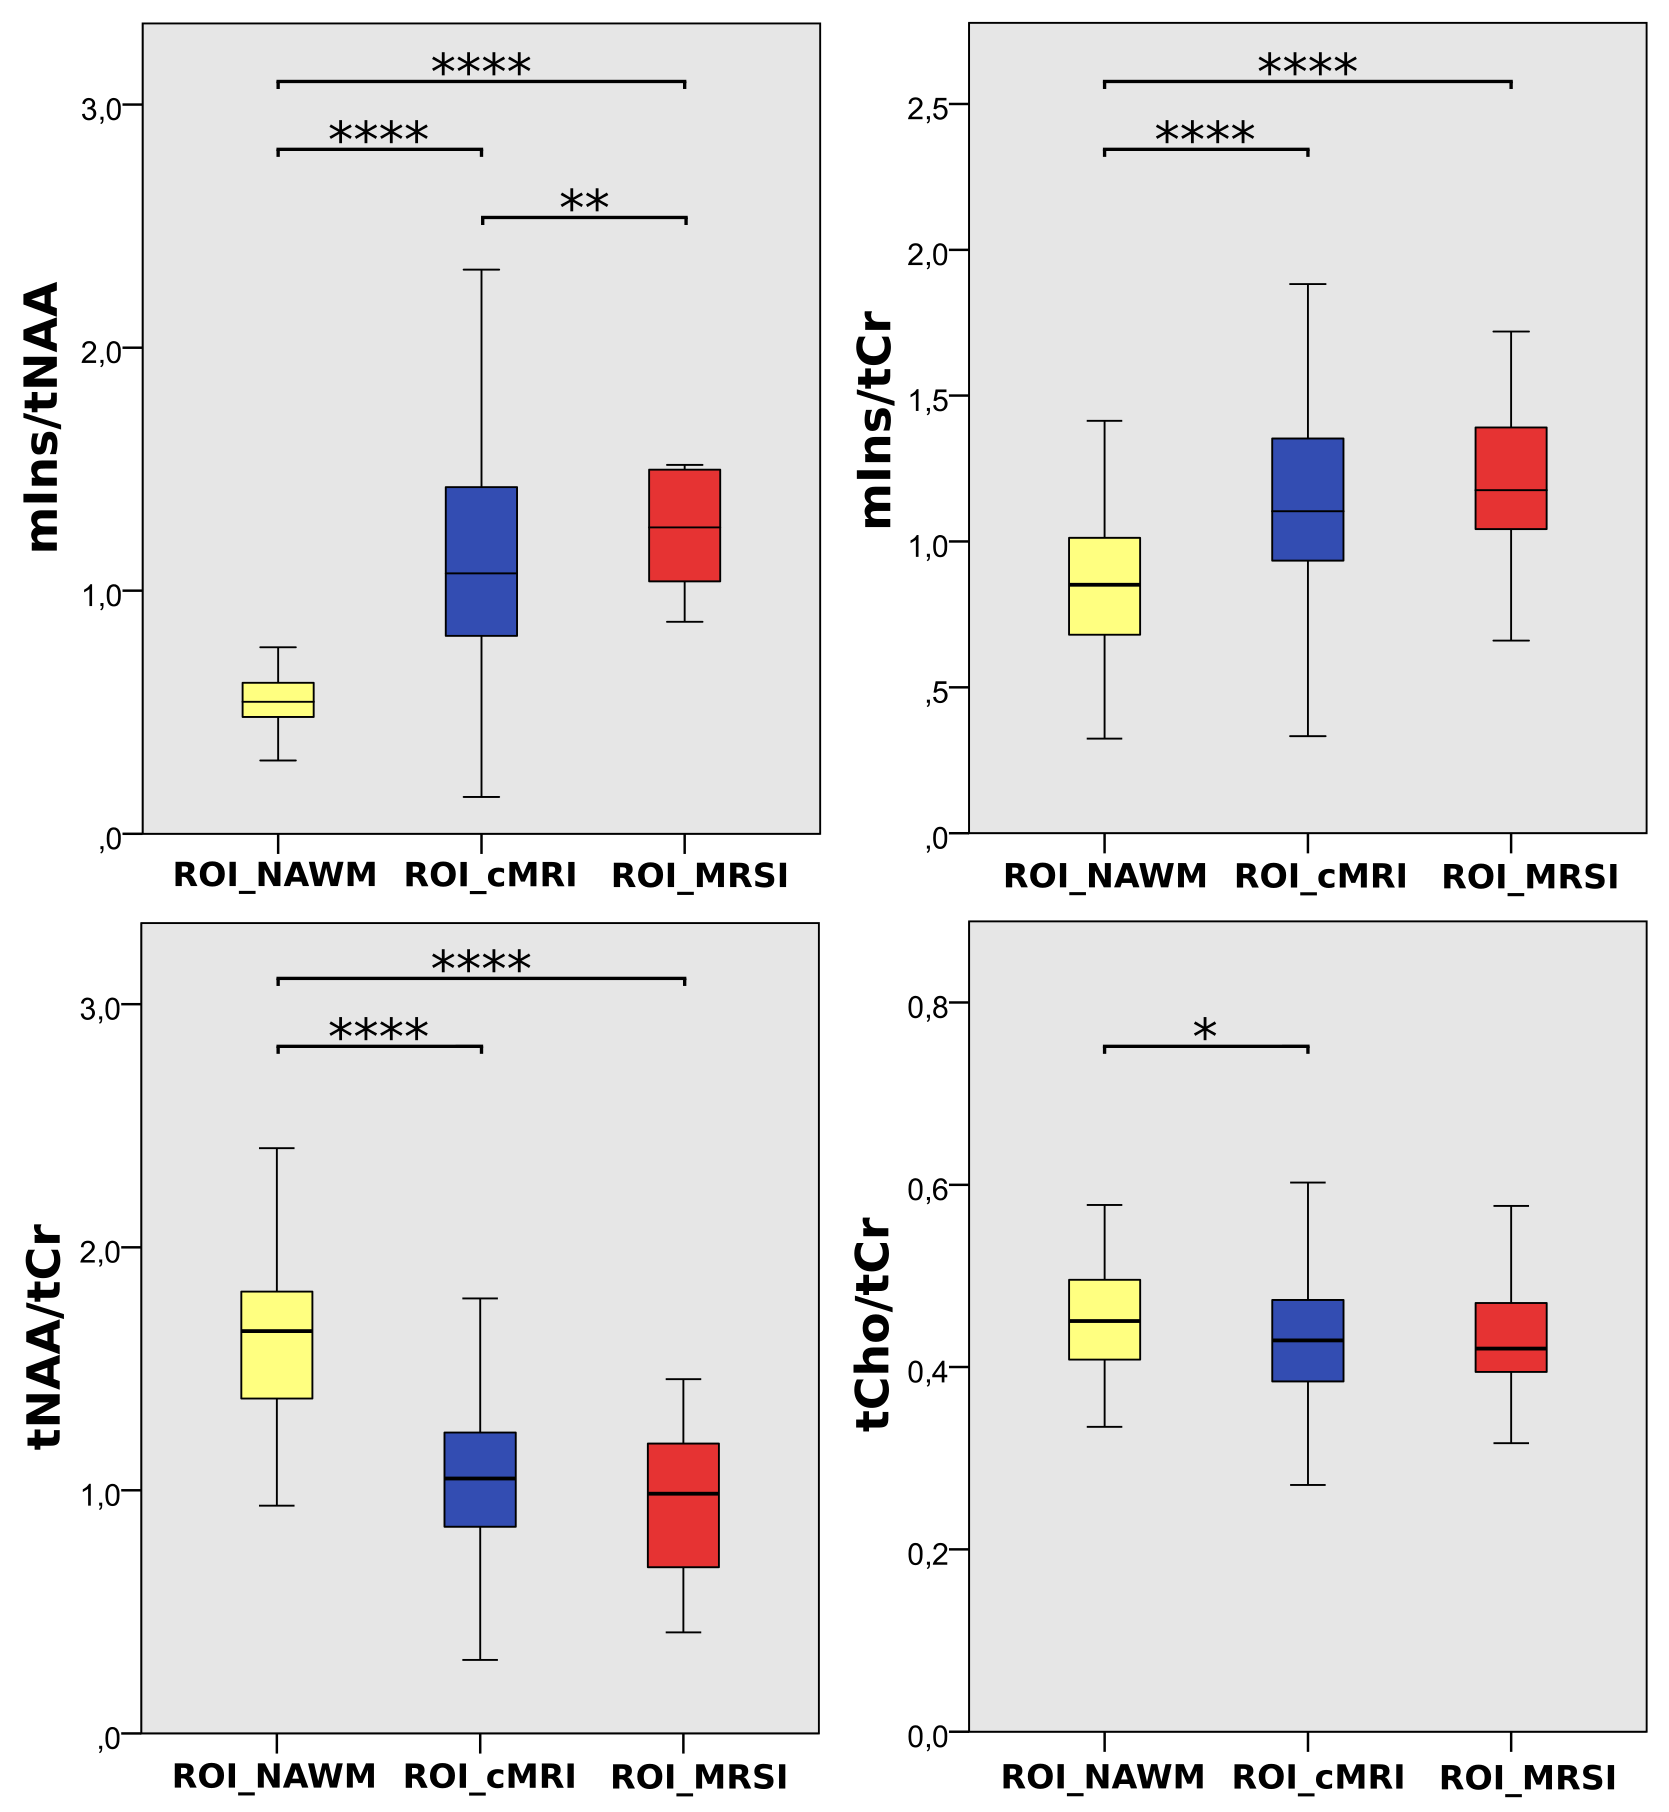
ROI_MRSI lesions of, on average 2.8-fold higher mIns/tNAA than surrounding ROI_NAWM and with an appearance similar to that of MS lesions were found, which were not visible on cMRI(i.e.,~4% of MS lesions)(Figure1&2).Differences in tNAA/tCr between T1-hypointensity subgroups were the most prominent metabolic distinction, with the lowest values in mildly and the highest in severely T1-hypointense lesions(Figure3A). Furthermore, T1 relaxation was positively correlated with mIns/tNAA(p≤0.01), and negatively with tCho/tCr(p≤0.01) and tNAA/tCr(p≤0.01), though interestingly T1 and tNAA/tCr correlated stronger in mildly than in strongly hypointense lesions(Figure3B).
As mIns/tCr was in general increased in ROI_cMRI, but did not show any significant differences between the innermost and outermost layer(L+3vs.L-3:p=0.722) it was consequently increased outside the macroscopic lesion border, while tNAA/tCr distributions resembled macroscopic tissue damage inside the lesions(L+3vs.L-3;1.00±0.00vs.0.85±0.23,p≤0.001;-15.4%)(Figure4B).
Besides tCho/tCr becoming lower the nearer to the cortex, mIns/tCr was -21% lower for (juxta)-cortical lesions than in subcortical and noncortical lesions(p≤0.05)(Figure5B).
Discussion
High-resolution MRSI revealed cMRI-invisible focal regions with similar appearance to MS lesions, that had, on average, 2.8-fold higher mIns/tNAA than surrounding NAWM and 1.3-times higher mIns/tNAA than typical cMRI-visible MS lesions. We hypothesize that these MRSI-visible hotspots represent initial metabolic bursts prior to macroscopically visible lesion formation and that metabolic changes in NAWM are more localized than assumed.A stronger correlation of T1 and tNAA/tCr in mildly hypointense lesions than for strongly hypointense lesions indicates rapid axonal loss at the beginning of lesion formation. The contrary was found for mIns/tCr suggesting that reactive gliosis is an early event in lesions formation, while the strong correlation of T1 and tCho/tCr potentially reflects remyelination in early lesions.
We observed altered metabolic activity outside lesions suggesting that the macroscopic lesion boundaries on cMRI cannot, in fact, be equated with the cessation of pathophysiological processes. In addition, we hypothesize that mIns is associated with the expansion of lesions, as increased mIns was found outside lesions while tNAA was not decreased.
Besides the well-known WM-GM distribution of tCho/tCr, mIns/tCr exhibits a decrease with increasing proximity to the cortical GM, which supports the hypothesis that mIns is a biomarker for astrogliosis as cortical lesions have largely non-inflammatory properties.
Conclusion
7T MRSI allows in vivo visualization of focal MS pathology not visible on cMRI and the assessment of metabolite levels in the lesion center, in the active lesion periphery and in cortical lesions.Acknowledgements
No acknowledgement found.References
[1] A. Bitsch, T. Kuhlmann, C. Stadelmann, H. Lassmann, C. Lucchinetti, and W. Brück, “A longitudinal MRI study of histopathologically defined hypointense multiple sclerosis lesions,” Ann. Neurol., vol. 49, no. 6, pp. 793–796, 2001, doi: 10.1002/ana.1053.[2] B. S. Y. Li, J. Regal, B. J. Soher, L. J. Mannon, R. I. Grossman, and O. Gonen, “Brain Metabolite Profiles of T1-Hypointense Lesions in Relapsing-Remitting Multiple Sclerosis,” AJNR Am. J. Neuroradiol., vol. 24, no. 1, pp. 68–74, Jan. 2003.
[3] F. Bagnato et al., “Evolution of T1 black holes in patients with multiple sclerosis imaged monthly for 4 years,” Brain, vol. 126, no. 8, pp. 1782–1789, Aug. 2003, doi: 10.1093/brain/awg182.
[4] P. Brex et al., “Lesion heterogeneity in multiple sclerosis: a study of the relations between appearances on T1 weighted images, T1 relaxation times, and metabolite concentrations,” J. Neurol. Neurosurg. Psychiatry, vol. 68, no. 5, pp. 627–632, May 2000, doi: 10.1136/jnnp.68.5.627.
[5] F. Barkhof and K. K. Koeller, “Demyelinating Diseases of the CNS (Brain and Spine),” in Diseases of the Brain, Head and Neck, Spine 2020–2023: Diagnostic Imaging, J. Hodler, R. A. Kubik-Huch, and G. K. von Schulthess, Eds. Cham (CH): Springer, 2020. Accessed: Jul. 09, 2021. [Online]. Available: http://www.ncbi.nlm.nih.gov/books/NBK554329/
[6] N. De Stefano et al., “Diffuse Axonal and Tissue Injury in Patients With Multiple Sclerosis With Low Cerebral Lesion Load and No Disability,” Arch. Neurol., vol. 59, no. 10, p. 1565, Oct. 2002, doi: 10.1001/archneur.59.10.1565.
[7] M. Filippi et al., “Evidence for widespread axonal damage at the earliest clinical stage of multiple sclerosis,” Brain J. Neurol., vol. 126, no. Pt 2, pp. 433–437, Feb. 2003, doi: 10.1093/brain/awg038.
[8] I. I. Kirov, V. Patil, J. S. Babb, H. Rusinek, J. Herbert, and O. Gonen, “MR Spectroscopy Indicates Diffuse Multiple Sclerosis Activity During Remission,” J. Neurol. Neurosurg. Psychiatry, vol. 80, no. 12, pp. 1330–1336, Dec. 2009, doi: 10.1136/jnnp.2009.176263.
[9] G. Hangel et al., “Ultra-high resolution brain metabolite mapping at 7 T by short-TR Hadamard-encoded FID-MRSI,” NeuroImage, vol. 168, pp. 199–210, Mar. 2018, doi: 10.1016/j.neuroimage.2016.10.043.
[10] B. Strasser et al., “(2 + 1)D-CAIPIRINHA accelerated MR spectroscopic imaging of the brain at 7T,” Magn. Reson. Med., vol. 78, no. 2, pp. 429–440, 2017, doi: https://doi.org/10.1002/mrm.26386.
[11] B. Strasser et al., “Coil combination of multichannel MRSI data at 7 T: MUSICAL,” NMR Biomed., vol. 26, no. 12, pp. 1796–1805, 2013, doi: https://doi.org/10.1002/nbm.3019.
[12] B. Bilgic et al., “Fast Image Reconstruction with L2-Regularization,” J. Magn. Reson. Imaging JMRI, vol. 40, no. 1, pp. 181–191, Jul. 2014, doi: 10.1002/jmri.24365.
[13] A. Naressi et al., “Java-based graphical user interface for the MRUI quantitation package,” Magn. Reson. Mater. Phys. Biol. Med., vol. 12, no. 2, p. 141, Jun. 2001, doi: 10.1007/BF02668096.
[14] M. Považan et al., “Mapping of brain macromolecules and their use for spectral processing of 1H-MRSI data with an ultra-short acquisition delay at 7T,” NeuroImage, vol. 121, pp. 126–135, Nov. 2015, doi: 10.1016/j.neuroimage.2015.07.042.
[15] P. A. Yushkevich et al., “User-guided 3D active contour segmentation of anatomical structures: Significantly improved efficiency and reliability,” NeuroImage, vol. 31, no. 3, pp. 1116–1128, Jul. 2006, doi: 10.1016/j.neuroimage.2006.01.015.
Figures
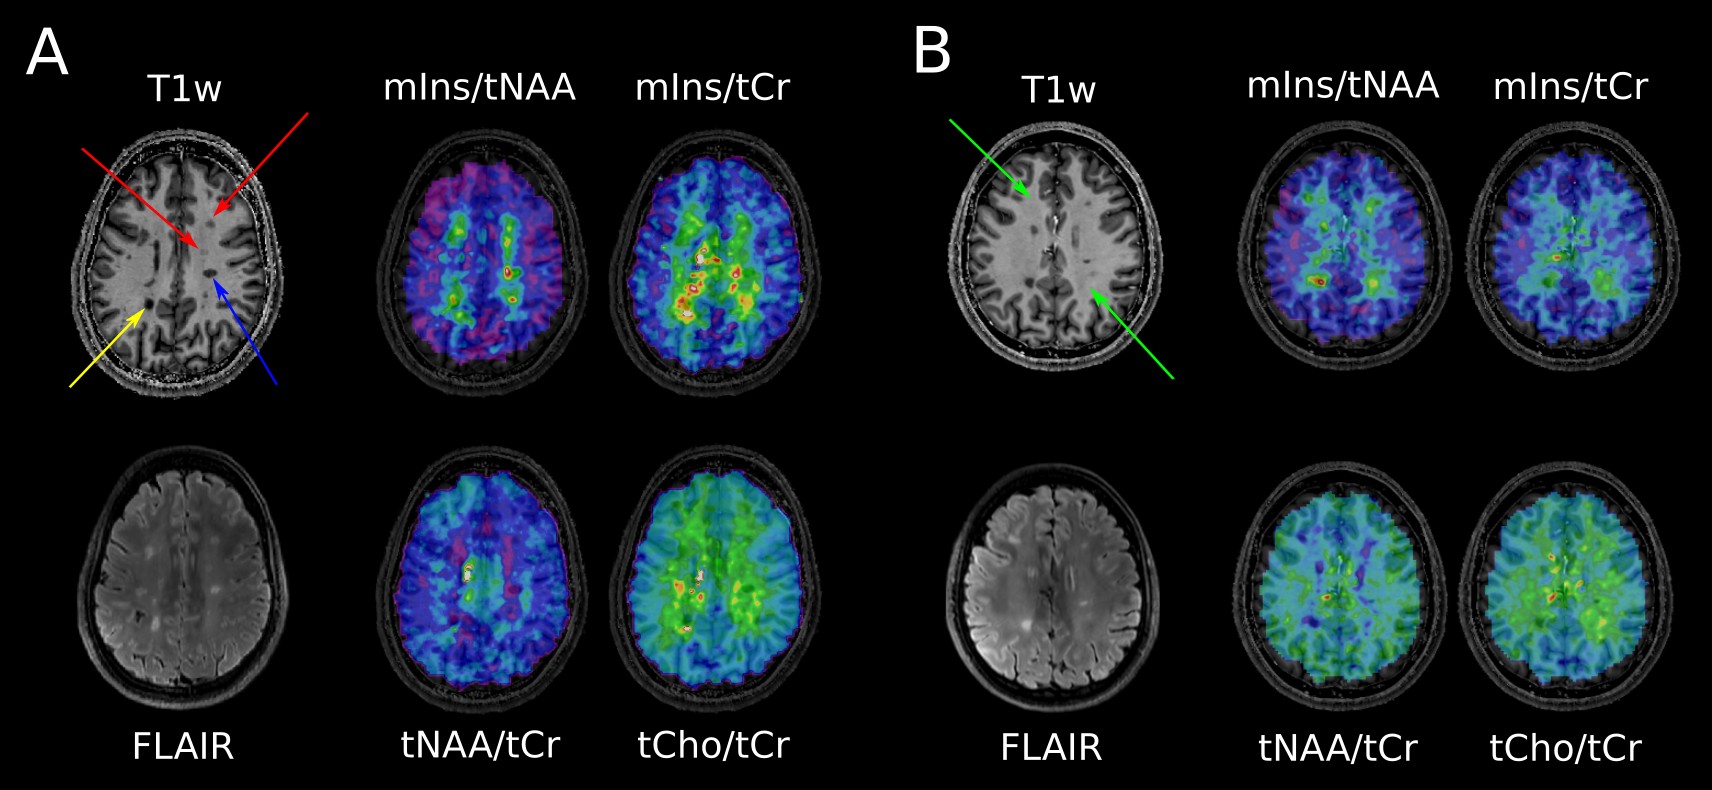
A: cMRI of a MS patient. Yellow arrow points to “severely T1-hypointense” lesion and blue arrow points to “moderately T1-hypointense” lesion, which are both clearly visible on mIns/tNAA, mIns/tCr, and tNAA/tCr metabolic maps. Red arrows depict “mildly hypointense” lesions, which are apparent on mIns/tNAA and mIns/tCr, although only visible as weak hypointensity on MP2RAGE.
B: cMRI of another MS patient. Green arrows point to “MRSI hotspot” lesions, which can neither be seen on MP2RAGE nor on FLAIR, although they demonstrate a large increase on mIns/tNAA and mIns/tCr metabolic maps.

B: Pearson correlation between absolute T1 and mIns/tNAA, mIns/tCr, tNAA/tCr, tCho/tCr
Significant overall correlations were found for mIns/tNAA, tNAA/tCr & tCho/tCr
mIns/tNAA positive correlation for mildly hypointense lesions found which evolved into negative correlation with increasing T1
mIns/tCr increasingly negative correlation for moderately and highly hypointense lesions apparent while
tNAA/tCr & tCho/tCr negative correlation vanished with increasing T1

A: Example of originally segmented MS lesion (a), and seven lesion layer rings (b)-(h) created by dilation/erosion of the original lesion using the mincmorph function. (i) Shows the lesion on MP2RAGE and (j) shows all rings merged.
B: Boxplot diagrams of normalized mIns/tNAA, mIns/tCr, tNAA/tCr, and tCho/tCr show significant differences in metabolite concentrations between the lesion layers for mIns/tNAA, and especially, tNAA/tCr .
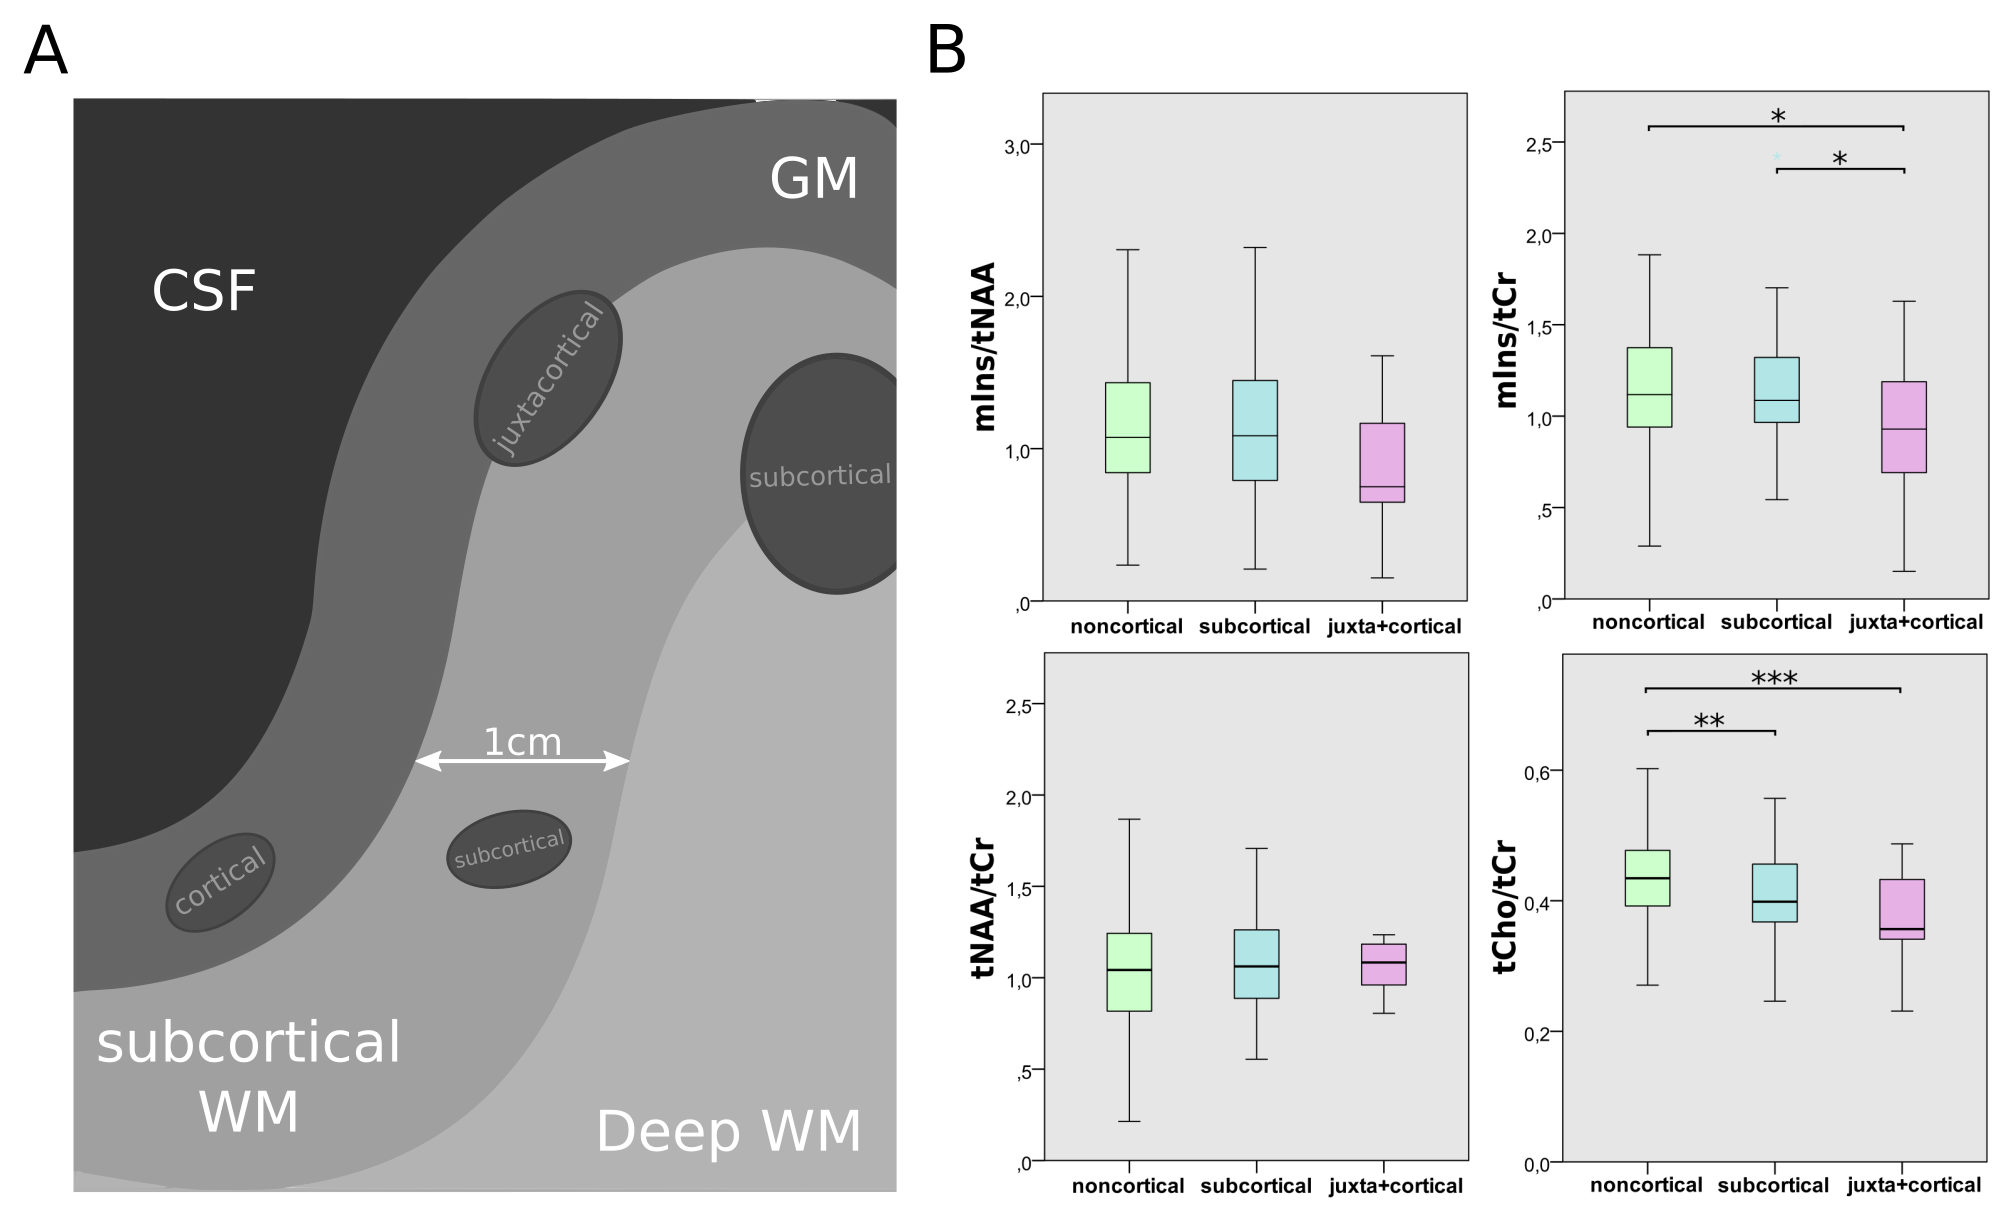
A: schematic depiction of lesion subtypes with regard to lesion proximity to the GM
B: Boxplot diagrams of mIns/tNAA, mIns/tCr, tNAA/tCr, and tCho/tCr for the different lesion location subtypes. tCho/tCr showed the familiar WM-GM distribution, while mIns/tCr showed significantly lower metabolic ratios toward the cortex.