0138
Looking for a differential vulnerability of specific thalamic nuclei in multiple sclerosis1Neurocentre Magendie, Bordeaux, France, 2Laboratoire Bordelais de Recherche en Informatique, TALENCE, France, 3University of Arizona, Tucson, AZ, United States, 4Neurology Department, Hopital Pellegrin, Bordeaux, France, Metropolitan, 5Canon Medical System Corporation, Tochigi, Japan, 6Canon Medical System Europe, Paris, France
Synopsis
Thalamus is one of the first grey matter structure affected in multiple sclerosis (MS). It could undergo a differential vulnerability predominating on nuclei closer to the third ventricle due to pro-inflammatory factors brought by cerebrospinal fluid.First, we validated an atlas-based segmentation method that enables thalamic segmentation over conventional T1 weighted images. Then, using this segmentation method, we brought evidence for a medio-lateral gradient of thalamic atrophy in MS. While less affected, the anterior group was found useful to distinguish cognitively preserved from cognitively impaired patients. This paves the way toward more thalamic nuclei analyses in MS as new biomarkers.
Introduction
Thalamus is one of the first grey matter structure to be affected in multiple sclerosis (MS).1,2 It is composed of many nuclei with specific sensory, motor, and cognitive functions.3 The whole thalamic atrophy could reflect the severity of MS. We can also hypothesize that thalami actually undergo a differential vulnerability with a predominant atrophy of nuclei closer to the 3rd ventricle considering that cerebrospinal fluid (CSF) can bring pro-inflammatory factors.4 Challenges to test this hypothesis are related to the fact that conventional imaging acquisitions bring low contrast preventing thalamic nuclei delineation.5 Few years ago, we optimized a white-matter-nulled version of MPRAGE (WMn-MPRAGE) to maximize thalamus contrast.6,7 We developed an automatic segmentation method named Thalamus Optimized Multi Atlas Segmentation (THOMAS) based on the WMn-MPRAGE that we could validate against histological Morel’s atlas plates.8 While this approach is considered the most valuable, it requires the WMn-MPRAGE sequence that is frequently not collected. Therefore we recently developed an atlas that is based on high quality WMn-MPRAGE data and that can be used for segmentation through coregistration of conventional T1 wi.9 Here, we used this method to study thalami not only as a whole but at a nuclear level to test the differential vulnerability hypothesis and to better understand some clinical impact of thalamic damage such as cognitive impairment.Methods
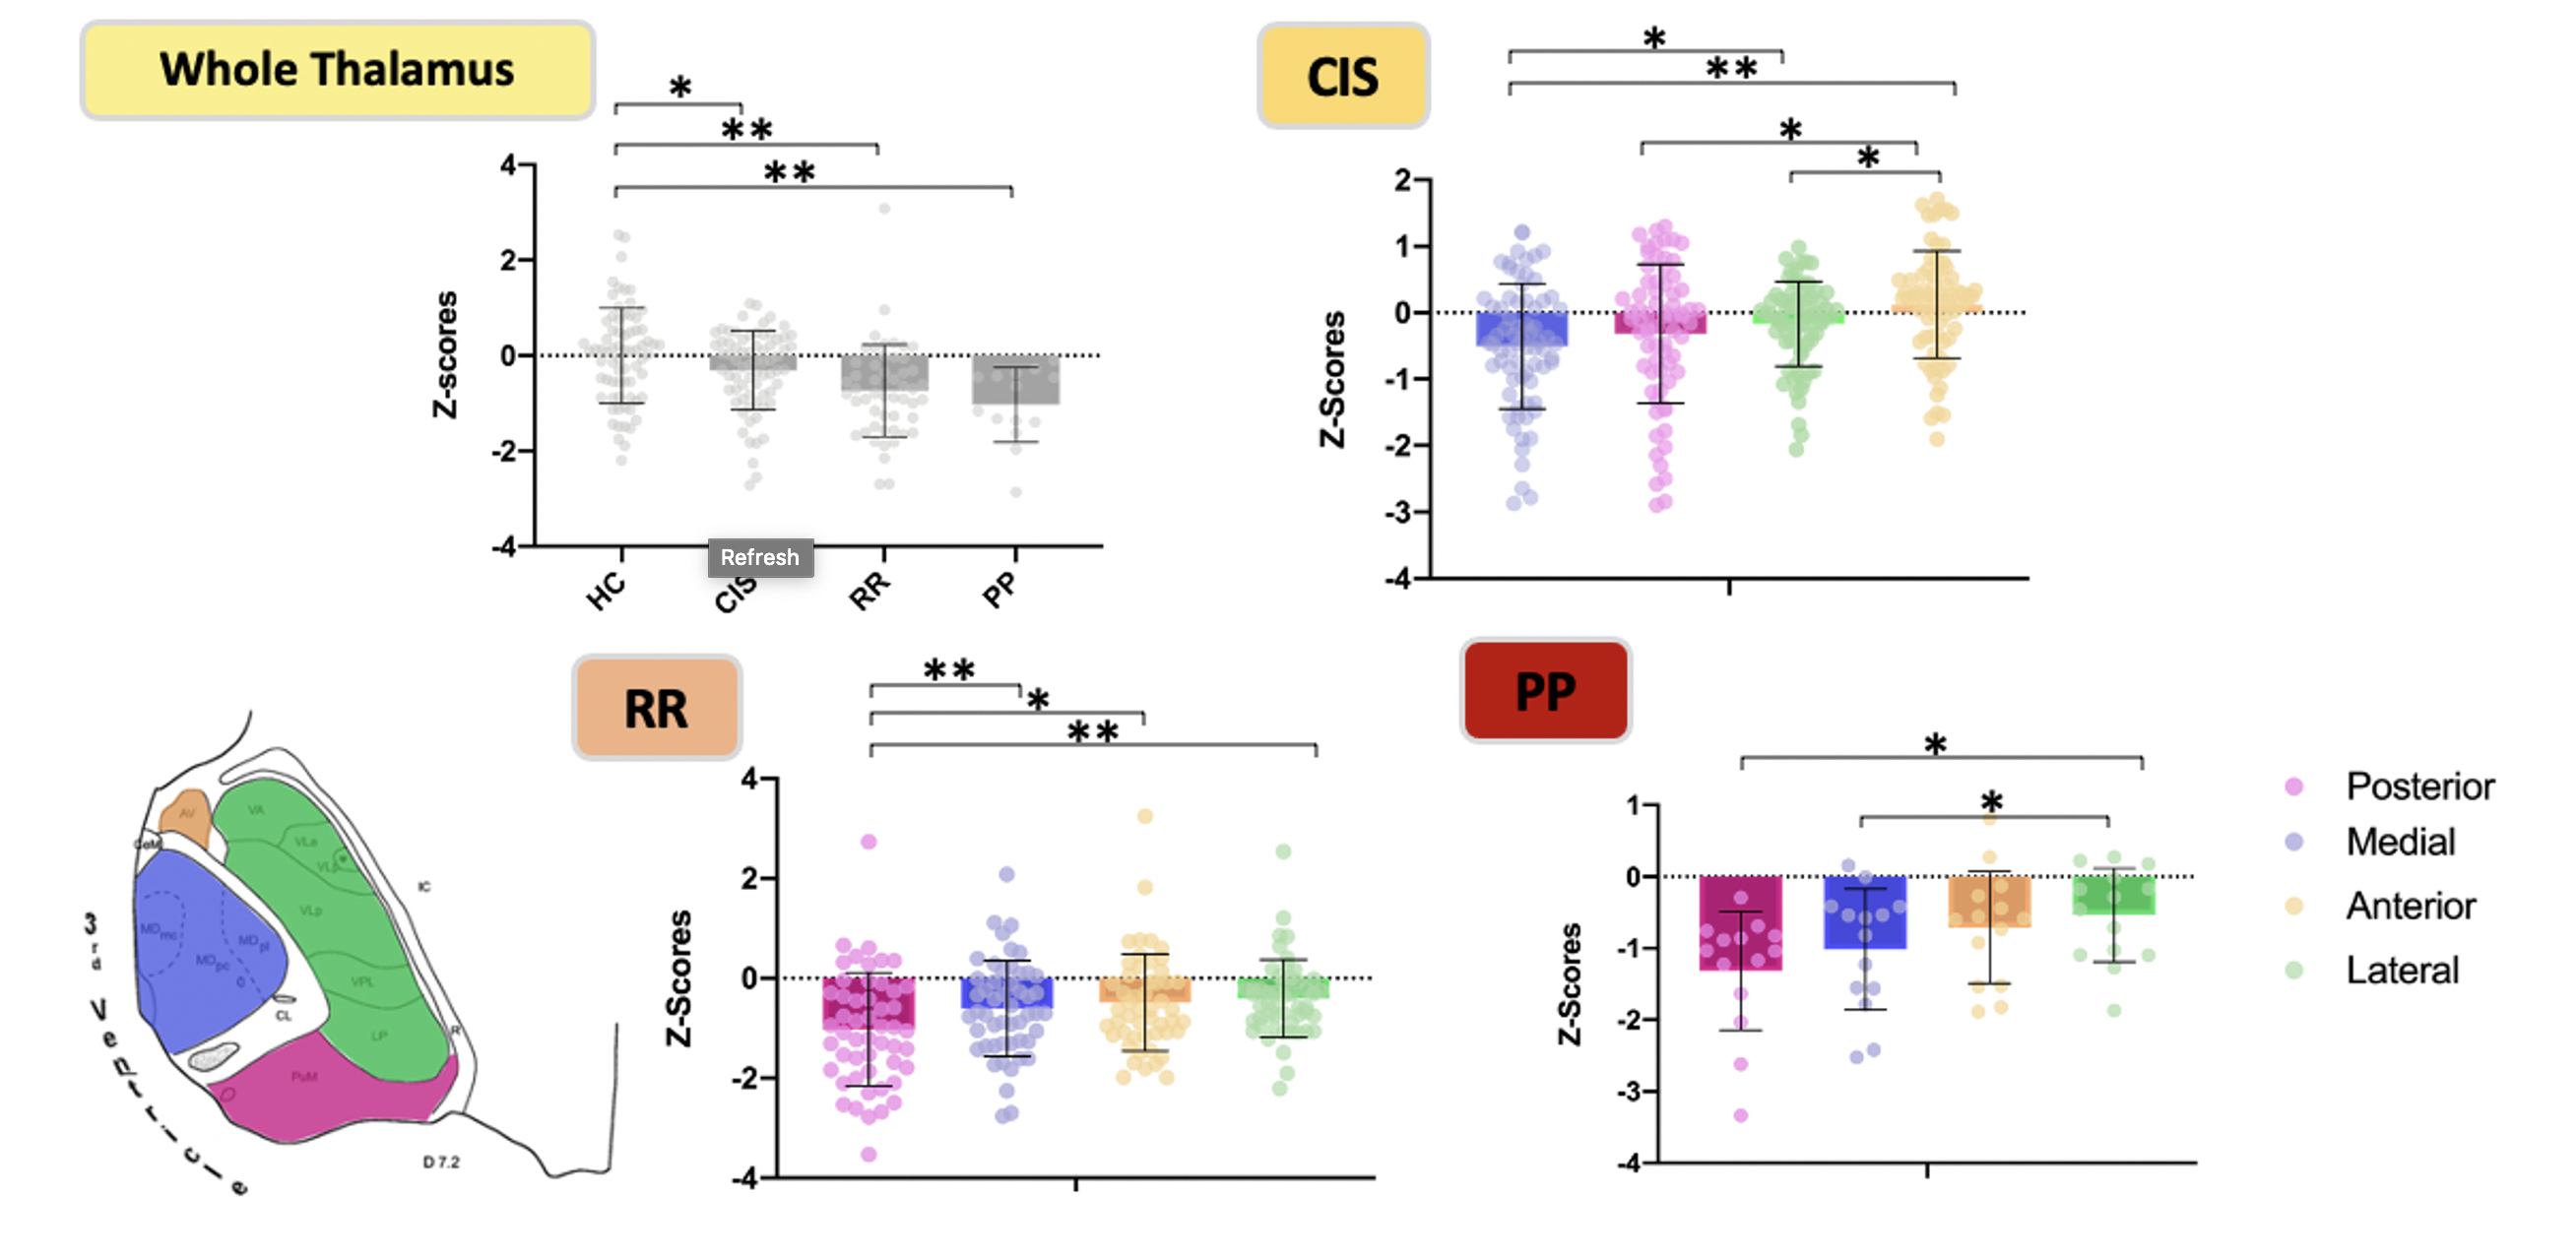
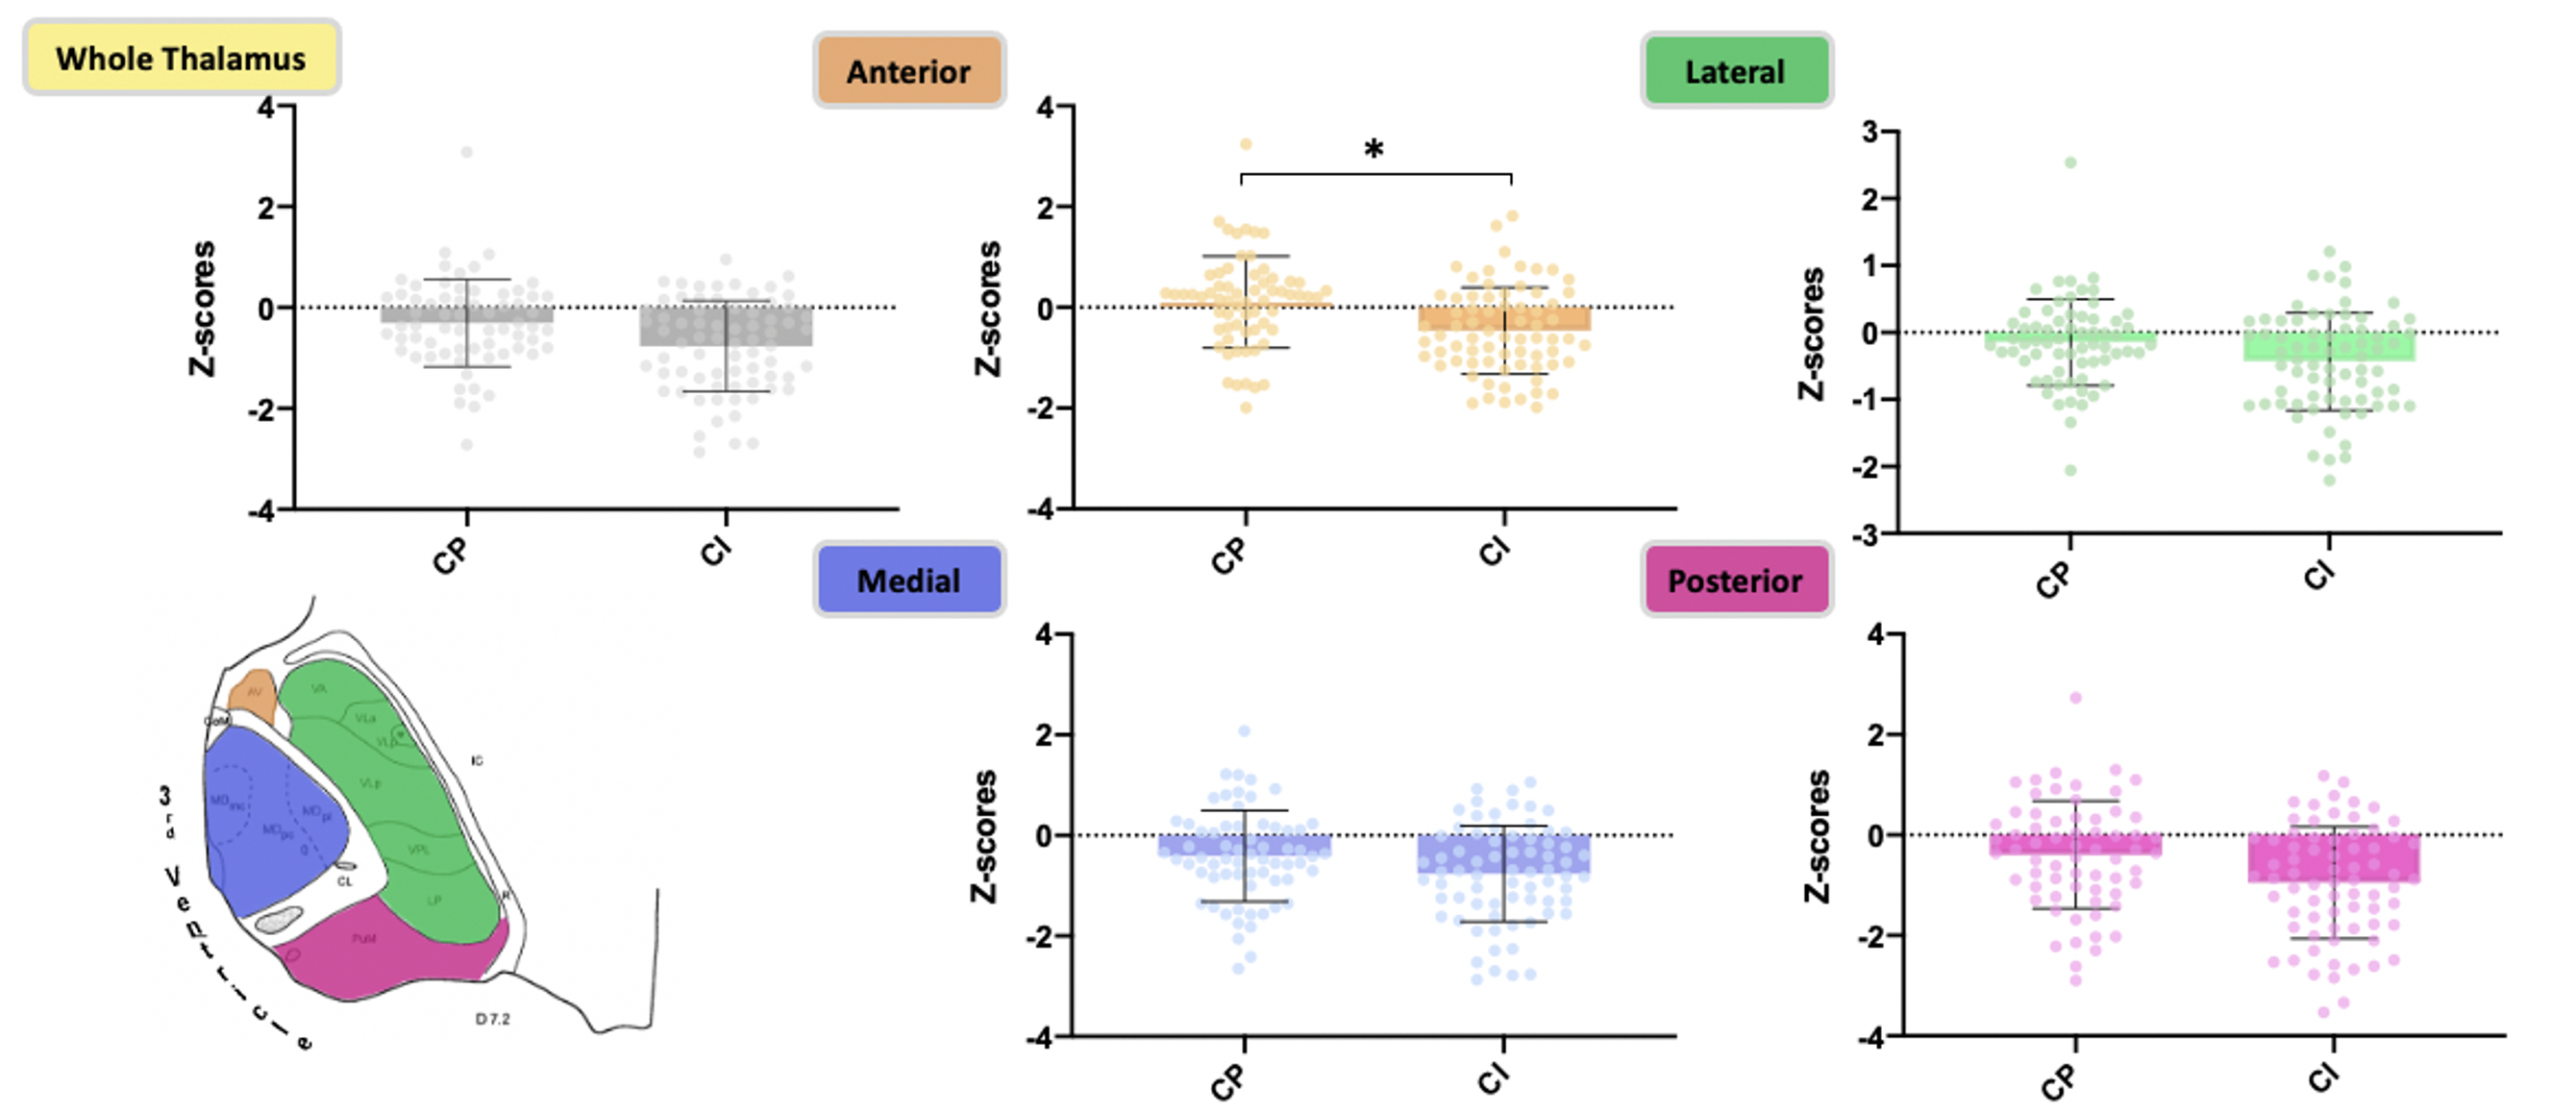
Patients were explored on 3T magnets (Achieva TX system, Philips Healthcare; Discovery MR 750w, GE Healthcare, Vantage Galan, Canon Medical).A 1st database composed of 163 (110 MS and 53 healthy controls (HC)) pairs of conventional T1 wi and WMn-MPRAGE were first used to evaluate the accuracy of the Atlas-Based Segmentation (T1-based) compared to THOMAS segmentation (WMN-based) as reference. Both methods provided 11 thalamic nuclei allocated to 4 groups for which dice index and volume similarity index (VSI) were processed.A 2nd database composed of 207 patients (136 MS and 71 HC) explored with conventional T1wi and a neuropsychological battery of tests were used to test the differential vulnerability hypothesis. MS patients were composed of clinically isolated syndrome (CIS; n=71), relapsing remitting (RR; n=51) and primary progressive (PP; n=14) forms. Volumes from the atlas-based segmentation were normalized with the intra-cranial volume and Z-scores were calculated by taking the HC as references. Z-scores were compared to 0 by a t-test for the whole thalami and within each form of the disease by a repeated measured ANOVA for the nuclear groups.Finally, MS patients were classified as cognitively impaired (CI) or preserved (CP). Whole thalami and nuclear groups volumetric Z-scores were compared between CI and CP by an ANOVA. The lesion load was used as covariable. Logistic regressions including the whole thalami, the nuclear groups and the lesion load were processed.Results
The atlas-based segmentation brought good Dice indexes (range [0.65-0.89]) and very good volume similarity indexes (range [0.82-0.95]) for the whole thalami and the nuclear groups, validating this method for the following step of this study (Figure 1). The 3 forms represented different stages of severity of MS; CIS being the younger (p<0.05) while RR and PP had higher lesion load (p<0.05) and progressively more severe score of handicap (p<0.001). The analysis of the volumetric Z-scores brought evidences in favor of a continuous and progressive atrophy from the early stage (CIS) to more advanced and aggressive forms (RR and PP). Nuclei analysis showed that such atrophy was mainly driven by the paraventricular groups (posterior and medial) compared to groups of nuclei more at distance from the CSF (anterior and lateral groups) whatever the form of the disease (Figure 2). Regarding cognitive impact, the anterior part of the thalami was found as the only significant nuclear group to distinguish CI from CP (p=0.01) (Figure 3). The most significant logistic regression was found by using only the anterior group volumetric Z-score (R-square=0.130). The area under the ROC curve was evaluated at 0.70. An optimum cutoff value was determined as -0.519 for the anterior group with a sensitivity of 79% and a specificity of 61%.Discussion
We found that the atlas-based segmentation over T1 wi was efficient to segment the thalamus compared to the more complex WMn-based approach. Taking advantage of this simple approach, we could show evidence for a medial-to-lateral gradient of atrophy that was consistently observed whatever the forms of MS. This result agrees with findings of a predominant increase of fractional anisotropy in paraventricular regions in a pediatric population of MS.10In terms of clinical impact, we found that, while atrophy is more severe in medial and posterior groups, only the progression of atrophy toward the anterior group was associated with CI which is in lines with a previous study 11.Such cross-sectional analysis will require confirmation with longitudinal data.Conclusion
This study provided first evidence for a medio-to-lateral gradient of atrophy in MS.Using thalamic segmentation over conventional imaging could help constituting a significative anterior thalamic atrophy biomarker to target MS patients needing a potential neuropsychological evaluation.Acknowledgements
No acknowledgement found.References
1. Eshaghi A, Marinescu RV, Young AL, et al. Progression of regional grey matter atrophy in multiple sclerosis. Published online 2018:13.
2. Azevedo CJ, Cen SY, Khadka S, et al. Thalamic atrophy in multiple sclerosis: A magnetic resonance imaging marker of neurodegeneration throughout disease: Thalamic Atrophy in MS. Ann Neurol. 2018;83(2):223-234. doi:10.1002/ana.25150
3. Herrero MT, Barcia C, Navarro J. Functional anatomy of thalamus and basal ganglia. Childs Nerv Syst. 2002;18(8):386-404. doi:10.1007/s00381-002-0604-1
4. Minagar A, Barnett MH, Benedict RHB, et al. The thalamus and multiple sclerosis: Modern views on pathologic, imaging, and clinical aspects. Neurology. 2013;80(2):210-219. doi:10.1212/WNL.0b013e31827b910b
5. Lassmann H. Pathogenic Mechanisms Associated With Different Clinical Courses of Multiple Sclerosis. Front Immunol. 2019;9:3116. doi:10.3389/fimmu.2018.03116
6. Tourdias T, Saranathan M, Levesque IR, Su J, Rutt BK. Visualization of intra-thalamic nuclei with optimized white-matter-nulled MPRAGE at 7T. NeuroImage. 2014;84:534-545. doi:10.1016/j.neuroimage.2013.08.069
7. Saranathan M, Tourdias T, Bayram E, Ghanouni P, Rutt BK. Optimization of white-matter-nulled magnetization prepared rapid gradient echo (MP-RAGE) imaging: Optimization of White-Matter-Nulled MP-RAGE Imaging. Magn Reson Med. 2015;73(5):1786-1794. doi:10.1002/mrm.25298
8. Su JH, Thomas FT, Kasoff WS, Tourdias T, Choi EY, Rutt BK. Thalamus Optimized Multi Atlas Segmentation (THOMAS): fast, fully automated segmentation of thalamic nuclei from structural MRI. NeuroImage. 2019;194:272-282. doi:10.1016/j.neuroimage.2019.03.021
9. Saranathan M, Iglehart C, Monti M, Tourdias T, Rutt B. In vivo high-resolution structural MRI-based atlas of human thalamic nuclei. Sci Data. 2021;8(1):275. doi:10.1038/s41597-021-01062-y
10. De Meo E, Storelli L, Moiola L, et al. In vivo gradients of thalamic damage in paediatric multiple sclerosis: a window into pathology. Brain. 2021;144(1):186-197. doi:10.1093/brain/awaa379
11. Eijlers AJC, van Geest Q, Dekker I, et al. Predicting cognitive decline in multiple sclerosis: a 5-year follow-up study. Brain. Published online July 26, 2018. doi:10.1093/brain/awy202
Figures
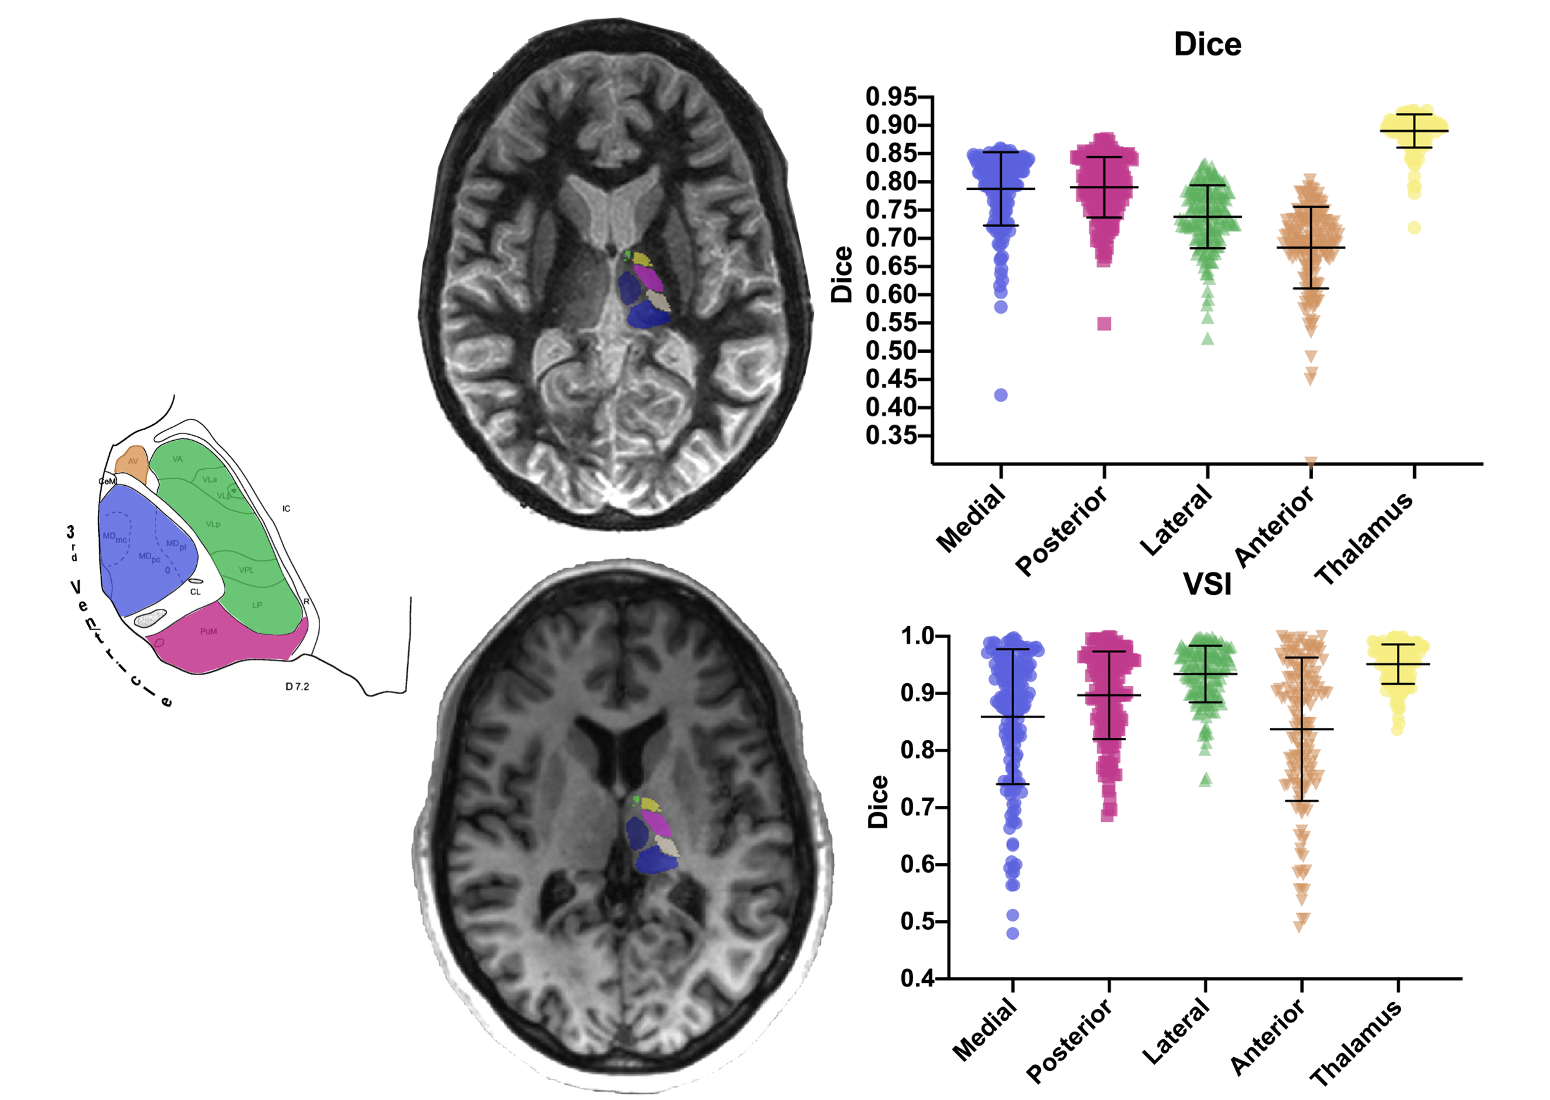
THOMAS thalamic segmentation over a WMn-MPRAGE acquisition (top left) and atlas-based one over a T1 weighted acquisition (bottom left) of the thalamic nuclei. Scatter plot of the Dice index (top right) and of the Volume Similarity Index (VSI) (bottom right) of the thalamic groups and the whole thalami. Error bars represent the standard deviations. Schematic representation of the thalamus (left) with color areas corresponding the groups of nuclei with same color to the scatter plots ones. WMn : White-Matter null, THOMAS : Thalamus Optimized Multi Atlas Segmentation.