0137
Imaging multiple sclerosis histopathologyusing susceptibility source separation: a postmortem brain study
1Department of Electrical and Computer engineering, Seoul National University, Seoul, Korea, Republic of, 2Department of Biomedical Engineering, Faculty of Medicine, University Hospital Basel and University of Basel, Basel, Switzerland, 3MS Center and Research Center for Clinical Neuroimmunology and Neuroscience Basel (RC2NB), University Hospital Basel and University of Basel, Basel, Switzerland, 4National Primate Research Center, Korea Research Institute of Bioscience and Biotechnology, Cheongju, Korea, Republic of, 5Institute of Neuropathology, University Medical Center, Göttingen, Germany, 6Seoul St Mary’s Hospital, College of Medicine, The Catholic University of Korea, Seoul, Korea, Republic of
Synopsis
The pathology of multiple sclerosis (MS) is highly correlated with the dynamics of two susceptibility sources, paramagnetic iron and diamagnetic myelin. Various MRI methods sensitive to the substances have been developed for MS pathology. However, the collective effects of iron and myelin to an MRI signal have hampered monitoring individual changes of the substances. Here, we evaluated the effectiveness of 𝜒-separation, which estimates individual contributions of para-/dia-magnetic susceptibility, for visualizing MS pathology-related iron/myelin changes. The resulting paramagnetic and diamagnetic susceptibility conform to the histopathological features of MS lesion (iron-rim in Perls staining, and re-/de-myelinated lesions in myelin basic protein staining).
Introduction
Non-invasive visualization of the histopathological features of focal lesions in multiple sclerosis (MS) brain has been an important goal of medical imaging due to its utility for understanding the pathogenesis of the disease and monitoring the efficacy of treatments. Quantitative MRI (e.g., susceptibility mapping and relaxometry) has been suggested as a useful tool to study the heterogeneous nature of MS lesions. In particular, susceptibility-sensitive MRI methods (e.g., T2*-weighted image and quantitative susceptibility mapping (QSM)1–4) have provided interesting biomarkers to track histological dynamics (e.g., paramagnetic rim for chronic active lesion and nodular paramagnetic lesion for demyelinated lesion5) based on their magnetic properties (i.e., paramagnetic iron and diamagnetic myelin). However, these contrasts are influenced by both iron and myelin6, hindering straightforward interpretation of the contrasts. Recently, susceptibility source separation methods were proposed to estimate individual concentrations of paramagnetic and diamagnetic sources7–9. These methods potentially provide the separate information of iron and myelin in tissues of interest and, therefore, may deliver a unique opportunity to monitor histopathological changes in the MS brain. In this study, we acquired high-resolution and high-quality paramagnetic and diamagnetic susceptibility maps using 𝜒-separation method7 in a postmortem MS brain. The results were compared with histochemical staining for iron (Perls), myelin basic protein, and activated microglia/macrophage (CR3/43). The results demonstrate a great correspondence between positive susceptibility map and iron image as well as negative susceptibility map and myelin map.Methods
[MRI data acquisition and histology] A perfluoropolyether-immersed formalin-fixed postmortem whole brain from secondary-progressive MS patient (59-year-old male and 23 years of disease duration) was scanned at 3T using the following sequences: multi-echo gradient echo (ME-GRE) sequence (0.55-mm isotropic resolution, TR/TE= 49/7.3:4.1:44.0 ms) and T2-prepared ultrashort TE (T2prep UTE) sequence10 (1-mm isotropic resolution, TEprep = 0, 7.5, 17.5, 67.5, 147.5, and 307.5 ms). After MRI scanning, the brain was cut using 3D-printed cutting box for spatial matching between MRI and histology11. White matter lesions identified from the GRE images were histochemically stained with myelin basic protein (MBP) for myelin, CR3/43 for microglia/macrophage, and Perls Prussian blue with DAB enhancing for iron.[Data processing] For R2 and R2* mapping, the magnitudes of the ME-GRE and T2prep UTE were fitted to an exponential model. The frequency shift was estimated by fitting a linear model to the phase of the ME-GRE data. Using R2' (= R2*−R2) and frequency shift, the 𝜒-separation maps7 were reconstructed by an algorithm that removed the streaking artifacts in the k-space as suggested in (12). The statistical analysis was performed using one-way ANOVA with Bonferroni correction for types of lesion comparisons (21 chronic active (ChronicAct) lesions, 9 active lesions, 6 inactive lesions, 3 remyelination lesions, 20 normal-appearing white matter (NAWM) ).
Results
When the 𝜒-separation maps are reconstructed using the MS brain data, the negative (= diamagnetic) susceptibility maps (𝜒neg) show hyperintensity in normal WM but hypointensity in MS lesions, revealing the loss of diamagnetic sources (e.g., myelin loss) (Fig. 1; blue arrows). In the positive map (𝜒pos), hyperintensities are observed in the U-fiber regions, which are known to have high concentration of iron, and a small population of lesion boundaries visualizing paramagnetic rim (Fig. 1; pink and orange arrows).When the 𝜒-separation results are compared to histological staining (Figs. 2-4), high spatial correspondence is observed between positive susceptibility map & iron image (Perls) as well as negative susceptibility map and myelin image (MBP). In addition, most paramagnetic rims in the positive susceptibility maps are colocalized with the activated microglia at the lesion boundary (Figs. 2-4). The positive susceptibility map shows hyperintensity in the active-microglia lesion boundaries, where microglia potentially contain iron (red arrows in Fig. 2). In Fig. 3, the comparison between the susceptibility maps vs. histological staining visualizes positive susceptibility hyperintensity in the iron-rim. Interestingly, while most of the iron-rims are identified in both positive susceptibility & QSM maps, some are detectable only in the positive susceptibility map (Fig. 4a), potentially suggesting the effects of demyelination on the detection of the paramagnetic rim. In the remyelinated lesion, the negative susceptibility values higher than the demyelinated lesion are observed (Fig. 4).
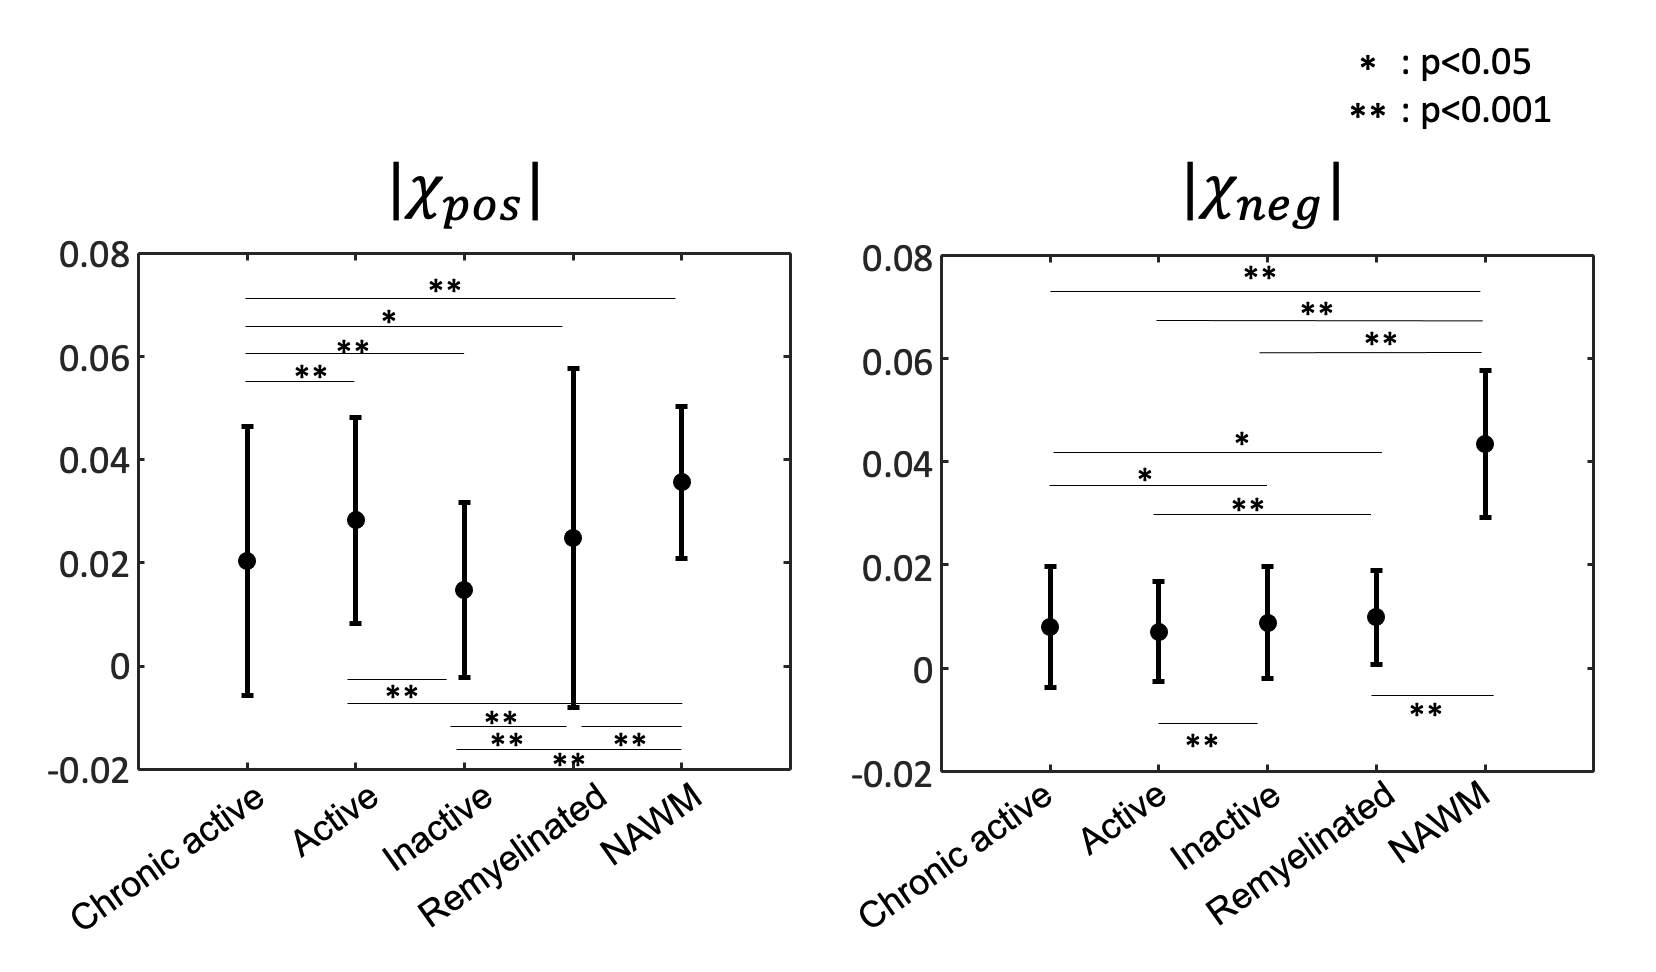
The ROI analysis reports 1) the highest absolute negative susceptibility in NAWM and 2) significantly higher absolute negative susceptibility in remyelinated lesions than chronic active and active lesions (Fig. 5). Additionally, positive susceptibility in NAWM is significantly higher than chronic active, active, and remyelinated lesions.
Discussion
In this study, we demonstrated that the separation of positive and negative susceptibility in the MS brain can delineate the histopathological information of iron and myelin. The negative susceptibility map may have larger sensitivity to demyelination than a simple concentration change of myelin lipids because microstructural deformation (e.g., destruction of highly ordered myelin sheath) during demyelination also induces frequency shifts13. Even though the resolution of MRI is limited and, therefore, is unable to capture micrometer-scale information of histology, the 𝜒-separation results, delineating the distributions of iron and myelin at the resolution of sub-millimeter (~0.5 mm), suggest a potential for acquiring 3D in-vivo histology of iron and myelin and to study the pathology of the MS brain. To clinically utilize 𝜒-separation for MS, further translational studies are necessary to validate the efficacy of the method for in-vivo MS brains.Acknowledgements
This work was supported by Creative-Pioneering Researchers Program through Seoul National University(SNU) and has been supported by the National Research Foundation of Korea(NRF) grant funded by the Korea government(MSIT)( NRF-2021R1A2B5B03002783).References
1. Wang Y, Liu T. Quantitative susceptibility mapping (QSM): Decoding MRI data for a tissue magnetic biomarker. Magnet Reson Med 2015; 73:82 101.
2. Haacke EM, Xu Y, Cheng YCN, Reichenbach JR. Susceptibility weighted imaging (SWI). Magnet Reson Med 2004; 52:612 618.
3. Yablonskiy DA, Haacke EM. Theory of NMR signal behavior in magnetically inhomogeneous tissues: The static dephasing regime. Magnet Reson Med 1994; 32:749 763.
4. Haacke EM, Makki M, Ge Y, et al. Characterizing iron deposition in multiple sclerosis lesions using susceptibility weighted imaging. J Magnetic Reson Imaging Jmri 2009; 29:537–44.
5. Absinta M, Maric D, Gharagozloo M, et al. A lymphocyte–microglia–astrocyte axis in chronic active multiple sclerosis. Nature 2021; 597:709–714.
6. Duyn JH, Gelderen P van, Li T-Q, Zwart JA de, Koretsky AP, Fukunaga M. High-field MRI of brain cortical substructure based on signal phase. Proc National Acad Sci 2007; 104:11796 11801.
7. Shin H-G, Lee J, Yun YH, et al. χ-separation: Magnetic susceptibility source separation toward iron and myelin mapping in the brain. Neuroimage 2021; 240:118371.
8. Emmerich J, Bachert P, Ladd ME, Straub S. On the separation of susceptibility sources in quantitative susceptibility mapping: Theory and phantom validation with an in vivo application to multiple sclerosis lesions of different age. J Magn Reson 2021; 330:107033.
9. Chen J, Gong N-J, Chaim KT, Otaduy MCG, Liu C. Decompose quantitative susceptibility mapping (QSM) to sub-voxel diamagnetic and paramagnetic components based on gradient-echo MRI data. Neuroimage 2021; 242:118477.
10. Nguyen TD, Wisnieff C, Cooper MA, et al. T2 prep three-dimensional spiral imaging with efficient whole brain coverage for myelin water quantification at 1.5 tesla. Magnet Reson Med 2012; 67:614 621.
11. Absinta M, Nair G, Filippi M, et al. Postmortem Magnetic Resonance Imaging to Guide the Pathologic CutIndividualized, 3-Dimensionally Printed Cutting Boxes for Fixed Brains. J Neuropathology Exp Neurology 2014; 73:780–788.
12. Li W, Wang N, Yu F, et al. A method for estimating and removing streaking artifacts in quantitative susceptibility mapping. Neuroimage 2015; 108:111 122.
13. Yablonskiy DA, Luo J, Sukstanskii AL, Iyer A, Cross AH. Biophysical mechanisms of MRI signal frequency contrast in multiple sclerosis. Proc National Acad Sci 2012; 109:14212–14217.
Figures
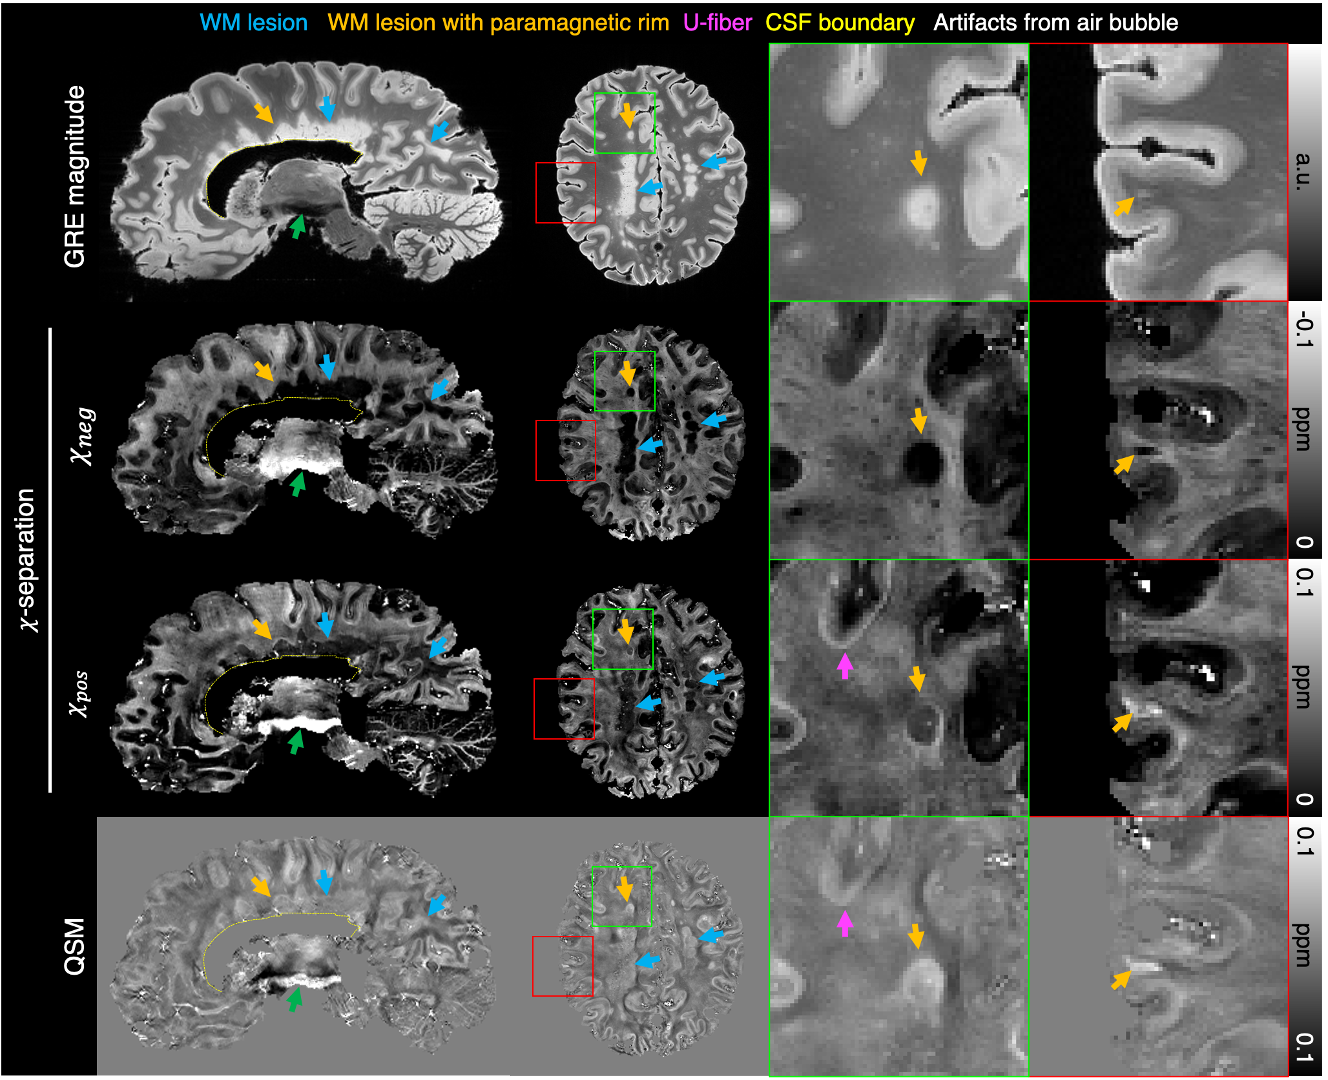
Fig 1. Images of the GRE magnitude, 𝜒pos, 𝜒neg, and conventional QSM in the postmortem MS brain. The 𝜒neg map have hypointensity in most MS lesions (some of them pointed out with blue and orange arrows), indicating demyelination in the lesions. When zoomed-in, a white matter lesion (orange arrows in the green boxes), a small subcortical lesion (orange arrows in the red boxes), and iron-rich U-fiber (pink arrows in the green boxes) are identified. These lesions (and also a few other regions marked with orange arrows) features paramagnetic rim, which is a clinically important biomarker.
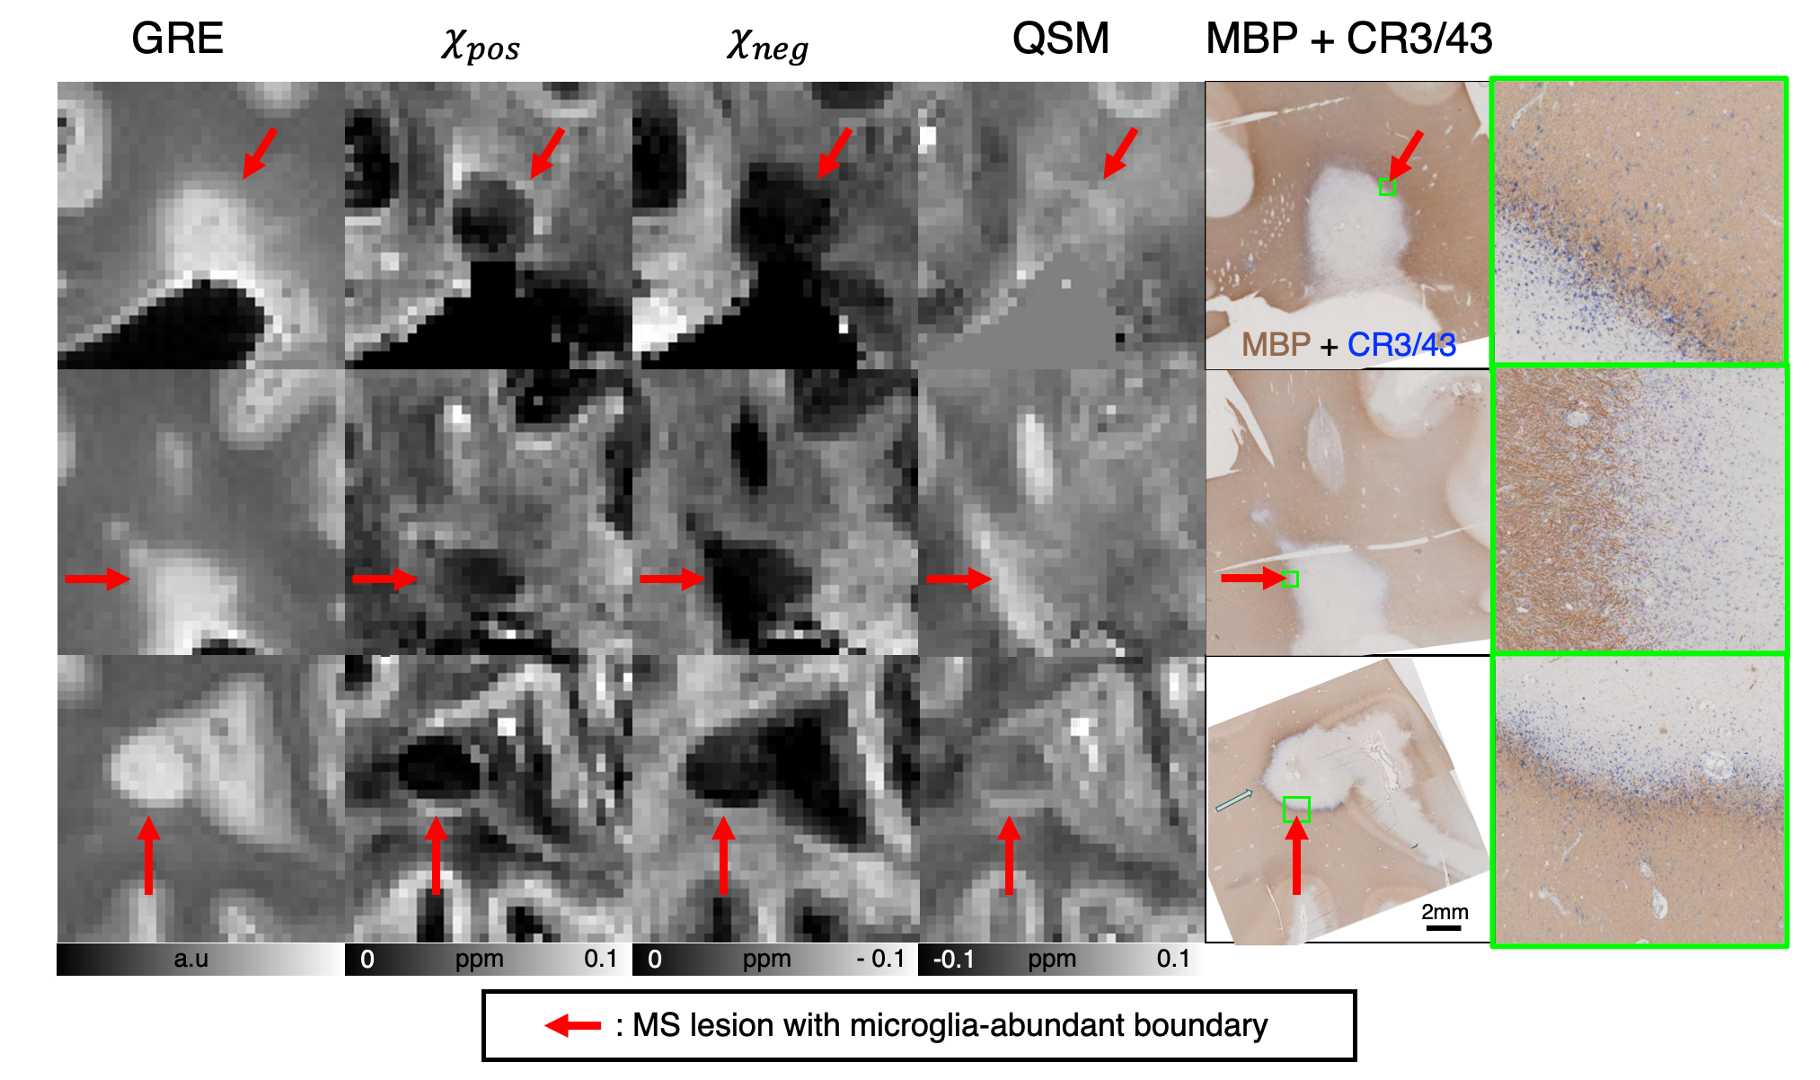
Fig 2. Zoomed-in MRI images of periventricular (first and second rows) and subcortical lesions (third row) and corresponding histological staining for myelin (MBP, brown) and microglia/macrophage (CR3/43, blue). The 𝜒pos maps show hyperintensity in the microglia-positive lesion boundaries, where microglia are potentially iron-laden (red arrows; also see zoomed in histology images in green boxes). The 𝜒neg maps have good agreement with the myelin-stained images using MBP.
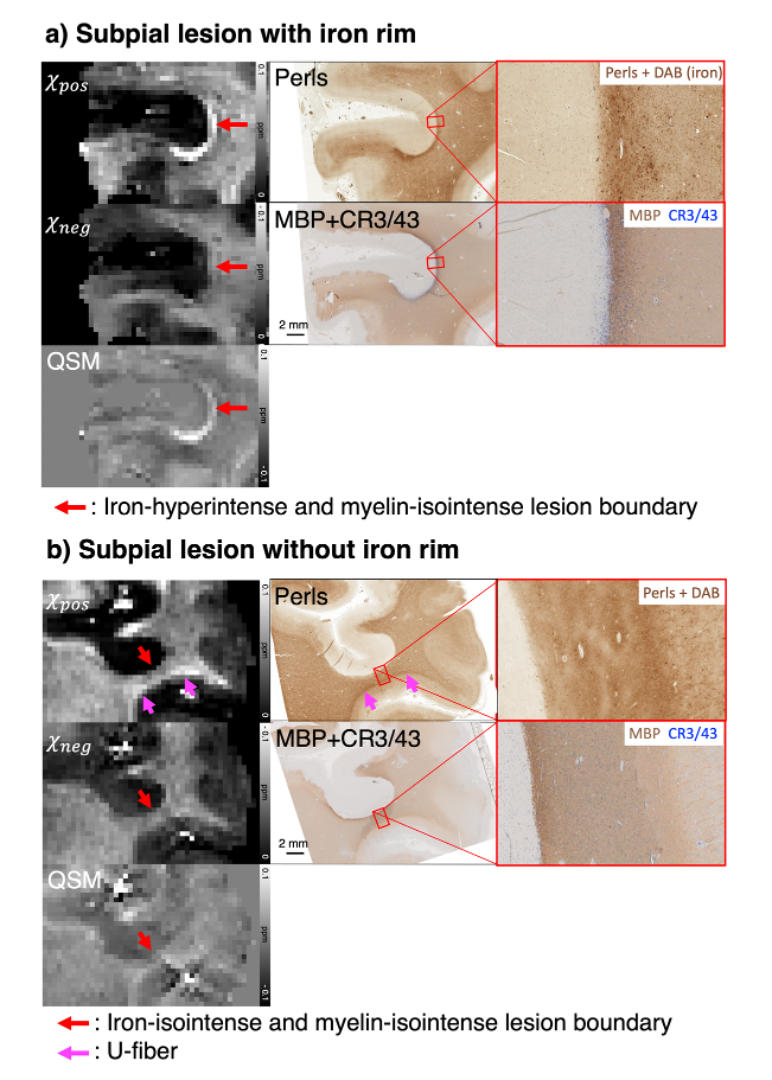
Fig 3. Comparison between the susceptibility maps vs. histological staining in two subpial MS lesions with and without microglia rim. Overall, the positive and negative susceptibility maps well match for the distributions of iron and myelin, respectively, revealing the WM/GM boundaries and subcortical iron (U-fiber; pink arrows). In the iron-rim lesion (a), the hyperintense rim in the 𝜒pos map (red arrows) visualizes the presence of iron-rich rim. In the lesion without iron rim (b; red arrows), isointense 𝜒pos corresponds to Perls’ stain.
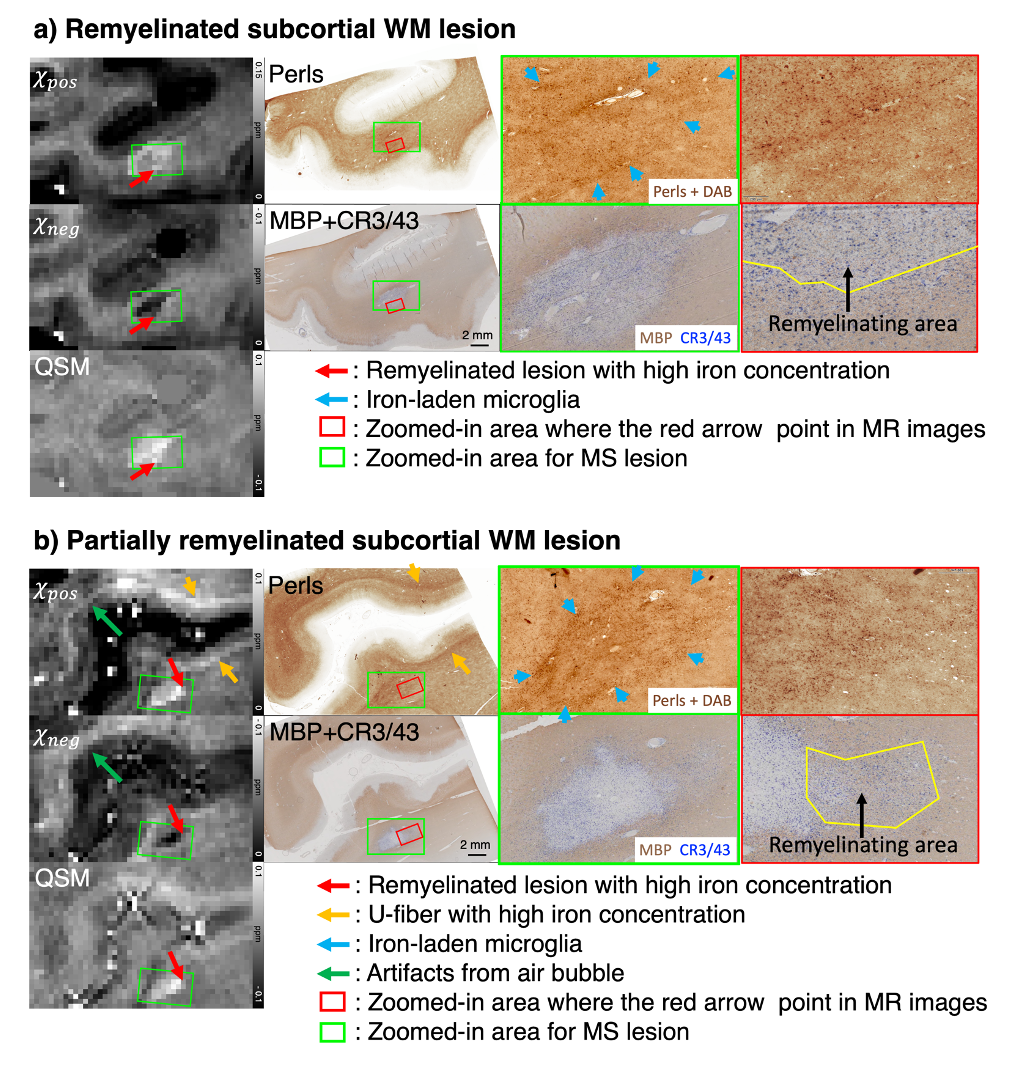
Fig 4. Susceptibility maps vs histology in remyelinated lesions. Remyelinated lesion in (a) reveals paramagnetic rim in 𝜒pos (green boxes), corresponding to iron rim in Perls (blue arrows). 𝜒neg reveals perilesional remyelination (red arrows), which is confirmed in the myelin histology (black arrow). The lesion core, however, still shows no myelination in 𝜒neg and histology. In (b), 𝜒neg seems to match with the boundary of de- and remyelinated areas (red arrows; green and red boxes). 𝜒pos reveals high intensity in regions with iron-laden microglia (green boxes; blue arrows).