0136
Increased oxygen extraction fraction following acute multiple sclerosis (MS) lesion formation is associated with increased myelin repair.1Radiology, Weill Cornell Medicine, New York, NY, United States, 2Population Health Sciences, Weill Cornell Medicine, New York, NY, United States, 3Biomedical Engineering, Cornell University, Ithaca, NY, United States
Synopsis
Understanding the cause and progress of remyelination in MS is critical for developing potential therapeutic targets of remyelination to restore neural connectivity and brain functions. In this study, we utilized a novel MRI-based oxygen extraction fraction (OEF) mapping method, namely “QQ”, and found that early lesion oxygen metabolism increase, as measured by QQ-based OEF, is positively associated with lesion myelin recovery, as measured by myelin water fraction. This study suggests that QQ-based OEF mapping may be a useful tool readily and widely available for studying MS lesion oxygen metabolism and its association with MS lesion remyelination.
Introduction
Multiple sclerosis (MS) is an inflammatory demyelinating neurologic disease, and the disease progression involves neurodegeneration. In response to injury, remyelination can occur in the central nervous system, which may be in different levels1, 2 and sometimes unsuccessful without clear reasons3. As remyelination is expected to restore neuronal connectivity and further brain functions4, understanding the cause and progress of remyelination will provide insight into potential therapeutic targets. As a recent study showed myelin recovery may be energy intensive5, we hypothesize that the early lesion oxygen metabolism increase contributes to the lesion myelin recovery.In this longitudinal study, to check our hypothesis, a novel integrative model of quantitative susceptibility mapping and quantitative blood level dependent magnitude (QSM+qBOLD or QQ) was used for oxygen metabolism estimation. QQ enabled voxel-wise oxygen extraction fraction (OEF) to study MS lesions6, using a routinely available MRI sequence without burdensome vascular challenges7-12. QQ has been validated against calibrated fMRI12 and 15O-PET9, and its clinical feasibility has been shown in the studies of ischemic stroke13, 14 and brain tumor15. For myelin recovery measurement, myelin water fraction (MWF) was used, a well-established quantitative MR biomarker for myelin16-19.
Methods
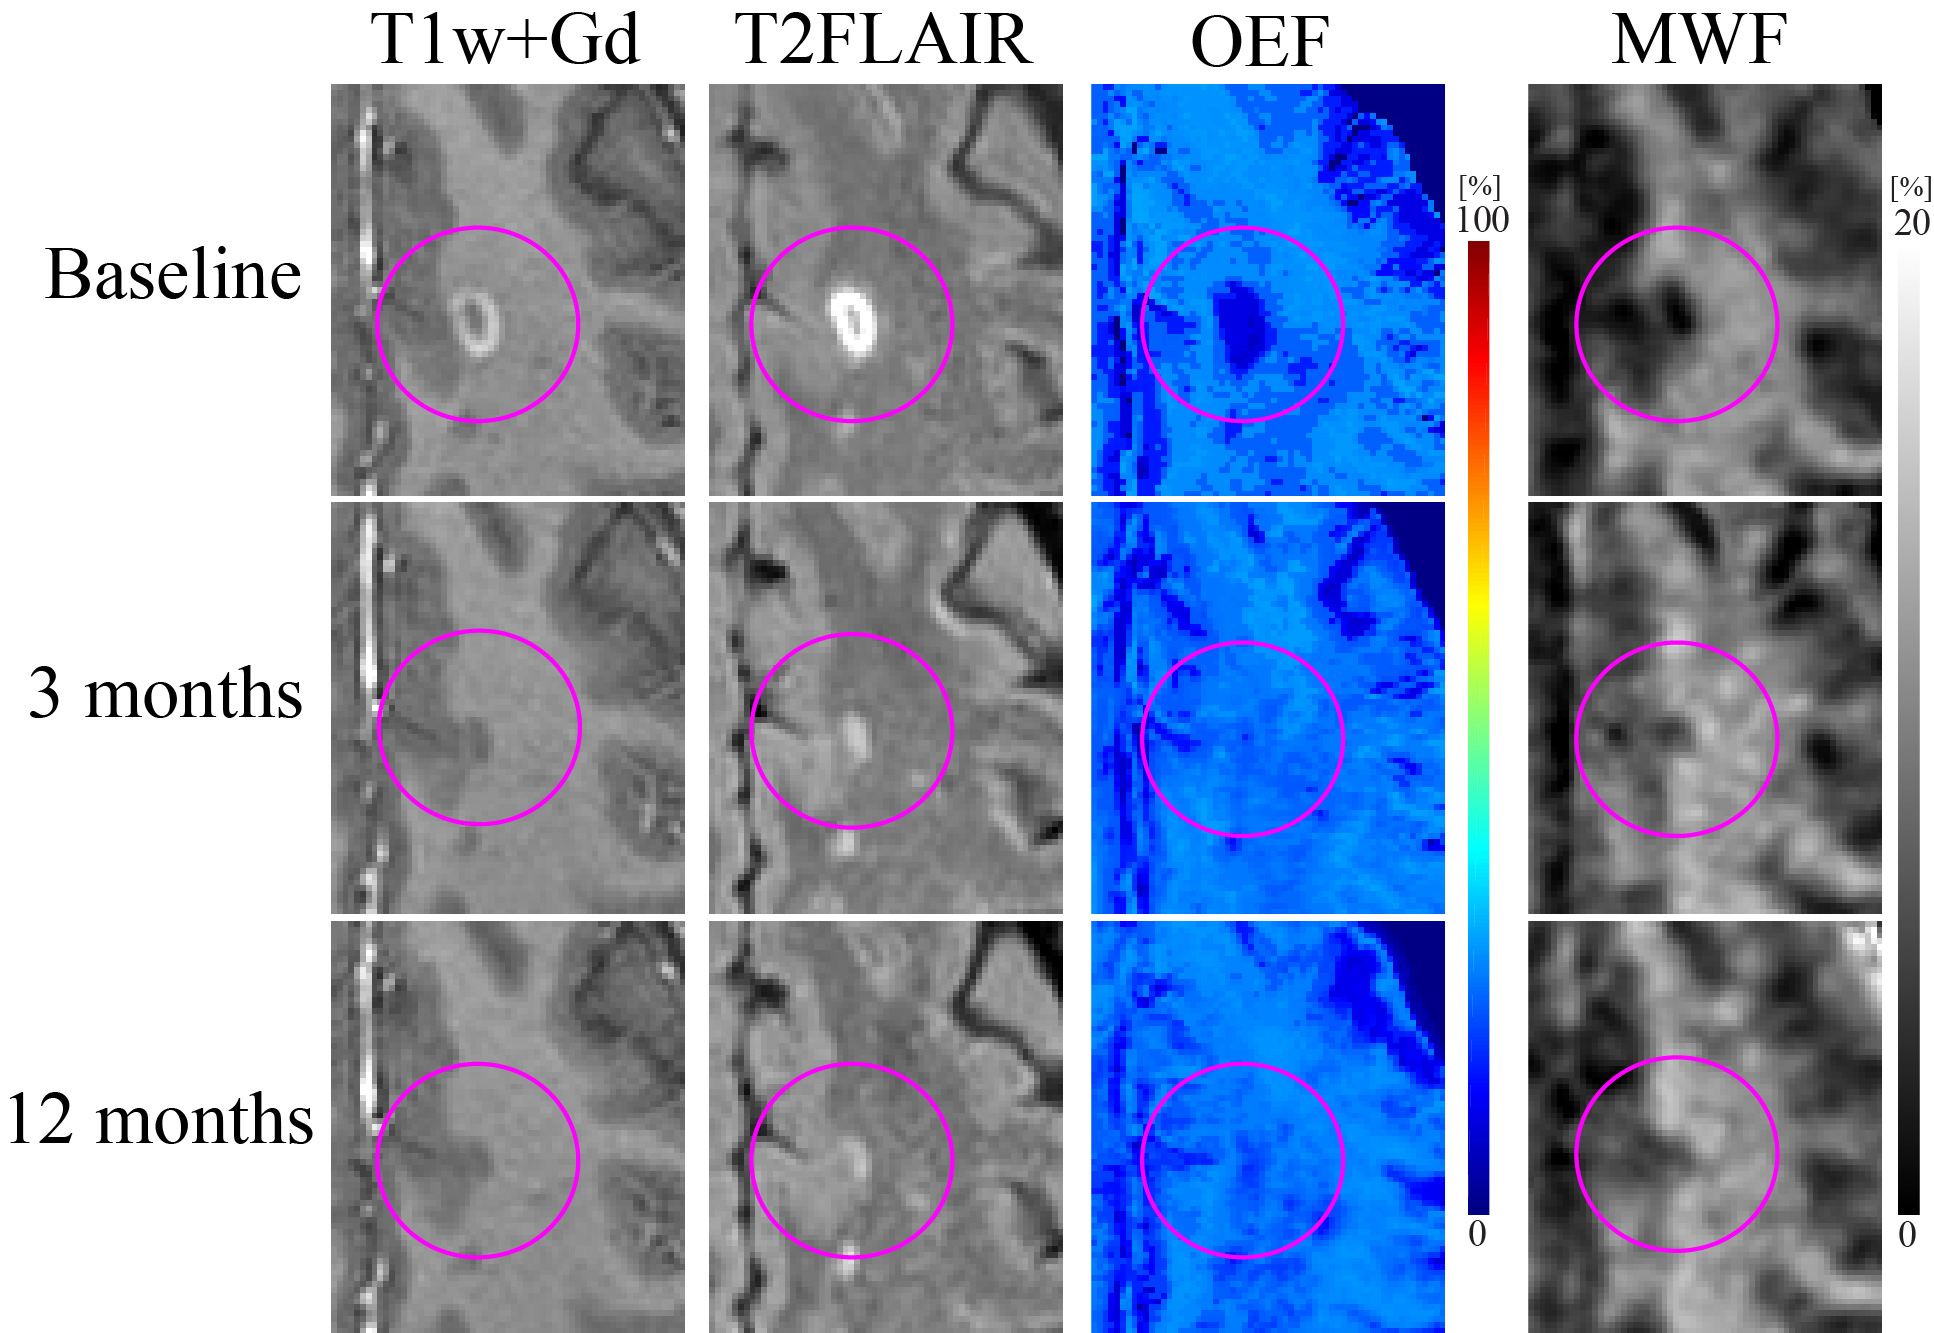
Data acquisition: 14 MS patients (40 ± 11 years old, 9 females, 7.6 ± 3.7 years disease duration) were recruited. For each patient, the baseline scan was defined as the appearance of a new Gd-enhancing lesion and longitudinal scans were acquired at 3 months (±30 days) and 12 months (+90 days). In each scan, gadolinium-enhanced T1-weighted (T1w+Gd), T2-weighted fluid-attenuated inversion recovery (T2-FLAIR), 3D multi-echo gradient recalled echo (mGRE), and Fast Acquisition Spiral Trajectory and T2prep (FAST-T2) were acquired using a 3T Siemens Skyra scanner.Data processing: QSM was estimated from mGRE using the MEDI algorithm20, 21. OEF was then estimated from QSM and mGRE magnitude using the QQ algorithm7, 8, 10. QQ combines two biophysics models of mGRE data: 1) QSM processing of phase data to estimate the susceptibility contribution of venous blood (i.e., OEF effect) and diffusive neural tissue22-24 and 2) qBOLD modeling of magnitude signal decay by the intravoxel field variation due to the susceptibility difference between cylindrical venous blood and the surrounding tissue25-27. For robust OEF reconstruction against noise, temporal and spatial sparsity in the mGRE signal was used7. MWF was estimated from FAST-T2 using a three-pool non-linear least squares data fitting16.
Statistical analysis: All images were co-registered to the baseline QSM resolution using FSL FLIRT, and a lesion mask was manually drawn on the co-registered T2-FLAIR (L.Z. and S.G.). A linear mixed-effect model was used 1) to assess the OEF and MWF between time points (e.g., baseline = 1, 3 months = 2) and 2) to study the relationship between the OEF change and the MWF change with a random effect for patient, adjusting for lesion volume, subjects’ age, sex, disease duration.
Results
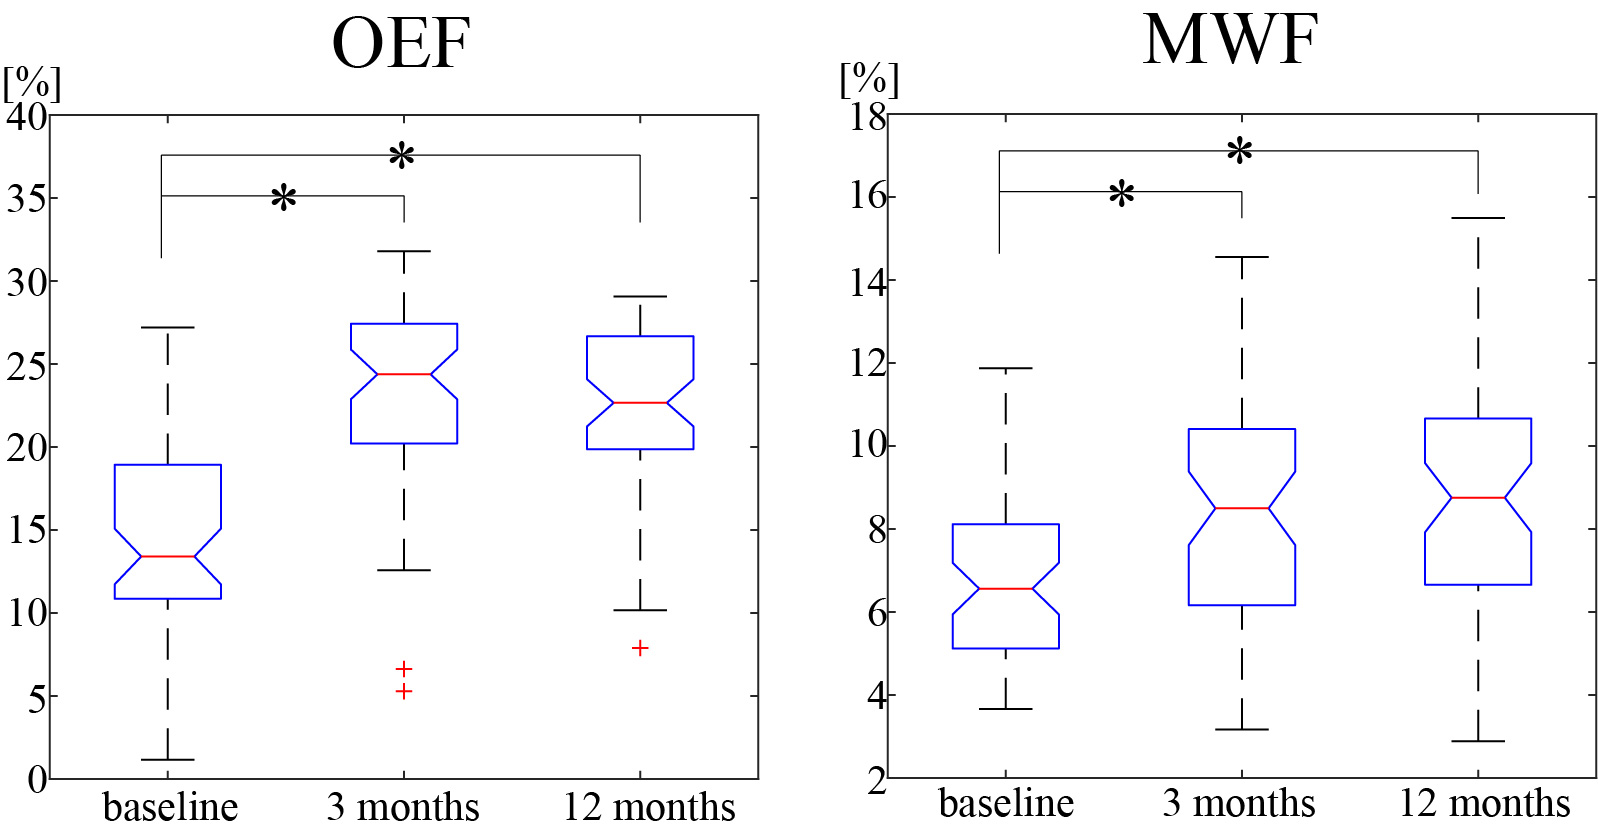
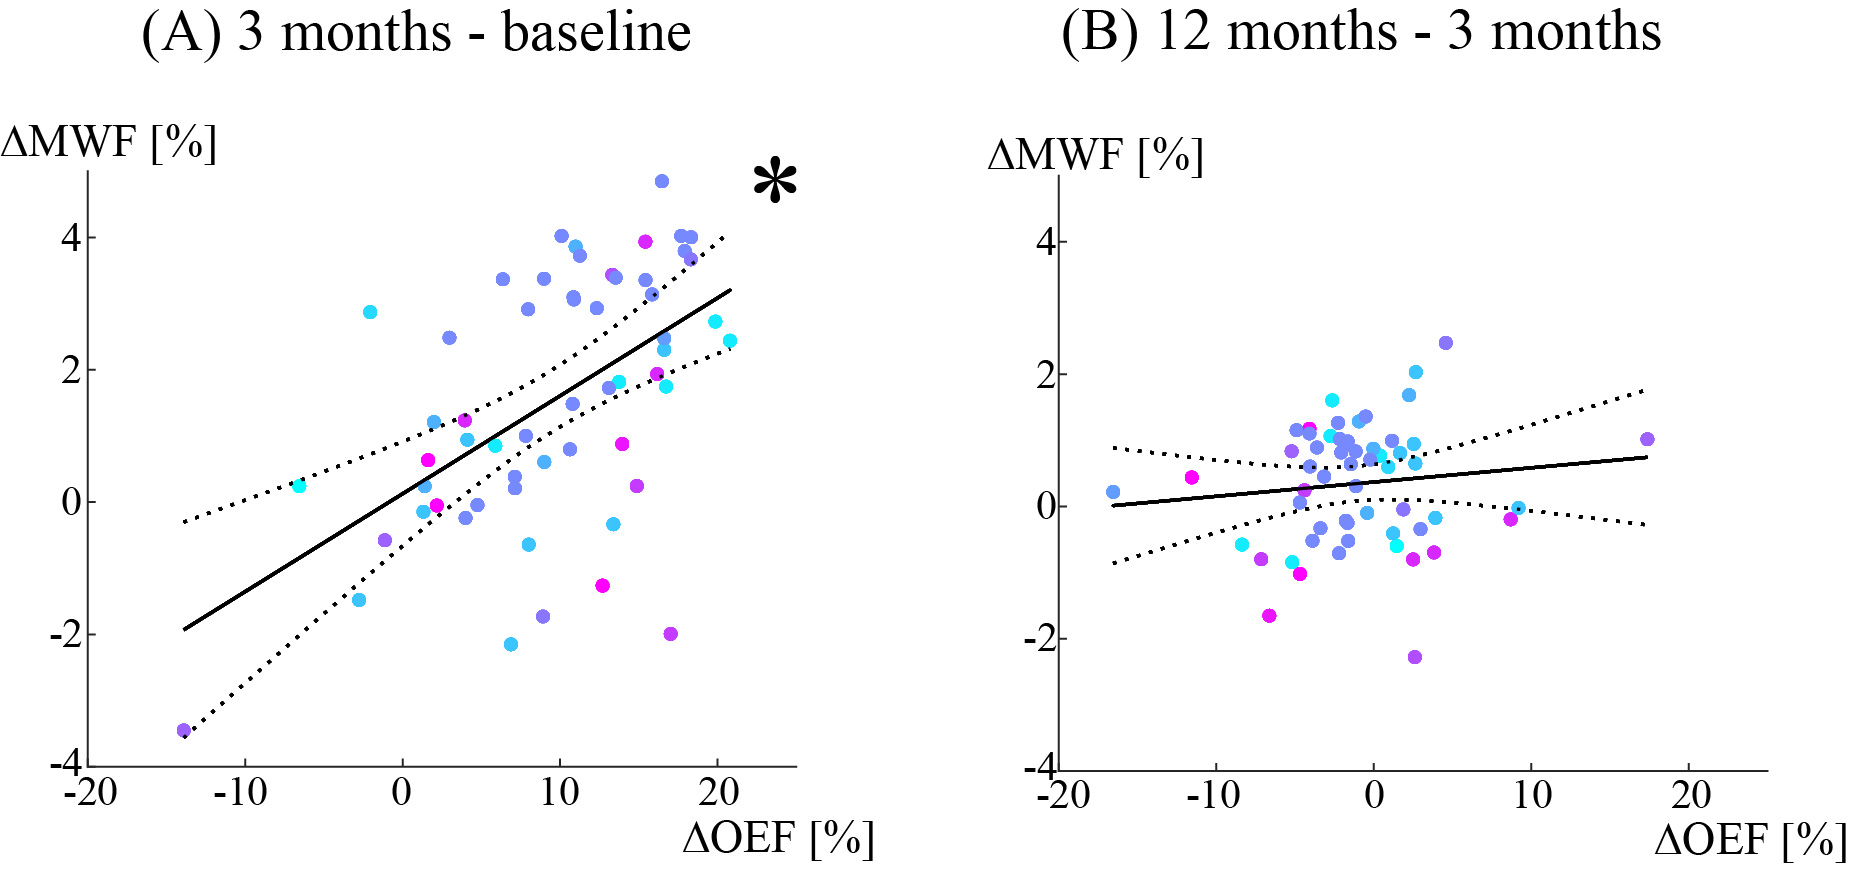
57 new Gd-enhancing lesions were identified. Of these, lesion volume was 572.7 ± 850.7 mm3. Both OEF and MWF were significantly increased from baseline to 3 months: OEF = 14.0 ± 6.0% vs. 23.5 ± 5.6% (p<0.001) and MWF = 6.8 ± 2.2 % vs. 8.3 ± 2.6 % (p<0.001) and (Figures 1 and 2). The MWF change showed a significantly positive association with OEF change from baseline to 3 months (p=0.001) (Figure 3).However, OEF and MWF did not show significant change from 3 months to 12 months: OEF = 23.5 ± 5.6% vs. 22.4 ± 4.7% (p=0.188) and MWF = 8.3 ± 2.6 % vs. 8.7 ± 2.6 % (p=0.383), and no significant association of MWF change with OEF change was found from 3 months to 12 months (p=0.323).
Discussion
This longitudinal study of newly formed MS lesions demonstrated that QQ-based high-resolution OEF mapping can be used for investigating MS lesion-specific oxygen utilization. We showed for the first time that greater OEF increase is associated with greater myelin recovery early after lesion development. This result suggests that increased lesion OEF at the acute phase may contribute to remyelination and is consistent with extensive energy metabolism required for events associated with remyelination, such as migration of oligodendrocyte progenitor cells to demyelinated lesions, proliferation, and myelin synthesis5.QSM has become a reliable tool for measuring susceptibility change in the brain28, 29. QQ for further extracting blood deoxyheme iron (OEF effect) from QSM provides a direct and challenge-free tool of wide and easy availability for studying tissue oxygen metabolism. QQ is shown here to be useful for assessing oxygen metabolism in acute MS lesions.
Conclusion
This study suggests that QQ-based OEF mapping may serve as a useful tool to study oxygen metabolism in tissue. The temporal evolution of MS lesion oxygen metabolism is related to remyelination in acute lesions. QQ-based OEF may be used to inform the development of novel MS therapeutic targets for remyelination.Acknowledgements
No acknowledgement found.References
1. Patrikios P, Stadelmann C, Kutzelnigg A, et al. Remyelination is extensive in a subset of multiple sclerosis patients. Brain : a journal of neurology 2006; 129: 3165-3172. 2006/08/22. DOI: 10.1093/brain/awl217.
2. Patani R, Balaratnam M, Vora A, et al. Remyelination can be extensive in multiple sclerosis despite a long disease course. Neuropathol Appl Neurobiol 2007; 33: 277-287. 2007/04/20. DOI: 10.1111/j.1365-2990.2007.00805.x.
3. Lassmann H. Mechanisms of white matter damage in multiple sclerosis. Glia 2014; 62: 1816-1830. 2014/01/29. DOI: 10.1002/glia.22597.
4. Piaton G, Gould RM and Lubetzki C. Axon-oligodendrocyte interactions during developmental myelination, demyelination and repair. J Neurochem 2010; 114: 1243-1260. 2010/06/08. DOI: 10.1111/j.1471-4159.2010.06831.x.
5. Tepavčević V. Oligodendroglial Energy Metabolism and (re)Myelination. Life (Basel) 2021; 11: 238. DOI: 10.3390/life11030238.
6. Cho J, Nguyen TD, Huang W, et al. Brain oxygen extraction fraction mapping in patients with multiple sclerosis. Journal of cerebral blood flow and metabolism : official journal of the International Society of Cerebral Blood Flow and Metabolism 2021: 271678x211048031. 2021/09/25. DOI: 10.1177/0271678x211048031.
7. Cho J, Spincemaille P, Nguyen TD, et al. Temporal clustering, tissue composition, and total variation for mapping oxygen extraction fraction using QSM and quantitative BOLD. Magn Reson Med 2021; 86: 2635-2646. 2021/06/11. DOI: 10.1002/mrm.28875.
8. Cho J, Zhang S, Kee Y, et al. Cluster analysis of time evolution (CAT) for quantitative susceptibility mapping (QSM) and quantitative blood oxygen level-dependent magnitude (qBOLD)-based oxygen extraction fraction (OEF) and cerebral metabolic rate of oxygen (CMRO2) mapping. 2020; 83: 844-857. DOI: 10.1002/mrm.27967.
9. Cho J, Lee J, An H, et al. Cerebral oxygen extraction fraction (OEF): Comparison of challenge-free gradient echo QSM+qBOLD (QQ) with 15O PET in healthy adults. Journal of Cerebral Blood Flow & Metabolism 2020; 41: 1658-1668. DOI: 10.1177/0271678X20973951.
10. Cho J, Kee Y, Spincemaille P, et al. Cerebral metabolic rate of oxygen (CMRO2) mapping by combining quantitative susceptibility mapping (QSM) and quantitative blood oxygenation level-dependent imaging (qBOLD). Magnetic resonance in medicine 2018; 80: 1595-1604. DOI: doi:10.1002/mrm.27135.
11. Cho J, Zhang J, Spincemaille P, et al. QQ-NET – using deep learning to solve quantitative susceptibility mapping and quantitative blood oxygen level dependent magnitude (QSM+qBOLD or QQ) based oxygen extraction fraction (OEF) mapping. Magnetic Resonance in Medicine 2021; n/a. DOI: https://doi.org/10.1002/mrm.29057.
12. Cho J, Ma Y, Spincemaille P, et al. Cerebral oxygen extraction fraction: Comparison of dual-gas challenge calibrated BOLD with CBF and challenge-free gradient echo QSM+qBOLD. Magnetic Resonance in Medicine 2021; 85: 953-961. DOI: 10.1002/mrm.28447.
13. Zhang S, Cho J, Nguyen TD, et al. Initial Experience of Challenge-Free MRI-Based Oxygen Extraction Fraction Mapping of Ischemic Stroke at Various Stages: Comparison With Perfusion and Diffusion Mapping. Frontiers in Neuroscience 2020; 14. Original Research. DOI: 10.3389/fnins.2020.535441.
14. Wu D, Zhou Y, Cho J, et al. The Spatiotemporal Evolution of MRI-Derived Oxygen Extraction Fraction and Perfusion in Ischemic Stroke. Frontiers in Neuroscience 2021; 15. Original Research. DOI: 10.3389/fnins.2021.716031.
15. Shen N, Zhang S, Cho J, et al. Application of Cluster Analysis of Time Evolution for Magnetic Resonance Imaging -Derived Oxygen Extraction Fraction Mapping: A Promising Strategy for the Genetic Profile Prediction and Grading of Glioma. Front Neurosci 2021; 15: 736891. 2021/10/22. DOI: 10.3389/fnins.2021.736891.
16. Nguyen TD, Deh K, Monohan E, et al. Feasibility and reproducibility of whole brain myelin water mapping in 4 minutes using fast acquisition with spiral trajectory and adiabatic T2prep (FAST-T2) at 3T. Magnetic resonance in medicine 2016; 76: 456-465. DOI: 10.1002/mrm.25877.
17. Laule C, Kozlowski P, Leung E, et al. Myelin water imaging of multiple sclerosis at 7 T: correlations with histopathology. Neuroimage 2008; 40: 1575-1580. 2008/03/07. DOI: 10.1016/j.neuroimage.2007.12.008.
18. McCreary CR, Bjarnason TA, Skihar V, et al. Multiexponential T2 and magnetization transfer MRI of demyelination and remyelination in murine spinal cord. Neuroimage 2009; 45: 1173-1182. 2009/04/08. DOI: 10.1016/j.neuroimage.2008.12.071.
19. Vargas WS, Monohan E, Pandya S, et al. Measuring longitudinal myelin water fraction in new multiple sclerosis lesions. Neuroimage Clin 2015; 9: 369-375. 2015/11/26. DOI: 10.1016/j.nicl.2015.09.003.
20. Liu Z, Spincemaille P, Yao Y, et al. MEDI+0: Morphology enabled dipole inversion with automatic uniform cerebrospinal fluid zero reference for quantitative susceptibility mapping. Magn Reson Med 2018; 79: 2795-2803. 2017/10/13. DOI: 10.1002/mrm.26946.
21. Dimov AV, Nguyen TD, Spincemaille P, et al. Global cerebrospinal fluid as a zero-reference regularization for brain quantitative susceptibility mapping. Journal of Neuroimaging; n/a. DOI: https://doi.org/10.1111/jon.12923.
22. Zhang J, Cho J, Zhou D, et al. Quantitative susceptibility mapping-based cerebral metabolic rate of oxygen mapping with minimum local variance. Magn Reson Med 2017 2017/03/16. DOI: 10.1002/mrm.26657.
23. Zhang J, Zhou D, Nguyen TD, et al. Cerebral metabolic rate of oxygen (CMRO2) mapping with hyperventilation challenge using quantitative susceptibility mapping (QSM). Magnetic resonance in medicine 2017; 77: 1762-1773. DOI: 10.1002/mrm.26253.
24. Zhang J, Liu T, Gupta A, et al. Quantitative mapping of cerebral metabolic rate of oxygen (CMRO2) using quantitative susceptibility mapping (QSM). Magnetic Resonance in Medicine 2015; 74: 945-952. DOI: 10.1002/mrm.25463.
25. Ulrich X and Yablonskiy DA. Separation of cellular and BOLD contributions to T2* signal relaxation. Magn Reson Med 2016; 75: 606-615. 2015/03/11. DOI: 10.1002/mrm.25610.
26. Yablonskiy DA, Sukstanskii AL and He X. BOLD-based Techniques for Quantifying Brain Hemodynamic and Metabolic Properties – Theoretical Models and Experimental Approaches. NMR in biomedicine 2013; 26: 963-986. DOI: 10.1002/nbm.2839.
27. Yablonskiy DA and Haacke EM. Theory of NMR signal behavior in magnetically inhomogeneous tissues: the static dephasing regime. Magn Reson Med 1994; 32: 749-763.
28. Wang Y, Spincemaille P, Liu Z, et al. Clinical quantitative susceptibility mapping (QSM): Biometal imaging and its emerging roles in patient care. Journal of magnetic resonance imaging : JMRI 2017; 46: 951-971. 2017/03/16. DOI: 10.1002/jmri.25693.
29. Wang Y and Liu T. Quantitative susceptibility mapping (QSM): Decoding MRI data for a tissue magnetic biomarker. Magn Reson Med 2015; 73: 82-101. DOI: 10.1002/mrm.25358.
Figures