0135
Longitudinal Changes of White Matter Hyperintensities Following Hemodialysis Initiation in Old Adults: A Prospective Pilot Study1Center for Magnetic Resonance Research, University of Minnesota, Minneapolis, MN, United States, 2Hennepin HealthCare Research Institute, Hennepin Healthcare, Minneapolis, MN, United States, 3Department of Medicine, University of Minnesota, Minneapolis, MN, United States, 4Geriatrics Division, Department of Medicine, Hennepin Healthcare, Minneapolis, MN, United States
Synopsis
Repeated conventional hemodialysis may result in permanent cerebrovascular dysfunction that can initiate and exacerbate other cerebral structural abnormalities. Until today, the longitudinal WMH burden changes in old end-stage renal disease (ESRD) patients following the initiation of hemodialysis treatment have not been specifically studied. We performed a prospective pilot study with a hypothesis that WMH burden increases following the initiation of hemodialysis in old ESRD patient. Our study results suggested that WMH burdens increased significantly after the initiation of hemodialysis treatment.
Purpose
White matter hyperintensities (WMH) are focal white matter (WM) changes identified as areas of intensive signal on T2-weighted fluid-attenuated inversion recovery (FLAIR) magnetic resonance images (1,2). WMH are widely observed in aged people (3) and patients with neurodegenerative diseases, such as Alzheimer’s disease (AD) (4), vascular dementia (5) and chronic kidney disease (CKD) (6,7). WMH have been associated with the loss of cognitive functions or cognitive impairment (C.I.) (8,9) and suggested to have vascular origins (10,11). WMH can be a valuable early indicator of WM neurodegenerative changes, reflecting subclinical cerebrovascular disease or ischemia (11-13).Hemodialysis is a dominant renal replacement therapy in the United States with about 88% of end-stage renal disease (ESRD) patients undergoing hemodialysis treatment while most of these ESRD patients are older than 55 years. Hemodialysis can increase the risk of cerebral vascular dysfunction and C.I. in older adults who are susceptible to cerebral damage due to an aging vasculature. Repeated hemodialysis may result in permanent cerebrovascular dysfunction that can initiate and exacerbate other cerebral structural abnormalities. Our recent study has indicated that following hemodialysis initiation, CBF declined globally in GM and WM, and regionally in the hippocampus and orbitofrontal cortex, paralleling the observed global cognitive decline (14). Until today, the longitudinal WMH burden changes in older ESRD patients following the initiation of hemodialysis treatment have not been specifically studied, but such information may provide extra and more insights into the origins of increased C.I. prevalence and elevated incidence of stroke in older hemodialysis patients. We performed a prospective pilot study with a hypothesis that WMH burden increases following the initiation of hemodialysis in older ESRD patients, and our study results are reported in the following.
Methods
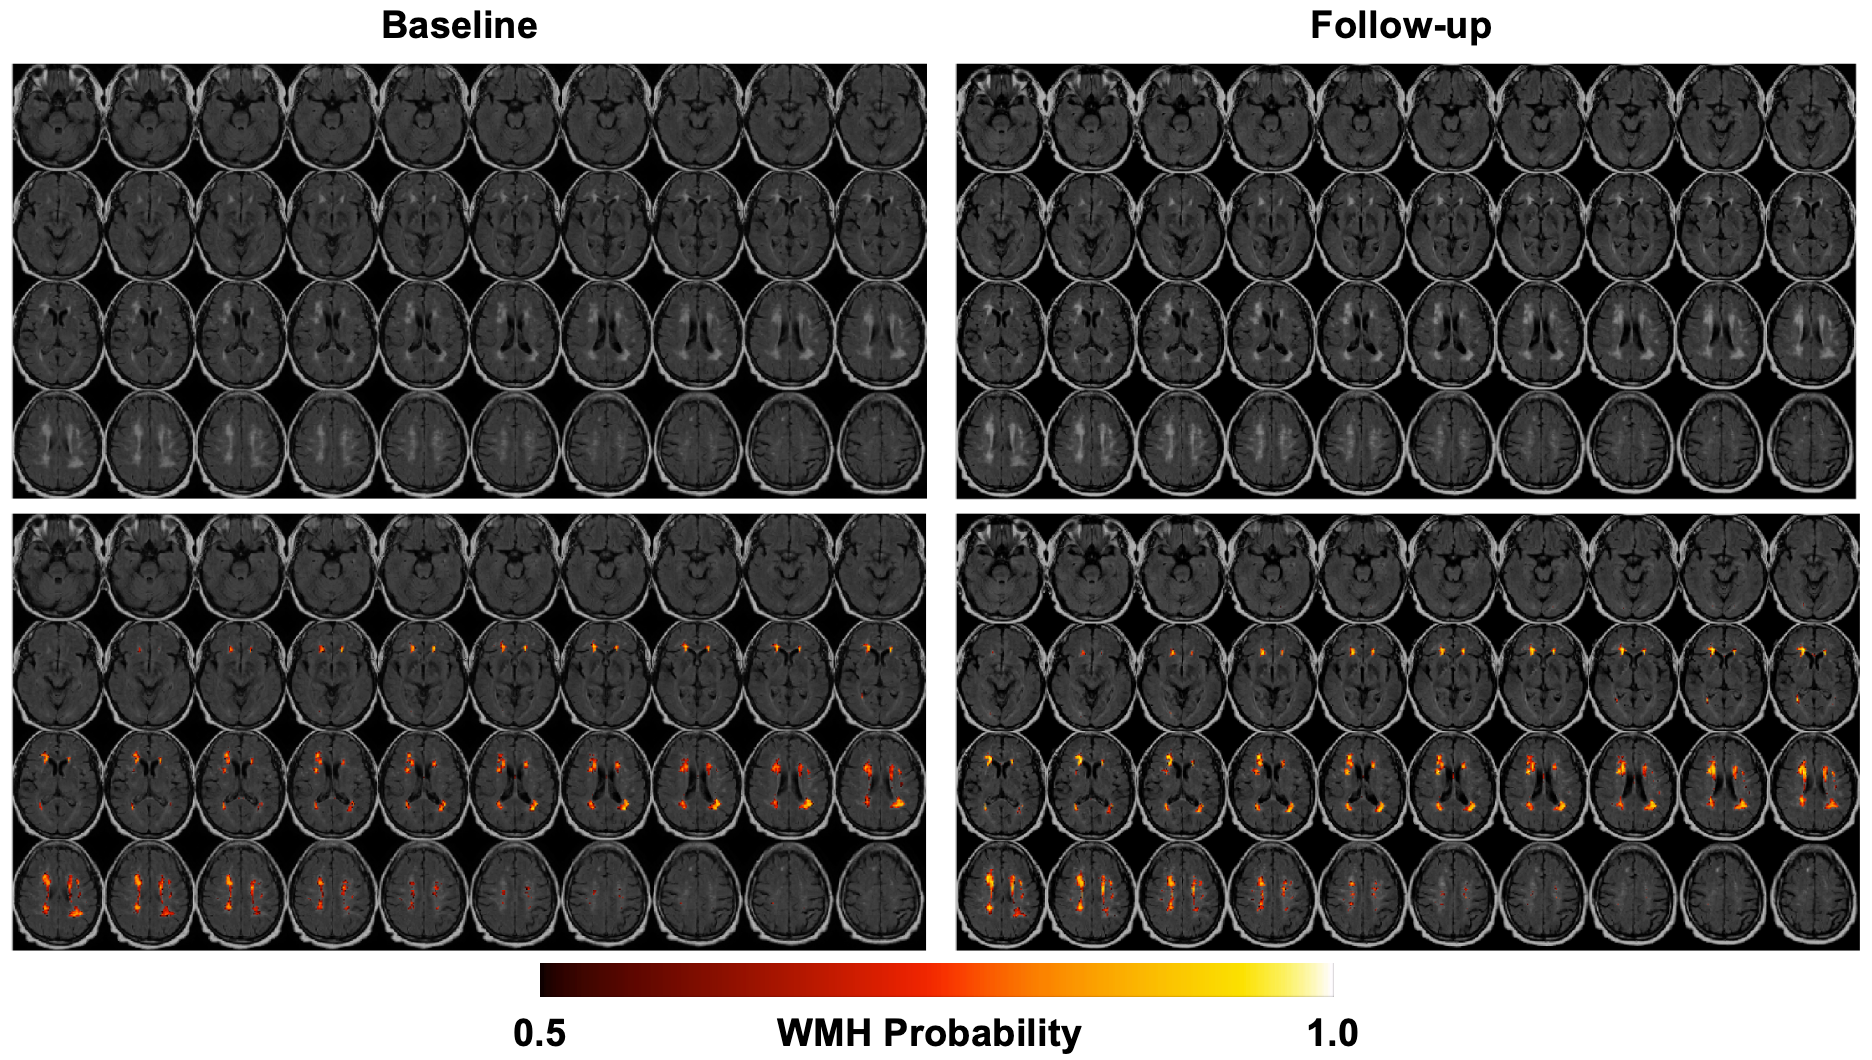
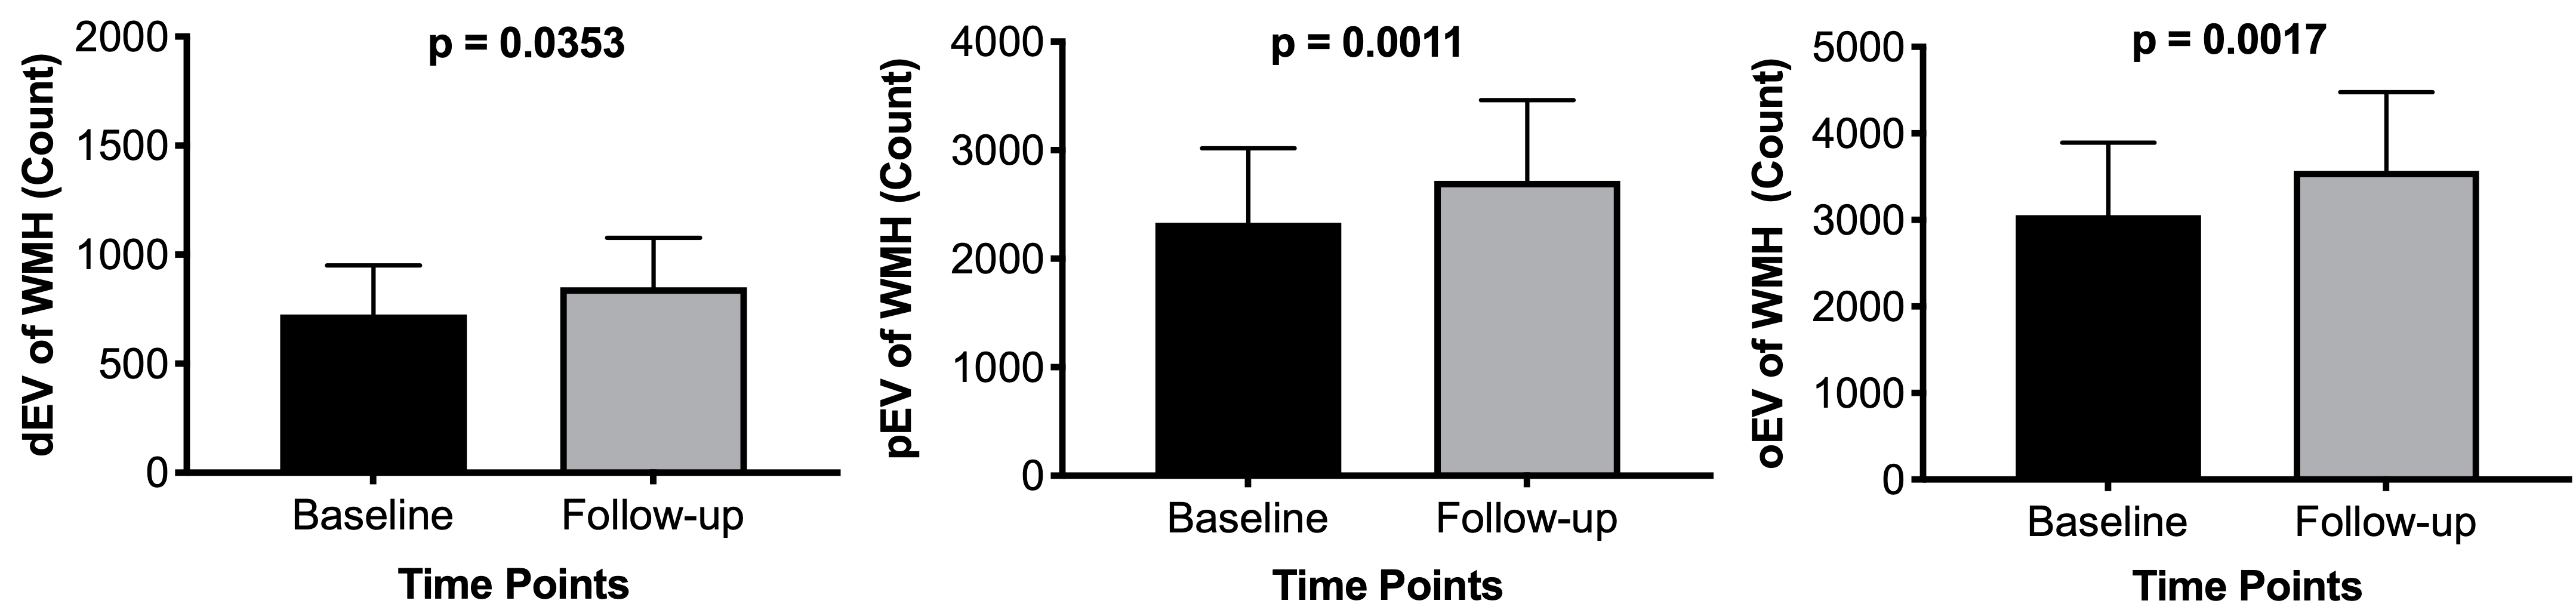
The overall study design, patient selection, and MRI study strategy and methods have been described in detail in our previous report about cerebral blood flow characteristics following hemodialysis initiation in older adults (14). In brief, a group of ESRD patients who transitioned to standard thrice-weekly hemodialysis participated in a longitudinal MRI study with two sessions: baseline, about 3 months before, and follow-up, about 6 months after hemodialysis initiation, and the MRI study protocol included high-resolution T1- and T2-weighted anatomic imaging acquisitions. Among a total of 14 participants who completed both MRI sessions, three participants were excluded from data analysis due to either missing T2-weighted FLAIR MRI data for one study session or poor image quality due to excessive motions. The major parameters for anatomic T1-weighted imaging using magnetization prepared rapid acquisition gradient echo (MPRAGE) were: TR/TE = 2300/4 ms; inversion recovery (IR) delay time = 1000 ms; and resolution = 0.9 x 0.9 x 1.2 mm3. The major parameters for T2-weighted FLAIR imaging were as follows: TR/TE = 6000/140 ms; IR delay time = 2000 ms; and resolution = 0.83 x 0.83 x 5 mm3.Image processing operations were performed using SPM12, as well as in-house scripts implemented within MATLAB. The analysis of WMH burden utilized the Wisconsin White Matter Hyperintensities Segmentation toolbox with T1- and T2-weighted imaging data. This toolbox utilizes the supervised method and random forest based regression, and provides the segmented WMH probability maps and estimates of WMH burdens. The WMH burdens are assessed using normalized WMH effective volumes (EV) that are calculated as the hyperintense voxel counts weighted by the WMH likelihood of the voxels (15). Statistical analyses were performed within GraphPad Prism software using paired one-tailed t-tests to compare WMH burdens across time and paired two-tailed t-tests to compare WMH burdens between regions. For any performed analysis, statistical significance was defined as a p value less than 0.05, and marginal significance as a p value less than 0.1.
Results and Discussion
The results of WMH burden analysis from one subject are presented in Figure 1. The estimates of WMH burdens in deep WM, WM around periventricular regions and overall WM at baseline and follow-up are shown in Figure 2, and the corresponding longitudinal percentage changes of WMH burdens are presented in Figure 3. Our study results suggested that WMH burdens increased significantly following the initiation of hemodialysis, and that periventricular regions had significantly larger WMH burdens than deep regions at both baseline and follow-up with p values equal to 0.0213 and 0.0130, respectively while the magnitudes of WMH burdens percentage changes were comparable between these two regions (Figure 3). These pilot study results need to be further verified with a larger number of patients in the future.Conclusions
Our prospective pilot MRI study with ESRD patients suggested that WMH burdens increased significantly after the initiation of hemodialysis treatment.Acknowledgements
This study was supported by National Institute on Aging Grant R01 AG03755, National Institute of Health P41 EB027061, and University of Minnesota Foundation (UMF0003900). Research reported in this publication was also supported by the National Center for Advancing Translational Sciences of the National Institutes of Health Award UL1TR000114. The content is solely the responsibility of the authors and does not necessarily represent the official views of the National Institutes of Health.References
1. Georgakis MK, Duering M, Wardlaw JM, Dichgans M. WMH and long-term outcomes in ischemic stroke: A systematic review and meta-analysis. Neurology 2019;92(12):e1298-e1308.
2. Goldberg MP, Ransom BR. New light on white matter. Stroke; a journal of cerebral circulation 2003;34(2):330-332.
3. Yoshita M, Fletcher E, Harvey D, Ortega M, Martinez O, Mungas DM, Reed BR, DeCarli CS. Extent and distribution of white matter hyperintensities in normal aging, MCI, and AD. Neurology 2006;67(12):2192-2198.
4. Vermeer SE, Prins ND, den Heijer T, Hofman A, Koudstaal PJ, Breteler MM. Silent brain infarcts and the risk of dementia and cognitive decline. N Engl J Med 2003;348(13):1215-1222.
5. Liu Y, Braidy N, Poljak A, Chan DKY, Sachdev P. Cerebral small vessel disease and the risk of Alzheimer's disease: A systematic review. Ageing Res Rev 2018;47:41-48.
6. Vemuri P, Davey C, Johansen KL, Zuk SM, Reid RI, Thostenson KB, Reddy AL, Jack CR, Knopman DS, Murray AM. Chronic Kidney Disease Associated with Worsening White Matter Disease and Ventricular Enlargement. J Alzheimers Dis 2021;83(4):1729-1740.
7. Vemuri P, Knopman DS, Jack CR, Jr., Lundt ES, Weigand SD, Zuk SM, Thostenson KB, Reid RI, Kantarci K, Slinin Y, Lakshminarayan K, Davey CS, Murray A. Association of Kidney Function Biomarkers with Brain MRI Findings: The BRINK Study. J Alzheimers Dis 2017;55(3):1069-1082.
8. Wang YL, Chen W, Cai WJ, Hu H, Xu W, Wang ZT, Cao XP, Tan L, Yu JT, Alzheimer's Disease Neuroimaging I. Associations of White Matter Hyperintensities with Cognitive Decline: A Longitudinal Study. J Alzheimers Dis 2020;73(2):759-768.
9. Inzitari D, Pracucci G, Poggesi A, Carlucci G, Barkhof F, Chabriat H, Erkinjuntti T, Fazekas F, Ferro JM, Hennerici M, Langhorne P, O'Brien J, Scheltens P, Visser MC, Wahlund LO, Waldemar G, Wallin A, Pantoni L, Group LS. Changes in white matter as determinant of global functional decline in older independent outpatients: three year follow-up of LADIS (leukoaraiosis and disability) study cohort. BMJ 2009;339:b2477.
10. Mustapha M, Nassir C, Aminuddin N, Safri AA, Ghazali MM. Cerebral Small Vessel Disease (CSVD) - Lessons From the Animal Models. Front Physiol 2019;10:1317.
11. Luchsinger JA, Brickman AM, Reitz C, Cho SJ, Schupf N, Manly JJ, Tang MX, Small SA, Mayeux R, DeCarli C, Brown TR. Subclinical cerebrovascular disease in mild cognitive impairment. Neurology 2009;73(6):450-456.
12. Koton S, Schneider ALC, Windham BG, Mosley TH, Gottesman RF, Coresh J. Microvascular Brain Disease Progression and Risk of Stroke: The ARIC Study. Stroke; a journal of cerebral circulation 2020;51(11):3264-3270.
13. Tosto G, Zimmerman ME, Carmichael OT, Brickman AM, Alzheimer's Disease Neuroimaging I. Predicting aggressive decline in mild cognitive impairment: the importance of white matter hyperintensities. JAMA Neurol 2014;71(7):872-877.
14. Li X, Slinin YX, Zhang L, Dengel DR, Tupper D, Metzger GJ, Murray AM. Cerebral blood flow characteristics following hemodialysis initiation in older adults: A prospective longitudinal pilot study using arterial spin labeling imaging. Neuroimage Clin 2020;28:102434.
15. Ithapu V, Singh V, Lindner C, Austin BP, Hinrichs C, Carlsson CM, Bendlin BB, Johnson SC. Extracting and summarizing white matter hyperintensities using supervised segmentation methods in Alzheimer's disease risk and aging studies. Hum Brain Mapp 2014;35(8):4219-4235.
Figures