0134
Neuronal Response to Transcranial Direct Current Stimulation (tDCS) in Multiple Sclerosis1Radiology, NYU Grossman School of Medicine, New York City, NY, United States, 2Neurology, NYU Grossman School of Medicine, New York City, NY, United States, 3Soterix Medical Inc., New York City, NY, United States, 4Department of Biomedical Engineering, City College of New York, New York City, NY, United States
Synopsis
Transcranial direct current stimulation (tDCS) represents an innovative therapeutic tool for neurological diseases such as multiple sclerosis (MS). In this study, MRI measurements of cerebral blood flow (CBF), venous oxygenation (Yv) and cerebral metabolic rate of oxygen (CMRO2) of MS patients and healthy controls (HCs) were acquired pre-, during- and post-tDCS to investigate its simultaneous effects. Whilst HCs showed an immediate increase (~5%) in CMRO2 (during- versus pre-tDCS, p<0.001), MS patients showed a delayed response to tDCS (7.7% CMRO2 increase pre- versus post-tDCS; p=0.007). We suggest that neuronal response to tDCS represents a potential biomarker of neuronal plasticity.
Introduction
Transcranial direct current stimulation (tDCS) is a safe, noninvasive and well-tolerated therapeutic alternative that modulates cortical excitability by applying a weak electrical current1. tDCS has received growing interest, especially for its reported positive effects in treating neurological diseases such as multiple sclerosis (MS)2,3. However, the in-vivo physiological and metabolic underpinnings of tDCS on neuronal cells have yet to be fully elucidated. The purpose of this report is to bridge the gap in the literature regarding the tDCS simultaneous effects on biophysiological markers such as: cerebral blood flow (CBF), venous blood oxygenation (Yv), and cerebral metabolic rate of O2 (CMRO2) in MS patients as well as healthy controls (HCs). A better understanding of how tDCS differently affects the cortical excitability of patients offers an innovative opportunity to assess the neuronal reactivity or plasticity in relation to tDCS treatments.Methods
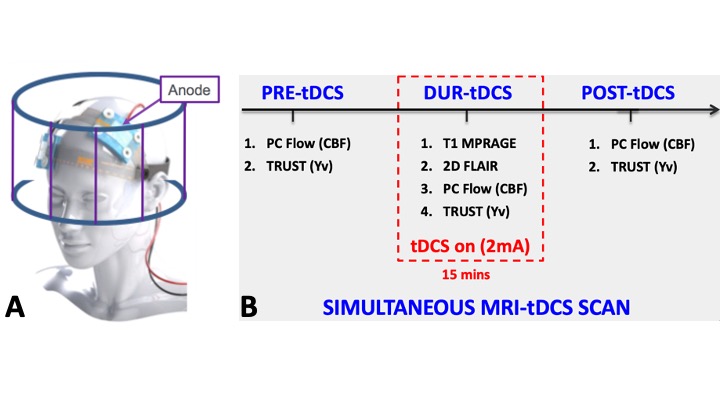
Thirty patients with clinically diagnosed MS (age: 47±12 years, 19 females) were recruited to undergo a tDCS-MRI simultaneous scan. All participants were screened for common MRI safety criteria, as well as tolerability to tDCS. Scans were performed following IRB-approved protocols in a 3T scanner fitted with a 64 channels head coil. The stimulation was applied via MRI-compatible tDCS device (Soterix Medical). During the MRI session all subjects received a left anodal dorsolateral prefrontal cortex (DLPC) 2.0mA direct current stimulation for 15 minutes (Figure 1A). Following sequences were used to extract biophysiological parameters: 3D T1 MPRAGE for structural brain images; T2-Relaxation-Under-Spin-Tagging (TRUST) to measure the Yv in the superior sagittal sinus, above the confluence4; phase contrast MRI (PC-MRI) to measure blood flux in the 4 major neck arteries (bilateral internal carotid and vertebral arteries) and to obtain the total CBF by normalizing for the subject-specific brain volumes. Images were acquired at three timepoints: before (pre-tDCS), during (dur-tDCS) and immediately after (post-tDCS) the stimulation, represented in figure 1B. CMRO2 was then calculated using CBF and Yv, as reported in previous literature5. 20 healthy controls (HC, 34±13 years, 11 females) were also scanned under exact same scanning procedure to provide comparison with the MS patients’ results. Statistical analysis involved a paired t-test to compare CBF, Yv and CMRO2 amongst combinations of the three timepoints within MS and HC groups separately.Results and Discussion
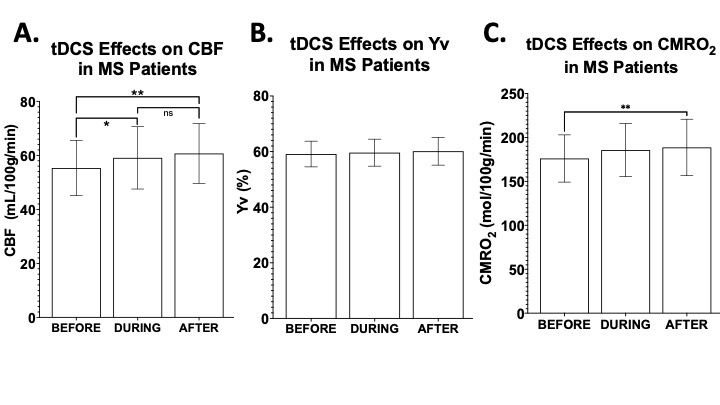
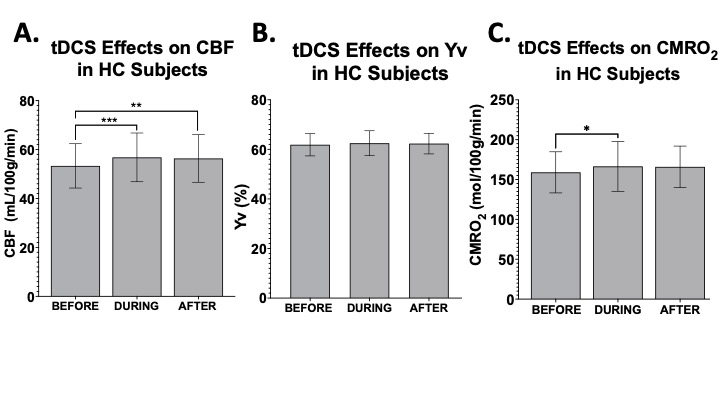
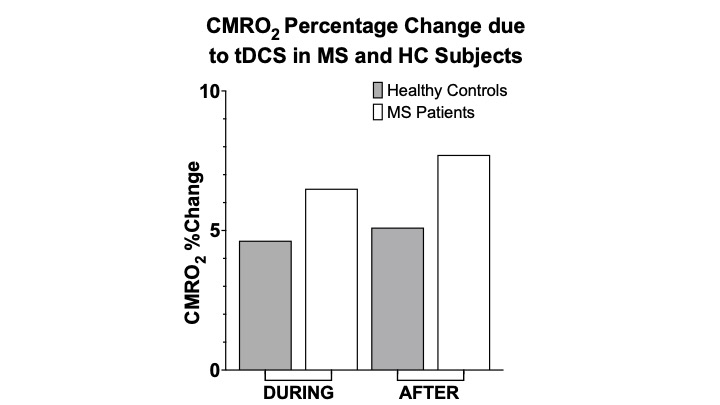
In MS patients, significant increase was observed for CBF measurement from pre-tDCS (55.3±10.1 ml/100g/min) to dur-tDCS (59.1±11.4; p=0.021), as well as between pre-tDCS and post-tDCS (60.7±10.9 ml/100g/min; p=0.001), suggesting that tDCS-induced neuronal activation results in blood flow increase via neuro-vascular coupling (Figure 2A). The Yv levels remained constant at ~60% throughout the scanning sessions (Figure 2B), suggesting the over supplied O2, due to the increased CBF, is offset by an increased O2 consumption caused by tDCS. CMRO2 analysis showed a significant increase (7.7%) from pre-tDCS (176.1±26.4 μmol/100g/min) to post-tDCS (188.7±31.6; p=0.007) levels, but not significant from pre- to dur-tDCS (185.7±29.8 μmol/100g/min; p=0.07), as evident in figure 2C. Whilst in MS patients the gradual increase is observed throughout the sessions, in HCs the CBF measured in pre-tDCS (53.3±8.8 ml/100g/min) seems to immediately peak dur-tDCS (56.8±9.7 ml/100g/min; p<0.01) and then plateaus or slightly decreases in post-tDCS (56.3±9.5 ml/100g/min; p=0.7 compared to dur-tDCS), as observable in figure 3A and consistent with previous reports6. Yv is also constant throughout the scanning session in HCs at ~60% (Figure 3B). In HCs, an increase of ~5% (p=0.024) CMRO2 was observed dur-tDCS as compared to pre-tDCS session with a decrease trend after the stimulation is turned off (post-tDCS) (Figure 3C). These results show that tDCS alters the CBF and CMRO2 associated with the current-induced increased cortical excitability in both HCs and MS patients. Figure 4 shows the percentage change in CMRO2 levels with respect to pre-tDCS in both HC (gray) and MS (white), both during and after tDCS. This analysis supports the hypothesis of a delayed and continuing response in patients, even when tDCS is turned off, in contrast with the more immediate response observed in HCs. On the other hand, CBF showed similar immediate increase in response to tDCS in both MS (Figure 2A) and HCs (Figure 3A). These distinctions might suggest that tDCS has separate vascular and neuronal effects. Finally, although patients showed slightly larger increase of CBF dur- versus pre-tDCS, no statistically significant increase in CMRO2 due-tDCS was reached (p=0.07). This might be caused by the larger variance observed in MS patients, possibly linked to subject-specific disease severity and neuronal plasticity potential. Further studies correlating these imaging results with clinical measurements might provide innovative methods to differentiate between responders and non-responders to tDCS treatments.Conclusion
These findings of our preliminary study support our hypothesis that tDCS induces changes in the neuronal activation with increased CBF and CMRO2, which can be measured with simultaneous MRI-tDCS. Most importantly, we show how the effects of tDCS on the cortical excitability differ between MS patients and HCs, with an observed delayed reaction for the patients, which continues even after the stimulation, and a more immediate one in HCs, peaking during tDCS. A better understanding of how responses to tDCS differ between patients (responders versus non-responders) may therefore have important therapeutic implementation.Acknowledgements
This study was funded by National Institute of Health (NIH/NICHD: R21 HD094424)References
1. Nitsche, M.A., Cohen, L.G., Wassermann, E.M., Priori, A., Lang, N., Antal, A., Paulus, W., Hummel, F., Boggio, P.S., Fregni, F. , Pascual-Leone, A., Transcranial direct current stimulation: state of the art 2008.Brain stimulation, 2008.1(3): p. 206-223.
2. Charvet, L.E., Dobbs, B., Shaw, M.T., Bikson, M., Datta, A. and Krupp, L.B., 2018. Remotely supervised transcranial direct current stimulation for the treatment of fatigue in multiple sclerosis: results from a randomized, sham-controlled trial. Multiple Sclerosis Journal, 24(13), pp.1760-1769.
3. Fiene, M., Rufener, K.S., Kuehne, M., Matzke, M., Heinze, H.J. and Zaehle, T., 2018. Electrophysiological and behavioral effects of frontal transcranial direct current stimulation on cognitive fatigue in multiple sclerosis. Journal of neurology, 265(3), pp.607-617.
4. Lu, H. and Ge, Y., 2008. Quantitative evaluation of oxygenation in venous vessels using T2‐relaxation‐under‐spin‐tagging MRI. Magnetic Resonance in Medicine: An Official Journal of the International Society for Magnetic Resonance in Medicine, 60(2), pp.357-363.
5. Ge, Y., Zhang, Z., Lu, H., Tang, L., Jaggi, H., Herbert, J., Babb, J.S., Rusinek, H., Grossman, R.I., Characterizing brain oxygen metabolism in patients with multiple sclerosis with T2-relaxation-under-spin-tagging MRI. .Journal of Cerebral Blood Flow & Metabolism, , 2012. 32(3 ): p. 403- 412.
6. Jamil, A., Batsikadze, G., Kuo, H.I., Meesen, R.L., Dechent, P., Paulus, W. and Nitsche, M.A., 2020. Current intensity‐and polarity‐specific online and aftereffects of transcranial direct current stimulation: An fMRI study. Human brain mapping, 41(6), pp.1644-1666.
Figures