0133
High-Resolution Compressed Sensing 19F-MRI Reveals Progression of Neuroinflammation in Autoimmune Encephalomyelitis1Berlin Ultrahigh Field Facility, Max Delbrück Center for Molecular Medicine in the Helmholtz Association, Berlin, Germany, 2Digital Health Center, Hasso Plattner Institute, Potsdam, Germany, 3Experimental and Clinical Research Center (ECRC), A Joint Cooperation between the Charité Medical Faculty and the Max-Delbrück Center for Molecular Medicine, Berlin, Germany
Synopsis
Improving sensitivity has been the major challenge towards realizing the promises of 19F-MRI. Here we combine a cryogenic surface RF probe and compressed sensing to achieve high spatially resolved 19F-MRI of neuroinflammation in a challenging longitudinal study. Inflammation in the CNS was observed even in the absence of neurological symptoms and detailed signals along the CNS vasculature are clearly resolved. Together with effective longitudinal registration this allows an in-depth study of disease progression.
Introduction
Improving sensitivity has been the major challenge towards realizing the promises of 19F-MRI in preclinical investigations.1 We previously demonstrated that 19F-SNR and acquisition time efficiency can be substantially improved with cryogenic surface RF probes2 and by compressed sensing (CS)3 in the characteristic low SNR conditions. Here we combine these developments to achieve high spatially (0.3 mm 3D-isotropic) resolved 19F-MRI of neuroinflammation in a challenging longitudinal study. The goal was to study the progression of inflammatory cells labeled with 19F nanoparticles (NPs) in greater detail in a mouse model of multiple sclerosis.Methods
EAE was induced in 4 female SJL/J mice. Perfluoro-15-crown-5-ether rich nanoparticles were administered daily starting on day 5 (D5) following EAE induction. In vivo MR data was acquired on D10, D12 and D14. All animal experiments were carried out in accordance with local animal welfare guidelines (LaGeSo).MR measurements were performed on a 9.4 T animal scanner using a two-channel cryogenic transceive surface RF probe2 and a linear volume RF resonator for 19F and 1H acquisitions, respectively (all Bruker BioSpin).
A 3D-RARE sequence with random undersampling in both phase encoding dimensions was developed in-house. The central 10% of k-space points were included deterministically and undersampling patterns were sampled from density p(kx, ky) ∝ max(1 - (kx2 + ky2)1/2, 0)3/2, where kx, ky ∈ [-1, 1] (Fig. 1A). A center-out encoding order was used to ensure maximal SNR efficiency and an isotropic point-spread-function in the phase encoding plane (Fig. 1B).
3-fold undersampled 19F MR data was acquired using the above sequence (TR=800ms, TE=5.1ms, ETL=20, FOV=(37.5×25×25)mm3, (120×80x80) image matrix and TA=68min). A noise scan was used to determine the raw data noise level σ. Anatomical 1H imaging was performed with a fully-sampled 3D-RARE sequence (TR=2200ms, TE=7.5ms, ETL=16, FOV=(37.5×25×25)mm3, (150×100x100) image matrix and TA=24min).
19F data was reconstructed with CS for each channel individually. We used the accelerated ADMM4 with equally weighted isotropic total variation5 and image l1-norm regularization. The optimal regularization strength was determined via the discrepancy principle6 and channels were combined with a sum-of-squares reconstruction. 19F reconstructions were thresholded at 2σ and remaining features consisting of <3 connected signal voxels were removed as outliers.7
Registration of anatomical images from D12 and D14 was performed on those from D10 using Advanced Normalization Tools (ANTs).8 The transformation registering the 1H data was then applied to warp the corresponding 19F images into the same geometric space (Fig. 2).
Results
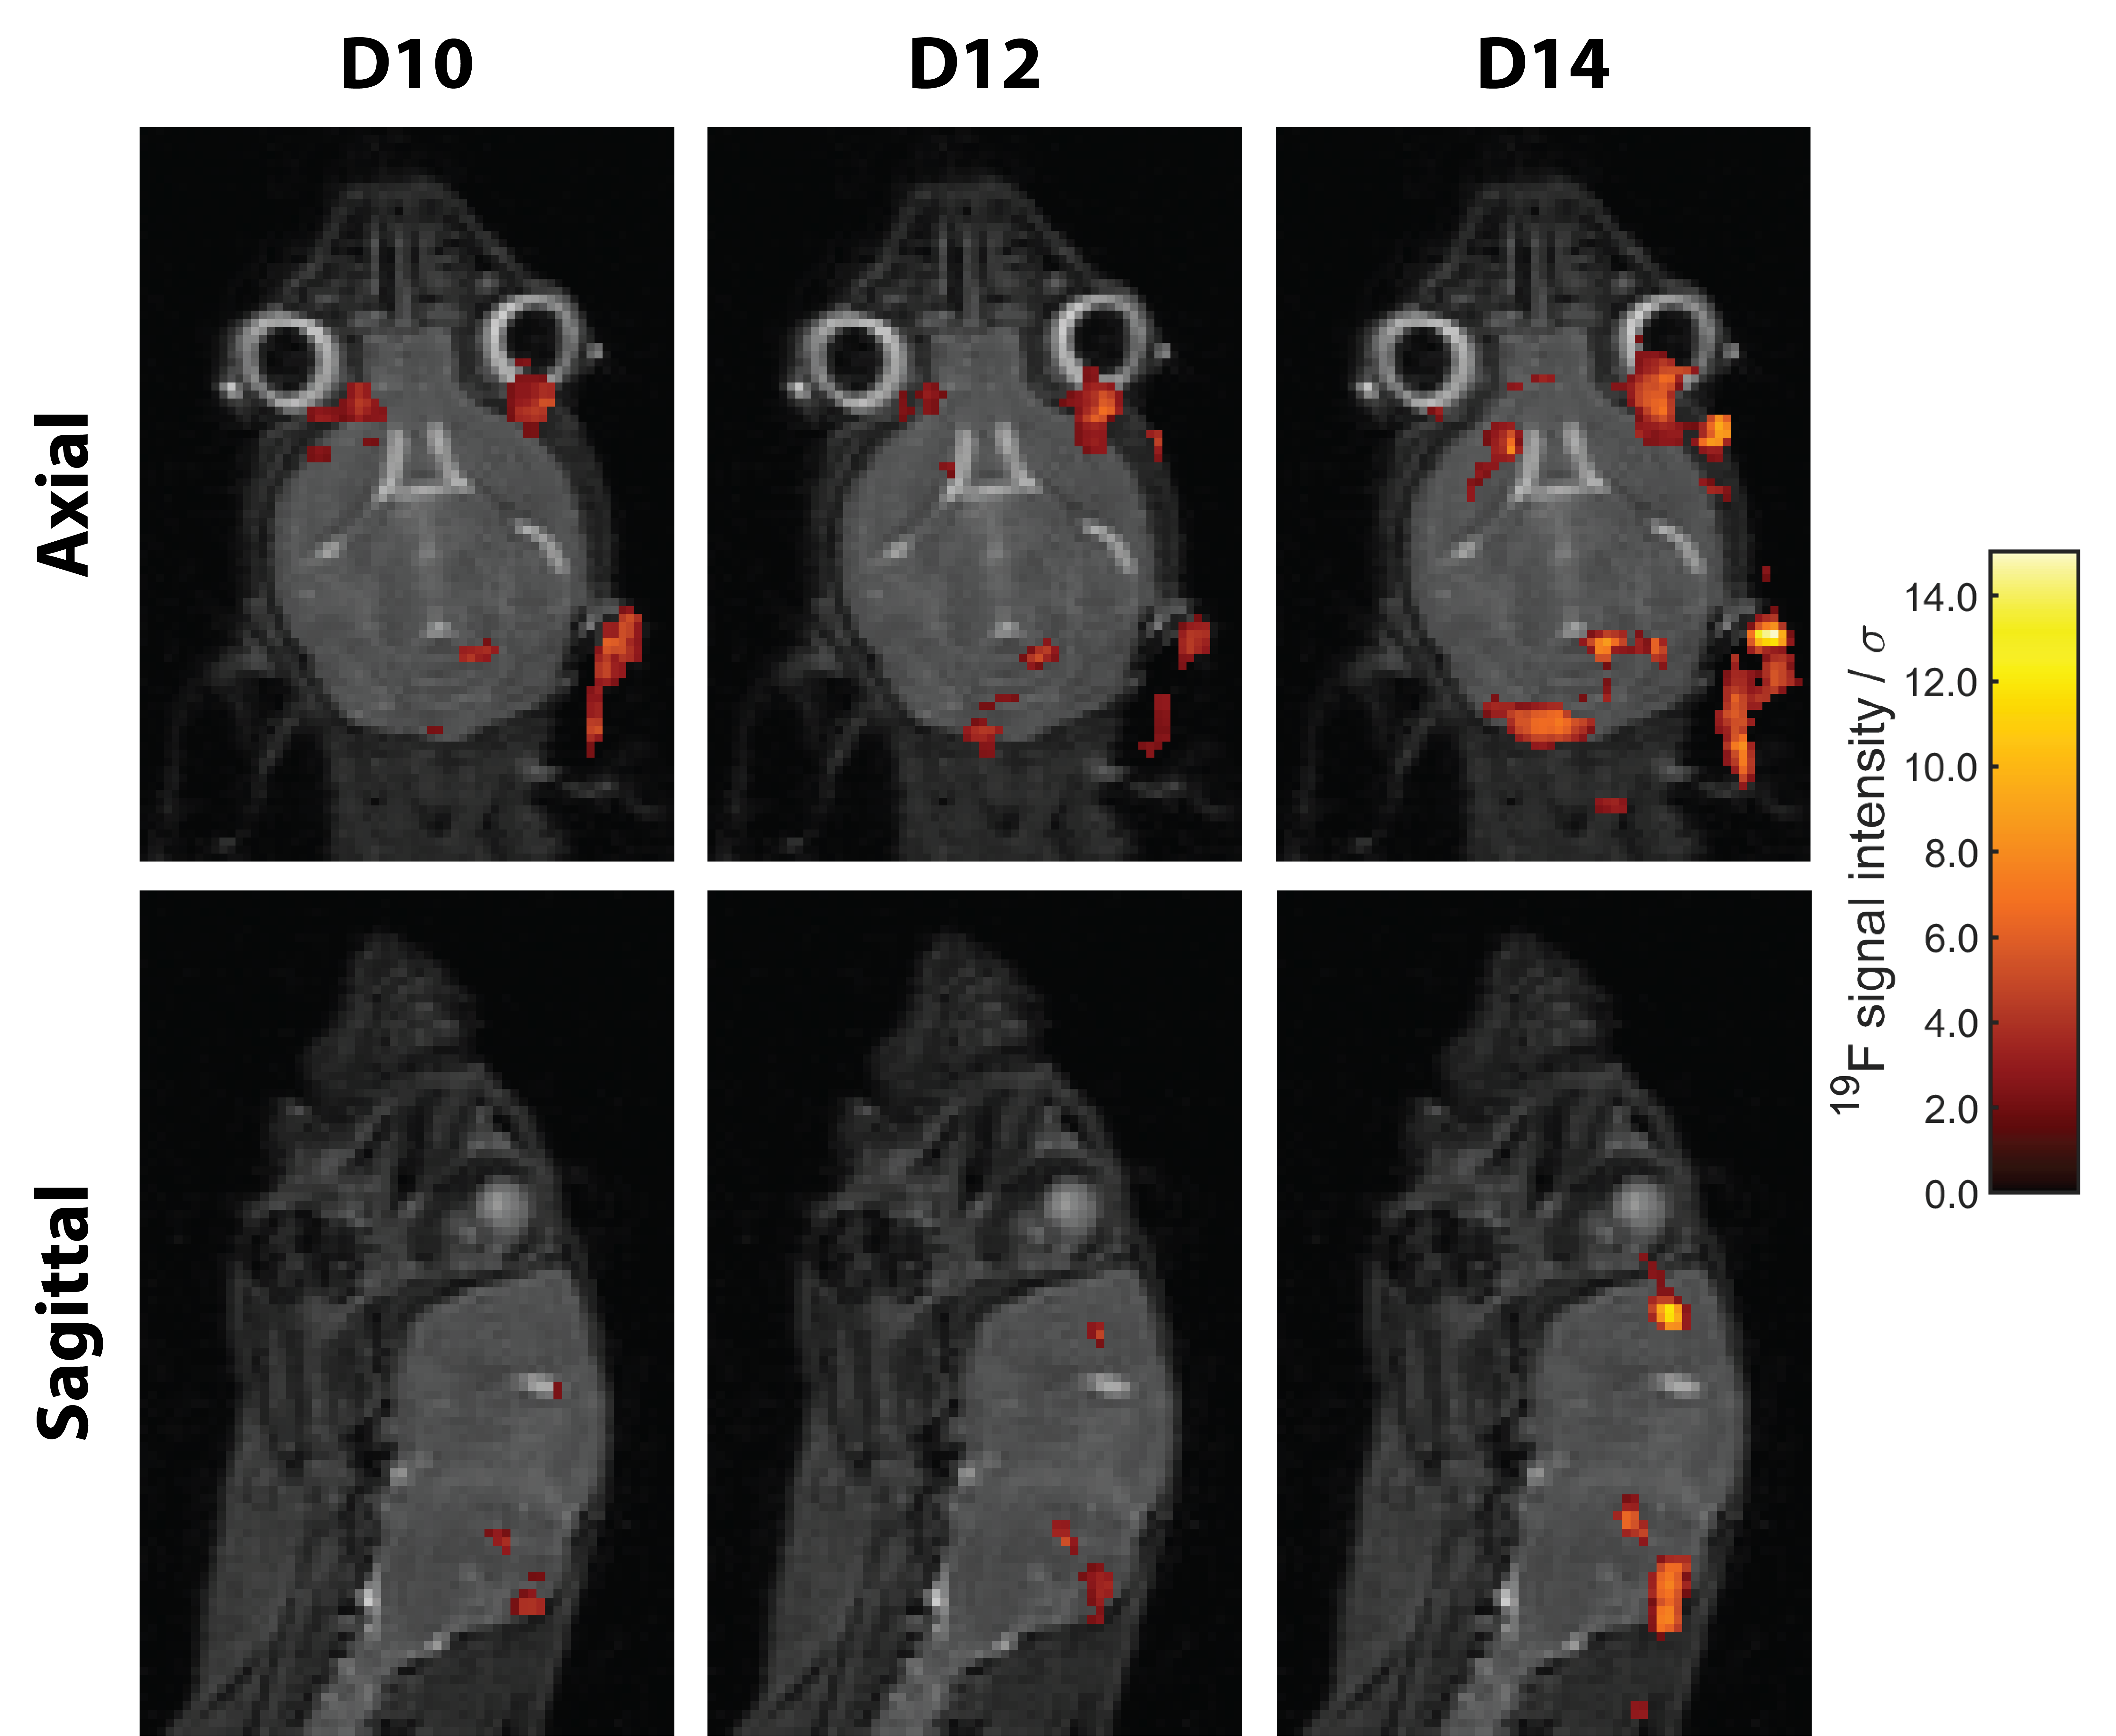
Significant inflammation was observed in the CNS of all mice already 10 days following EAE induction even in the absence of neurological symptoms (Fig. 3). In all four EAE mice a progressive growth of inflammatory lesions was observed, yet changes were much more pronounced in M1 and M2 (Fig. 3).Co-registration of the anatomical, and thereafter the 19F MR data allowed direct comparison of detected inflammatory signals in different regions of the brain. In M1, neuroinflammation is already present on D10 despite lacking neurological symptoms, hotspots are found in meningeal of cerebrum and cerebellum as well as in intracortical layers at the level of the corpus callosum (Fig. 4). Inflammation distributed to the olfactory bulb and optic nerve on consecutive days. (Fig. 4). A similar pathology was observed for M2, albeit a slower progression of inflammation compared to the development of neurological symptoms (Fig. 5). Despite data undersampling, highly detailed signals along the CNS vasculature are clearly resolved. Mostly the inflammation grows from lesions already detectable on D10, which subsequently increase in size and intensity (Fig. 4/5). The colocalization of these inflammation hotspots demonstrates the accuracy of registration between measurement days. While the average signal intensity (SI) of signal voxels did not deviate strongly between pre-registration and post-registration reconstruction (-3.9±3.4%), the change in the number of signal voxels was much more pronounced (-27±9%).
Discussion
We have shown that CS and a cryogenic surface RF probe can be combined to achieve sensitive high-resolution imaging. The comparatively short 19F MR acquisition time of ≈1h enables repeated measurement of animals on consecutive days and thus a longitudinal study design despite a challenging disease model. Compared to our previous EAE studies, we can gain more insights into the pathology with higher resolved 19F MRI.3,9 The resolved detail and effective workflow for co-registration over multiple days allows an in-depth study of disease progression.A next step towards quantitative analysis of the generated data must be segmentation into anatomical regions. Changes of the detected 19F signal volume due to the registration can be circumvented by performing the quantitative analysis on pre-registration images. Additional B1 inhomogeneity correction has been shown to be feasible, and will be essential to estimate accurate 19F concentrations.10
Conclusion
The results reveal the progressive development of inflammatory lesions and demonstrate the capability of 19F-MRI for detailed investigations of inflammatory processes. Leveraging recent developments in MR hardware and signal processing expands the range of feasible 19F-MRI applications. This will not only improve the preclinical study of neuroinflammation but can also enable future clinical applications. Finally, these advances can help to make 19F-MRI a reality for compounds which reach only very low concentrations, such as the imaging of fluorinated drugs.11,12Acknowledgements
This work was supported by funding from the Germany Research Council (DFG WA2804) and received funding in part (T.N., J.M.) from the European Research Council (ERC) under the European Union's Horizon 2020 research and innovation program under grant agreement No 743077 (ThermalMR). We also thank the MDC-Weizmann Helmholtz International Research School for Imaging and Data Science from the NAno to the MESo (iNAMES).References
1. Faber C, Schmid F. Pulse Sequence Considerations and Schemes in Fluorine Magnetic Resonance Imaging (ed. Flögel, U. and Ahrens, E.) 1–28. In: Pan Stanford Publishing; 2016.
2. Waiczies S, Millward JM, Starke L, et al. Enhanced Fluorine-19 MRI Sensitivity using a Cryogenic Radiofrequency Probe: Technical Developments and Ex Vivo Demonstration in a Mouse Model of Neuroinflammation. Scientific reports. 2017;7(1):9808.
3. Starke L, Pohlmann A, Prinz C, Niendorf T, Waiczies S. Performance of compressed sensing for fluorine-19 magnetic resonance imaging at low signal-to-noise ratio conditions. Magn Reson Med. 2020;84(2):592-608.
4. Goldstein T, O'Donoghue B, Setzer S, Baraniuk R. Fast alternating direction optimization methods. SIAM J Imag Sci. 2014;7(3):1588-1623.
5. Rudin LI, Osher S, Fatemi E. Nonlinear total variation based noise removal algorithms. Physica D. 1992;60(1-4):259-268.
6. Vainikko GM. The discrepancy principle for a class of regularization methods. USSR computational mathematics and mathematical physics. 1982;22(3):1-19.
7. Starke L, Niendorf T, Waiczies S. Data preparation protocol for low signal-to-noise ratio fluorine-19 MRI. Preclinical MRI of the Kidney. 2021:711.
8. Avants BB, Tustison N, Song G. Advanced normalization tools (ANTS). Insight j. 2009;2(365):1-35.
9. Waiczies H, Lepore S, Drechsler S, et al. Visualizing brain inflammation with a shingled-leg radio-frequency head probe for 19F/1H MRI. Scientific reports. 2013;3:1280.
10. Delgado PR, Kuehne A, Periquito JS, et al. B1 inhomogeneity correction of RARE MRI with transceive surface radiofrequency probes. Magnetic Resonance in Medicine. 2020;84(5):2684-2701.
11. Prinz C, Starke L, Millward JM, et al. In vivo detection of teriflunomide-derived fluorine signal during neuroinflammation using fluorine MR spectroscopy. Theranostics. 2021;11(6):2490.
12. Prinz C, Starke L, Ramspoth T-F, et al. Pentafluorosulfanyl (SF5) as a Superior 19F Magnetic Resonance Reporter Group: Signal Detection and Biological Activity of Teriflunomide Derivatives. ACS sensors. 2021.
Figures