0132
A method to increase the resolution of sodium images from simultaneous 1H MRF/23Na MRI1Center for Biomedical Imaging, Department of Radiology, New York University School of Medicine, New York, NY, United States, 2Vilcek Institute of Graduate Biomedical Sciences, NYU Langone Health, New York, NY, United States, 3Centre for Advanced Imaging, The University of Queensland, Brisbane, Australia, 4ARC Training Centre for Innovation in Biomedical Imaging Technology, The University of Queensland, Brisbane, Australia
Synopsis
In this work, we present an algorithm to generate a high-resolution 23Na image from simultaneously-acquired low-resolution 23Na density-weighted MRI (2.85×2.85×5 mm3) and high-resolution 1H density, T1, and T2 maps from MRF (1.5×1.5×5 mm3) in brain at 7 T. As a result, the mean value of the difference between the generated and ground truth high-resolution 23Na images is 0.5% with a standard deviation of 6.2% and multi-scale structural similarity index of 0.97.
Introduction
Sodium (23Na) MRI can reveal valuable metabolic information1. However, its low natural abundance in the human body and low gyromagnetic ratio practically prohibits the acquisition of high-resolution (HR) 23Na images. Therefore, we propose a post-processing method to generate a HR 23Na image from a low-resolution (LR) 23Na density-weighted image and simultaneously-acquired HR proton density (PD), T1, and T2 maps2, 3.Methods
Our proof-of-concept algorithm was demonstrated on images acquired at 7T (MAGNETOM, Siemens, Erlangen, Germany) using an in-house developed 16-channel-Tx/Rx dual-tuned head coil4. A single volunteer was scanned (female, 60 years old) after informed consent, in accordance with the relevant institutional and national guidelines.The 3D simultaneous 1H MRF/23Na MRI sequence parameters were: FOV 240×240×280 mm3,1H 160×160×56 / 23Na 84×84×56 matrix, 1H 1.5×1.5×5 mm3 / 23Na 2.85×2.85×5 mm3 resolution, 1H 7.5ms / 23Na 15ms TR, 30º constant FA for 23Na, pulse train of 500 FAs for 1H, 1 slab, 6 shots per slab, 1H full radial / 23Na center-out radial trajectories (stack-of-stars), total scan time 21 min. In addition, a ground truth HR 23Na image was acquired using a 3D radial GRE sequence, with the acquisition parameters carefully adjusted to match the LR 23Na image contrast (center-out stack-of-stars trajectory, 30º constant FA, 15 ms TR, FOV 240×240×280 mm3, 160×160×56 matrix, 1.5×1.5×5 mm3 resolution, 2 averages, and total scan time 42 min).
The core of our super-resolution algorithm was built around a partial least squares (PLS) regression between the HR (1H) images and the LR (23Na) image. Our algorithm was initially based on a statistical method that was implemented successfully for image fusion of mass spectrometry and microscopy data5, and was adapted and modified to our specific MR datasets. A conditional loop and additional layers were added to the algorithm to generate an optimal HR 23Na image.
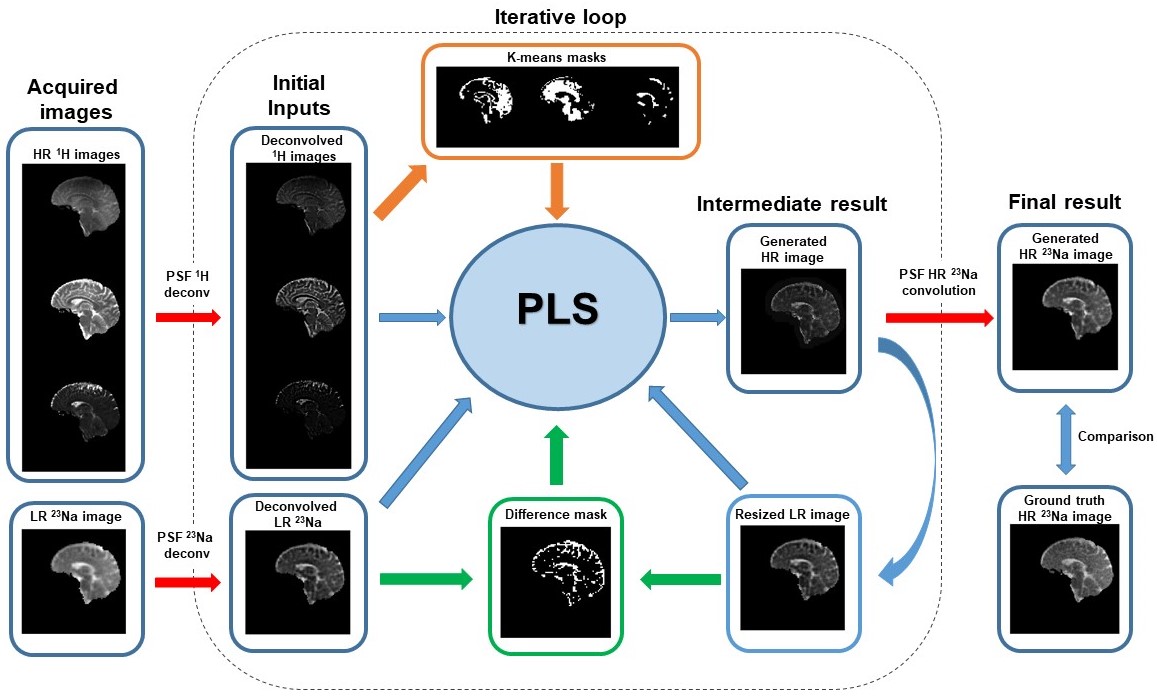
A schematic diagram of the proposed method is shown in Fig. 1. The algorithm steps are summarized below:
1) The 1H and 23Na acquired images are deconvolved by their respective point spread functions (PSF).
2) The deconvolved images are the input of the 1st PLS iteration and are called original deconvolved images (ODI).
3) The inputs of the next PLS iteration are the previous inputs plus a new set of data:
- For the LR data, the new data is the output of the previous PLS iteration (generated HR image) resized to the LR size.
- For the HR data, in the first iterations, the new data is obtained from the product of the ODI and k-means segmentation of the LR ODI (resized to the HR size). After all the clusters are included, the new dataset is generated from the product of the ODI and the differences between the LR ODI and the LR generated image.
4) The iterations continue this way until the mean value of the difference between the acquired and generated LR 23Na images is lower than 1%.
The number of the PLS components increases by one with each iteration. In this proof-of-concept work, the number of clusters for the k-means segmentation was chosen to be 3 for a healthy brain due to the number of tissues expected (grey matter, white matter, cerebrospinal fluid).
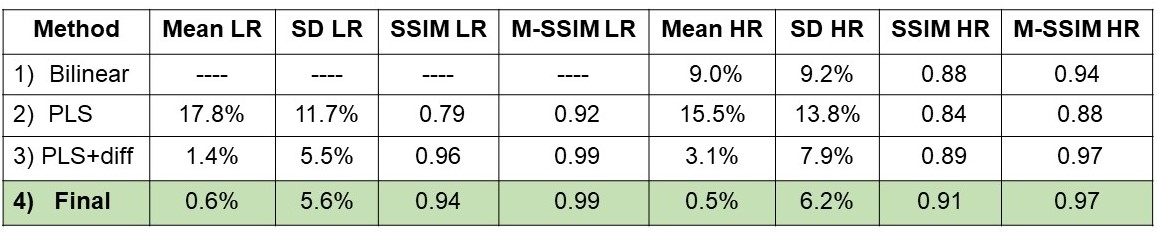
To evaluate the method, the generated HR 23Na was then calculated as the convolution between HR generated image and the PSF of HR 23Na. Then, the mean value and standard deviation of the difference between the acquired and generated LR and HR 23Na images, the structural similarity index6 (SSIM) and multi-scale-SSIM7 were calculated. These values were determined for HR 23Na images generated through different variations of the method: (1) bilinear resize (imresize function from MATLAB), (2) PLS (1 iteration without PSF deconvolution), (3) PLS+diff (20 iterations without PSF deconvolution), and (4) the final method as described above (20 iterations).
Data reconstruction and post-processing were performed in MATLAB (Mathworks, USA), using an Intel(R) system with a Xeon(R) Gold 6128 CPU 3.40GHz with a RAM memory of 32GB.
Results & Discussion
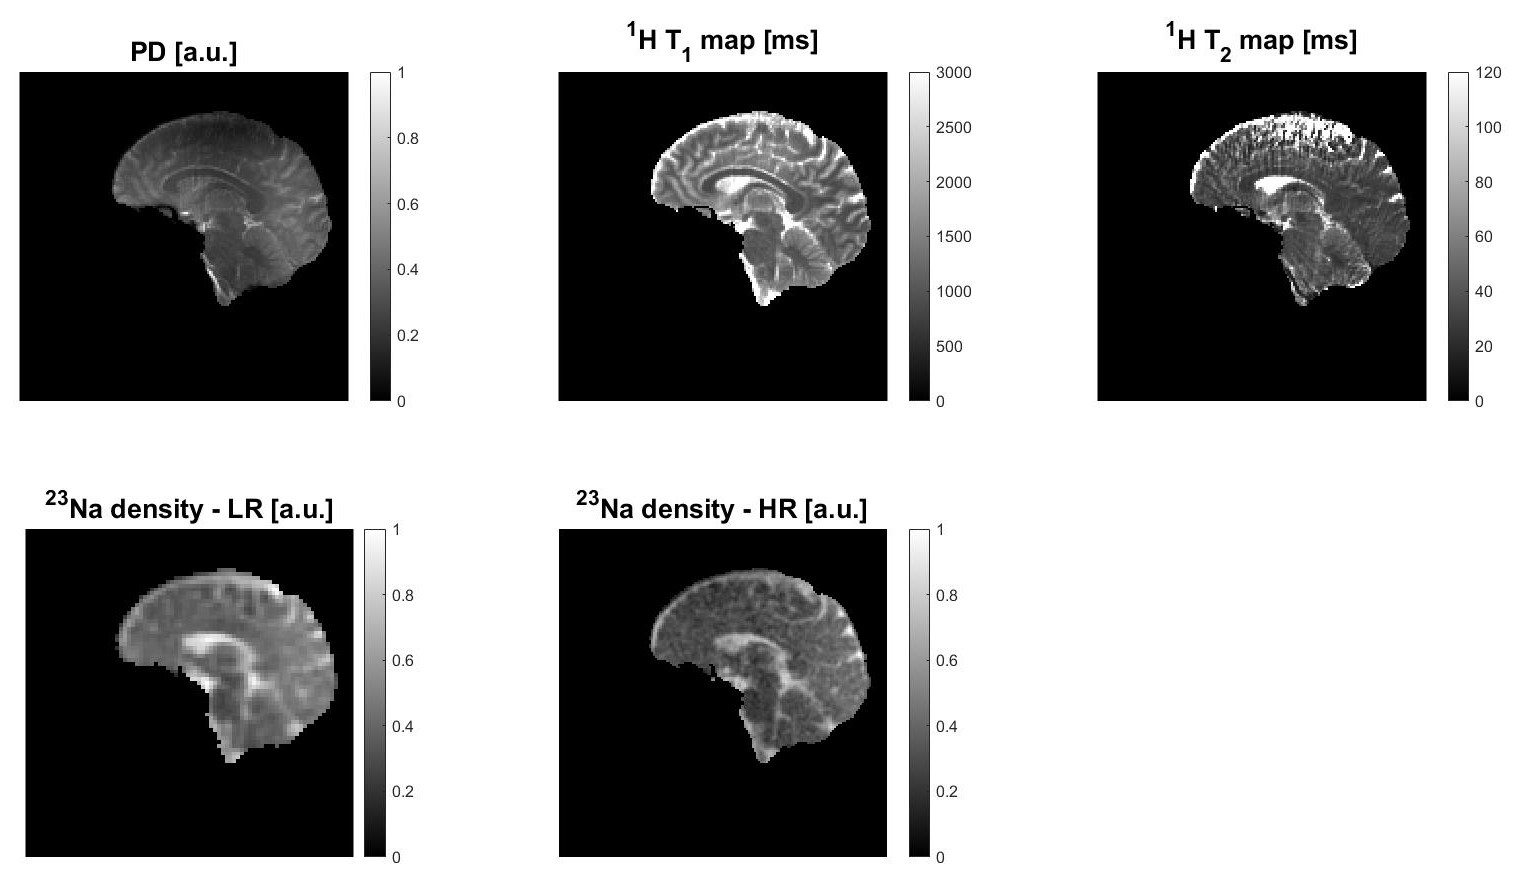
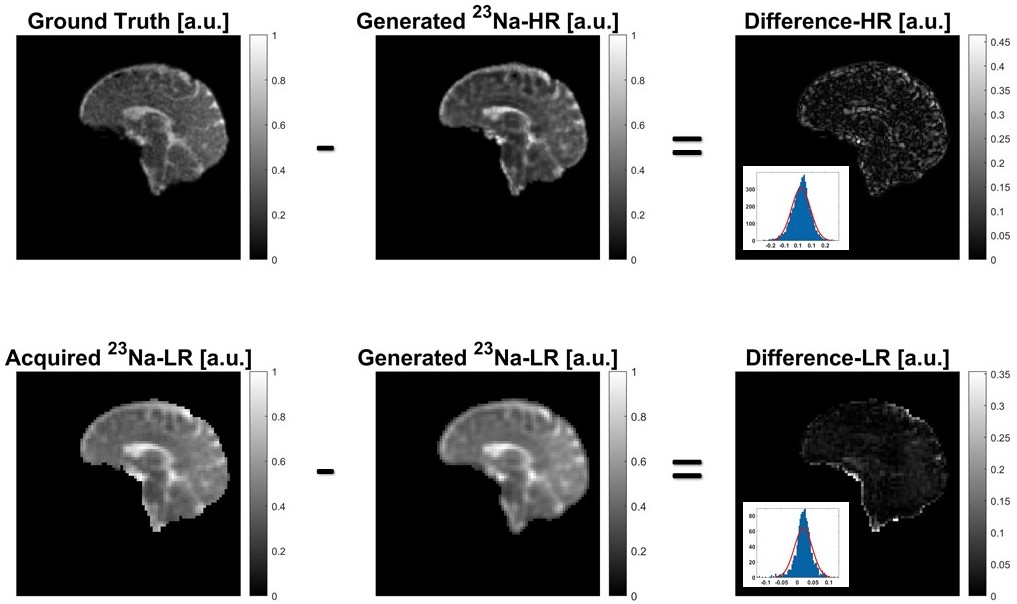
Fig. 2 shows the initial 1H and 23Na data acquired with 3D simultaneous 1H MRF/23Na MRI and the ground truth HR 23Na acquired with 3D radial GRE. Fig. 3 shows the acquired LR and HR (ground truth) 23Na images, the generated HR 23Na images, the generated LR 23Na from the generated 23Na HR image, and the differences between them for both LR and HR. The total run time of the method was 28.4 s for 20 iterations and one slice. Most of the differences between the LR and HR images were on the edges of the brain. Moreover, the difference distributions are Gaussian-like (see Fig.3), suggesting that we do not lose structural information.Table 1 shows the statistical parameters calculated for the different methods. The results demonstrate how each evolution of the algorithm contributes to minimize the differences. The final proposed method generated images with a mean difference smaller than 1% for both HR and LR 23Na acquired images.
Conclusion
We propose a novel method to generate an HR 23Na image from simultaneously-acquired LR 23Na density-weighted data, and HR 1H MRF data. The final HR sodium density-weighted image generated with this method shows high similarity to the HR sodium ground truth image (M-SSIM = 0.97).Acknowledgements
Acknowledgment: The research reported in this publication was supported by the NIH/NIBIB grant R01 EB026456, and performed under the rubric of the Center for Advanced Imaging Innovation and Research, a NIBIB Biomedical Technology Resource Center (P41 EB017183).References
1. Madelin G, & Regatte R R. Biomedical applications of sodium MRI in vivo. Journal of Magnetic Resonance Imaging, 2013;38:511-529.
2. Yu, Z., Madelin, G., Sodickson, D. K., & Cloos, M. A. Simultaneous proton magnetic resonance fingerprinting and sodium MRI. Mag. Res. in Med. ,2020, 83(6), 2232-2242.
3. Yu, Z., Dergahyova, O., Sodickson, D. K., Madelin, G., & Cloos, M. A. Optimized simultaneous 3D proton MRF and sodium MRI. 2021 ISMRM&SMRT virtual conference & exhibition.
4. Wang, B, Zhang, B., Yu, Z., Ianniello C., Lakshmanan K., Paska, J., Madelin, G., Cloos, M. & Brown, R.. A radially interleaved sodium and proton coil array for brain MRI at 7T. NMR Biomed. 2021, e4608.
5. Van de Plas, R.,Yang J., Spraggins J.& Caprioli R. M.. Image fusion of mass spectrometry and microscopy: a multimodality paradigm for molecular tissue mapping. Nat. Methods. 2014;12(4)366-372.
6. Wang, Z., Bovik, A.C., Sheikh, H.R.; Simoncelli, E.P. Image quality assessment: from error visibility to structural similarity. IEEE Trans. on Imag. Process. 2004;13(4),600–612.
7. Wang, Z., Simoncelli, E.P, Bovik, A.C.. Multiscale structural similarity for image quality assessment. IEEE Trans. on Imag. Process. The Thrity-Seventh Asilomar Conference on Signals, Systems & Computers, 2003,(2)1398-1402.
Figures