0131
Longitudinal 23Na MRI in mild traumatic brain injury1Center for Biomedical Imaging, Department of Radiology, New York University Grossman School of Medicine, New York, NY, United States, 2Department of Neurology, New York University Grossman School of Medicine, New York, NY, United States, 3Department of Rehabilitation Medicine, New York University Grossman School of Medicine, New York, NY, United States, 4Department of Psychiatry, New York University Grossman School of Medicine, New York, NY, United States, 5Ronald O. Perelman Department of Emergency Medicine, New York University Grossman School of Medicine, New York, NY, United States, 6Center for Advanced Imaging Innovation and Research, Department of Radiology, New York University Grossman School of Medicine, New York, NY, United States
Synopsis
In this longitudinal sodium MRI study, mild traumatic brain injury (mTBI) patients and controls were scanned at 3T. Linear regression analysis was used to calculate total sodium concentrations (TSC) in global grey and white matter (GM, WM). Patient GM TSC increased back to control levels at 3-month and 1-year follow-ups. Decreased GM and WM TSC measured at one month were associated with worse cognitive performance, but not worse symptomalogy, at the follow-up visits.
Introduction
Traumatic brain injury (TBI) is one of the main causes of neurological disability worldwide.1 Despite its low severity, mild TBI (mTBI) can cause physical, psychiatric, emotional and cognitive problems, which persist in 15-30% of patients.2 The biological correlates of these manifestations, however, are not detected on conventional CT and MRI.3 It is hypothesized that the pathological cascade of tissue damage in mTBI is set forth by a perturbation in ionic homeostasis.4 The Na+/K+-exchange pump can be affected by energy deficits due to mitochondrial dysfunction, and by diffuse axonal injury, the histopathological signature of TBI.5,6 In a prior study, 23Na MRI was proposed as a non-invasive method to assess ionic disturbances in mTBI7, where decreased total sodium concentration (TSC) in global grey matter (GM) and white matter (WM) differentiated functionally non-recovered patients from controls. Here, we quantify TSC longitudinally at two additional time points over one year. We use linear regression to calculate GM and WM TSC globally, to increase the signal-to-noise ratio and reduce partial volume effects.8 We tested the hypotheses that global TSC measured within one month after injury7: (i) can predict whether patients functionally recover from their injury; and (ii) correlate with clinical presentation and neuropsychological function at 3 months and 1 year after injury.Materials & Methods
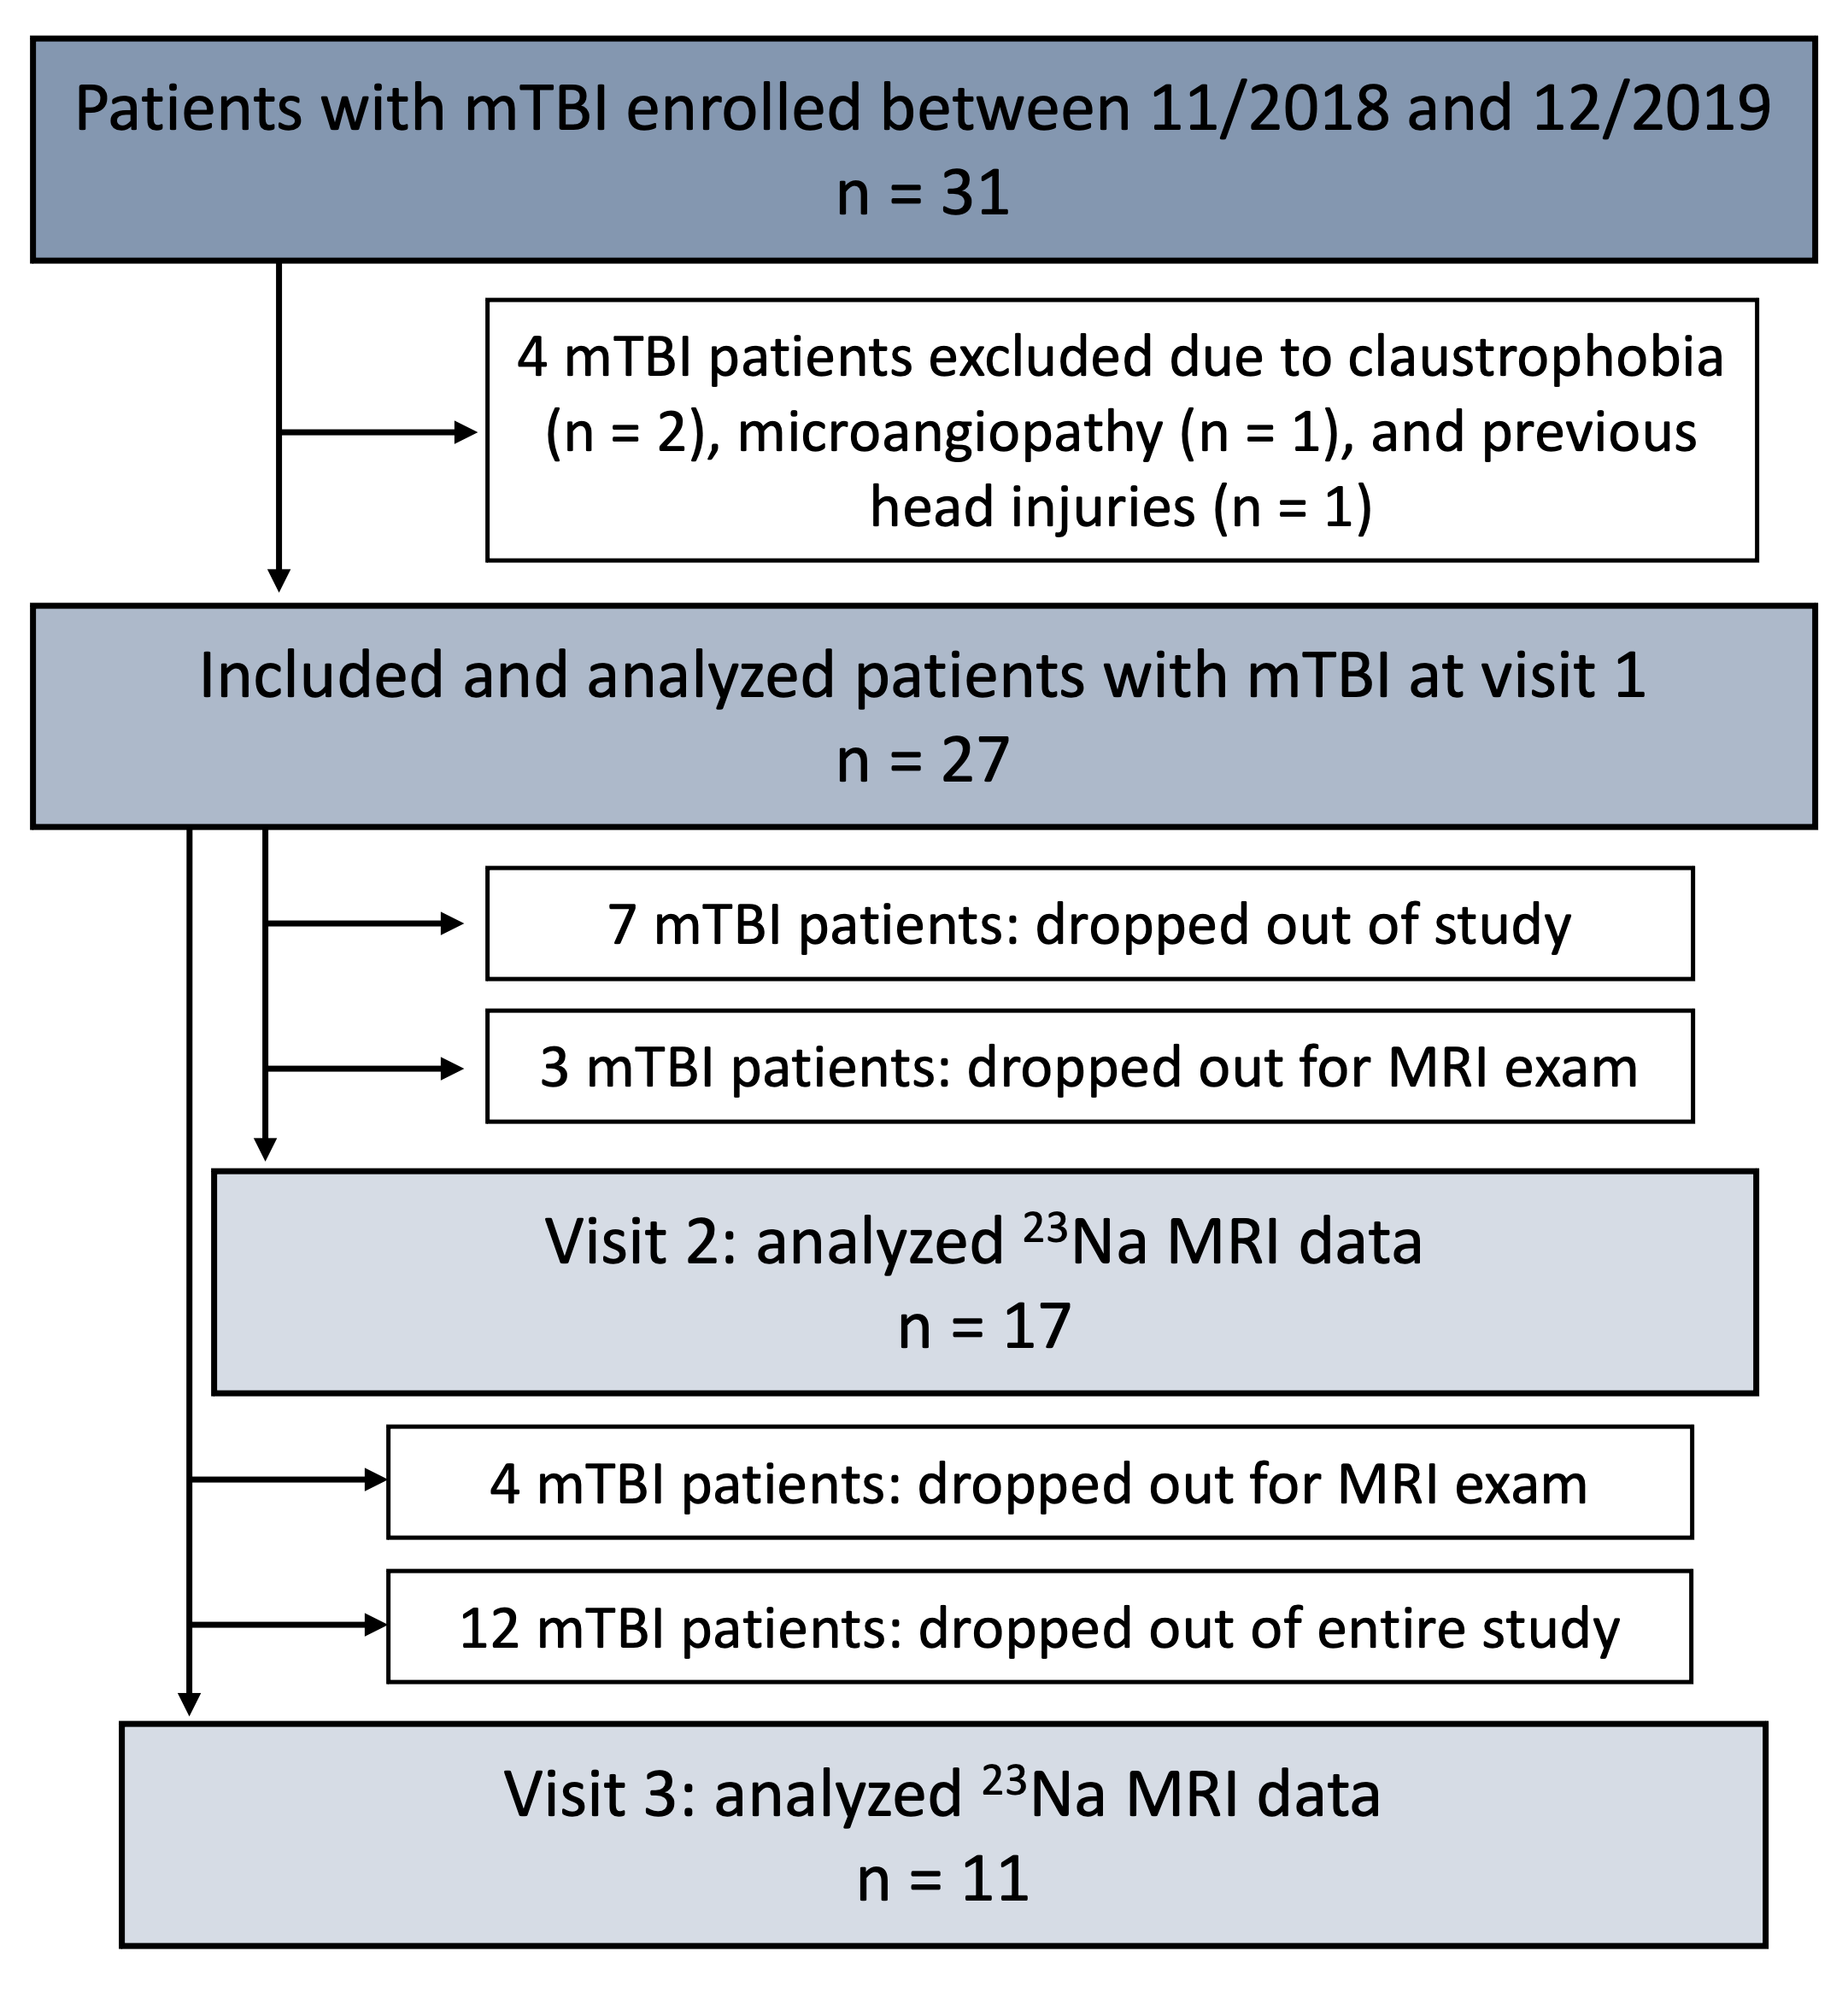
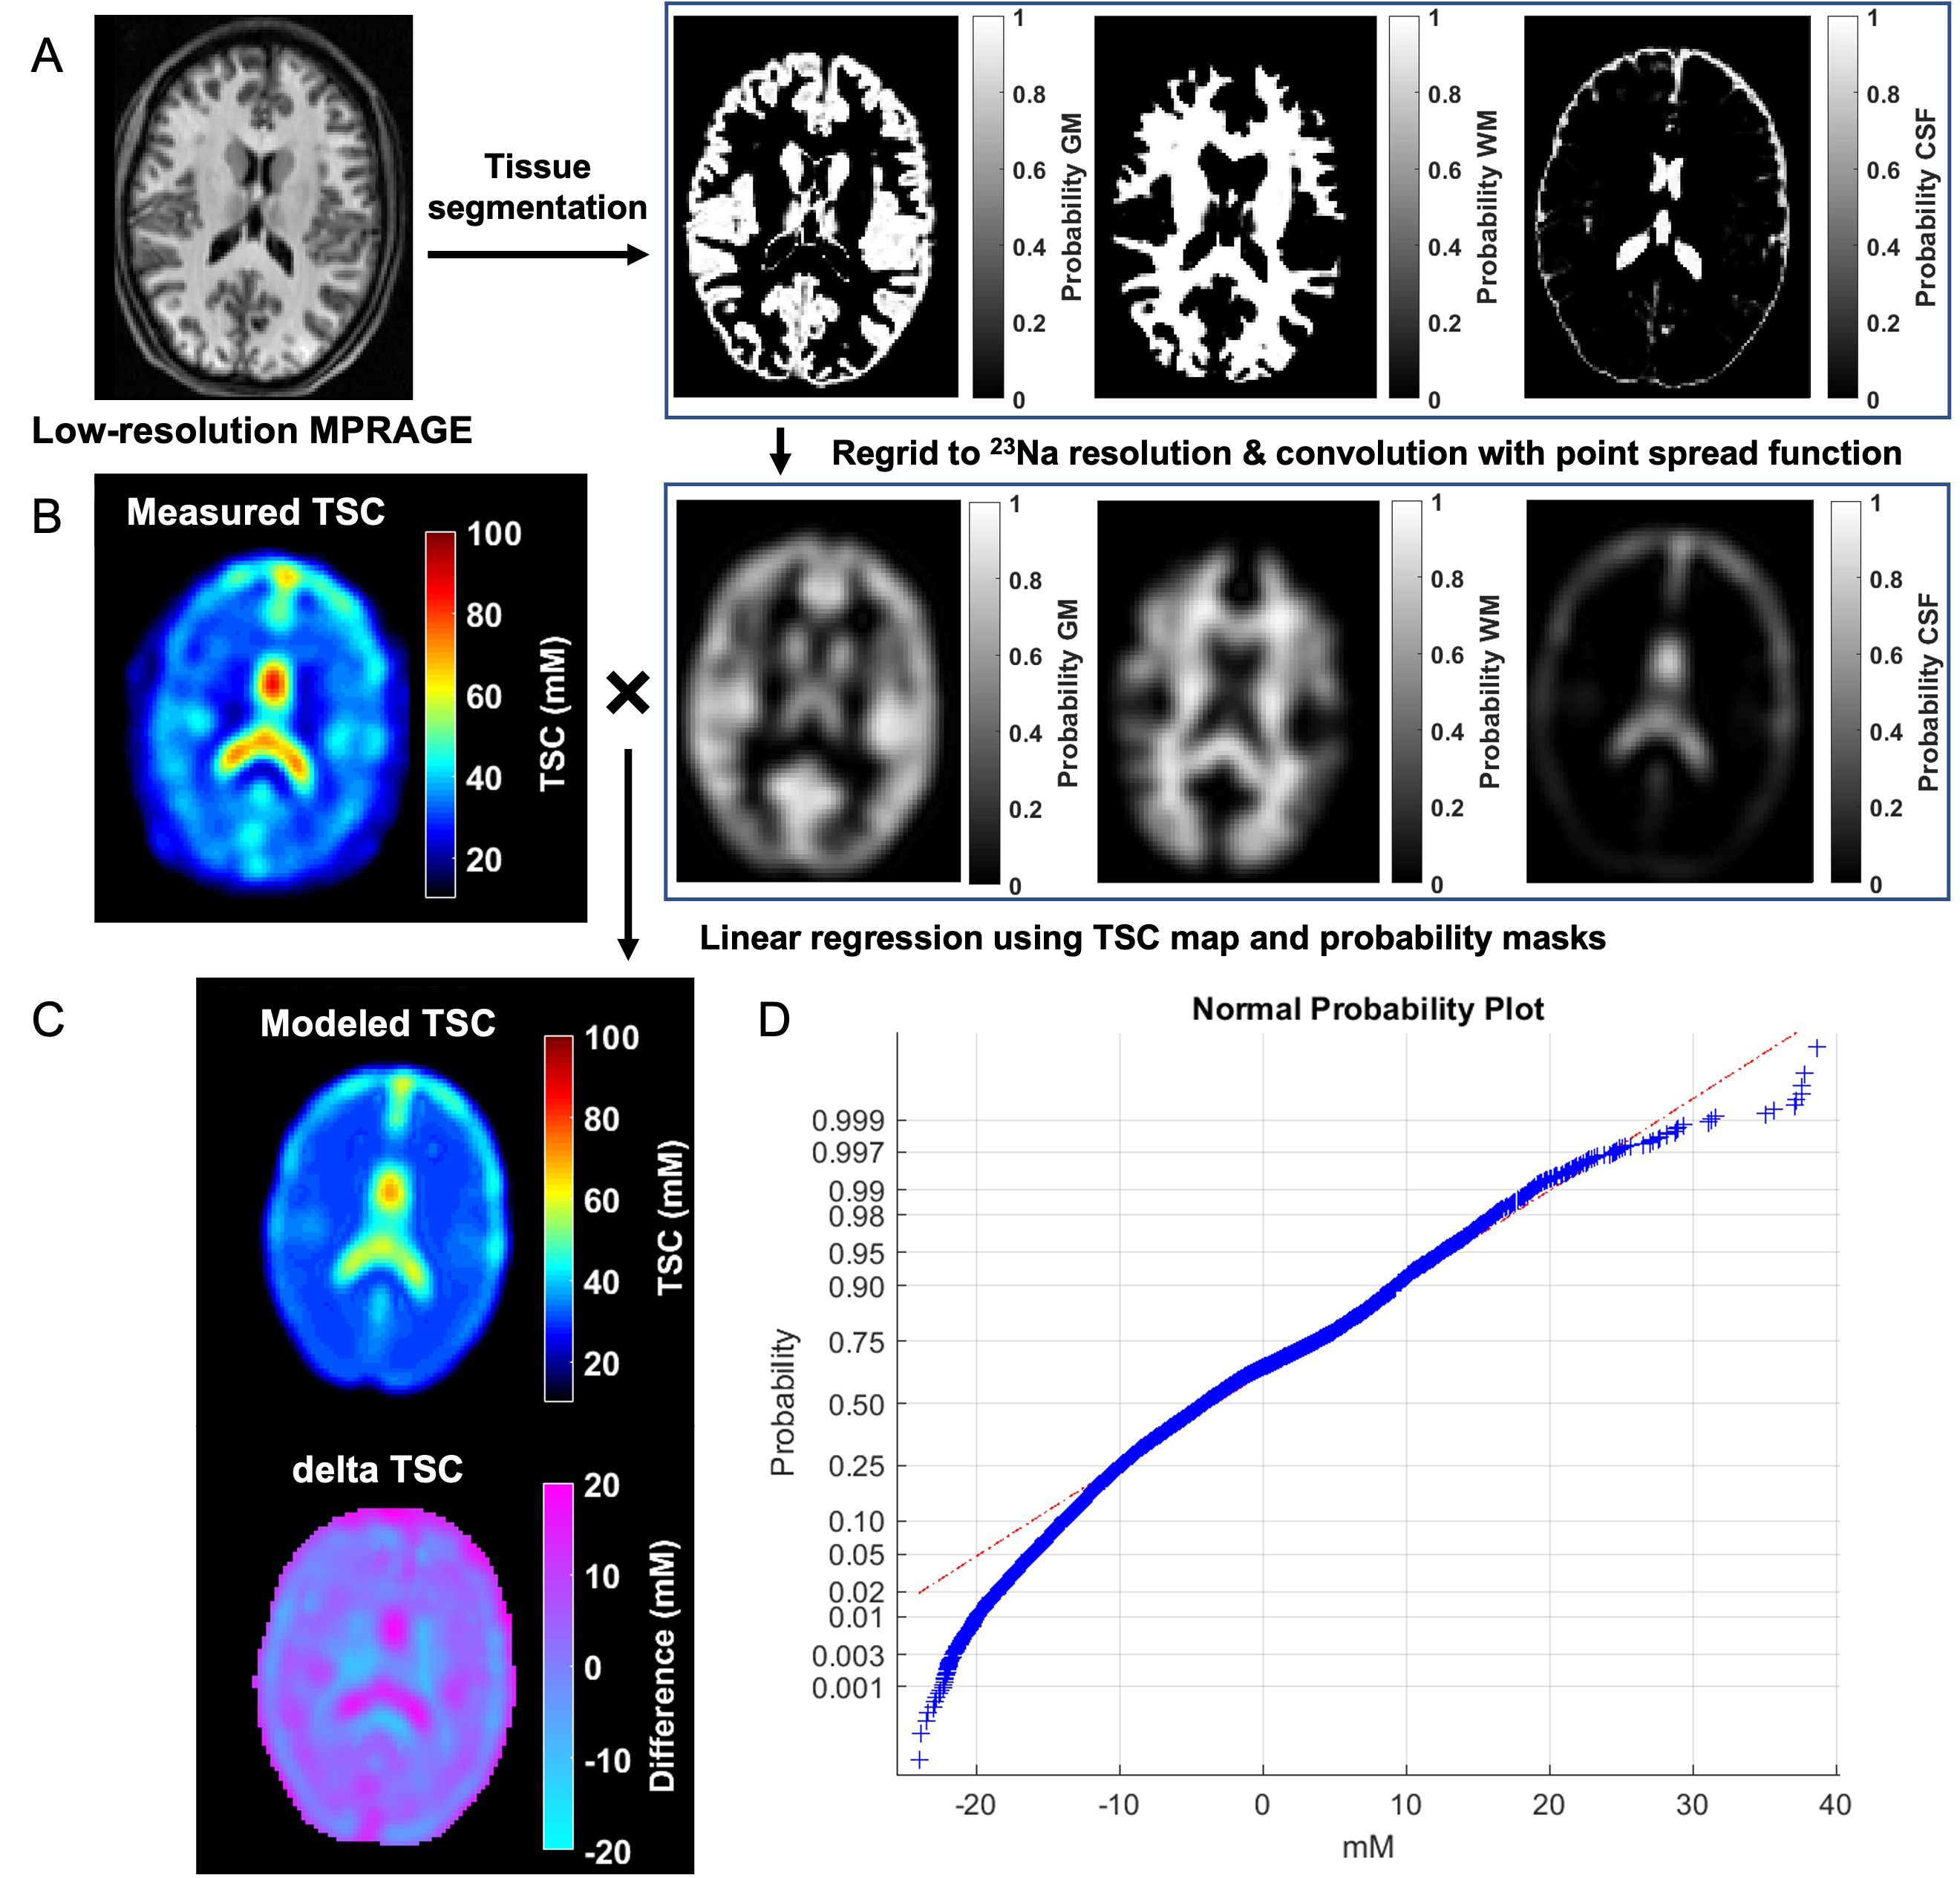
Twenty-seven patients (18-60 years old, 20 females) with confirmed mTBI and twenty-one age-matched healthy volunteers (23-62 years old, 14 females) were scanned on 3T (Magnetom Prisma, Siemens Healthcare, Erlangen, Germany). Patients were scanned at one month (visit 1, v1)7, three months (visit 2, v2), and one year (visit 3, v3) after injury (Fig.1). Controls were scanned once. A 20-channel head coil was used for qualitative 1H imaging.7 A radiologist examined the FLAIR and SWI images for evidence of parenchymal or extracerebral hemorrhage or features of diffuse or traumatic axonal injury, which were excluded for TSC quantification. 23Na imaging was performed using an in-house 1H/23Na developed double-tuned head coil. All 23Na images were acquired using a 3D FLORET sequence9 (TE=0.2 ms, TR=100 ms, 3 hubs at 45°, interleaves/hub=26, resolution=6 mm isotropic, 46 averages, TA=5:59 min). 23Na signals were calibrated using the signal from vitreous humor. Brain segmentation was performed using SPM12 (UCL, UK) from low-resolution MPRAGE data (TR/TE=2100/4.2 ms, voxel size=1.5x1.5x1.5 mm3, TA=3:49 min). Global TSC values in WM and GM were obtained with linear regression over all brain voxels (Fig.2) as previously reported.7All patients underwent clinical and neurocognitive testing which consisted of the Rivermead Post-Concussion Symptoms Questionnaire (RPQ)10, the Glasgow Outcome Scale-Extended (GOSE)11, and the Brief-Test-of-Adult-Cognition-by-Telephone (BTACT)12. Mann-Whitney (MW) test was used to compare TSC measurements between mTBI and controls, as well as to compare TSC at v1 in patients who showed recovery at follow-up visits (GOSE=8) with patients who did not (GOSE<8). Within-subject change among patients was examined with the matched-pair Wilcoxon signed-rank test. Spearman rank correlations assessed the associations between TSC at v1 and symptomatology (RPQ) and cognitive functioning (BTACT) during follow-up visits. Statistical significance was defined as p<0.05.
Results
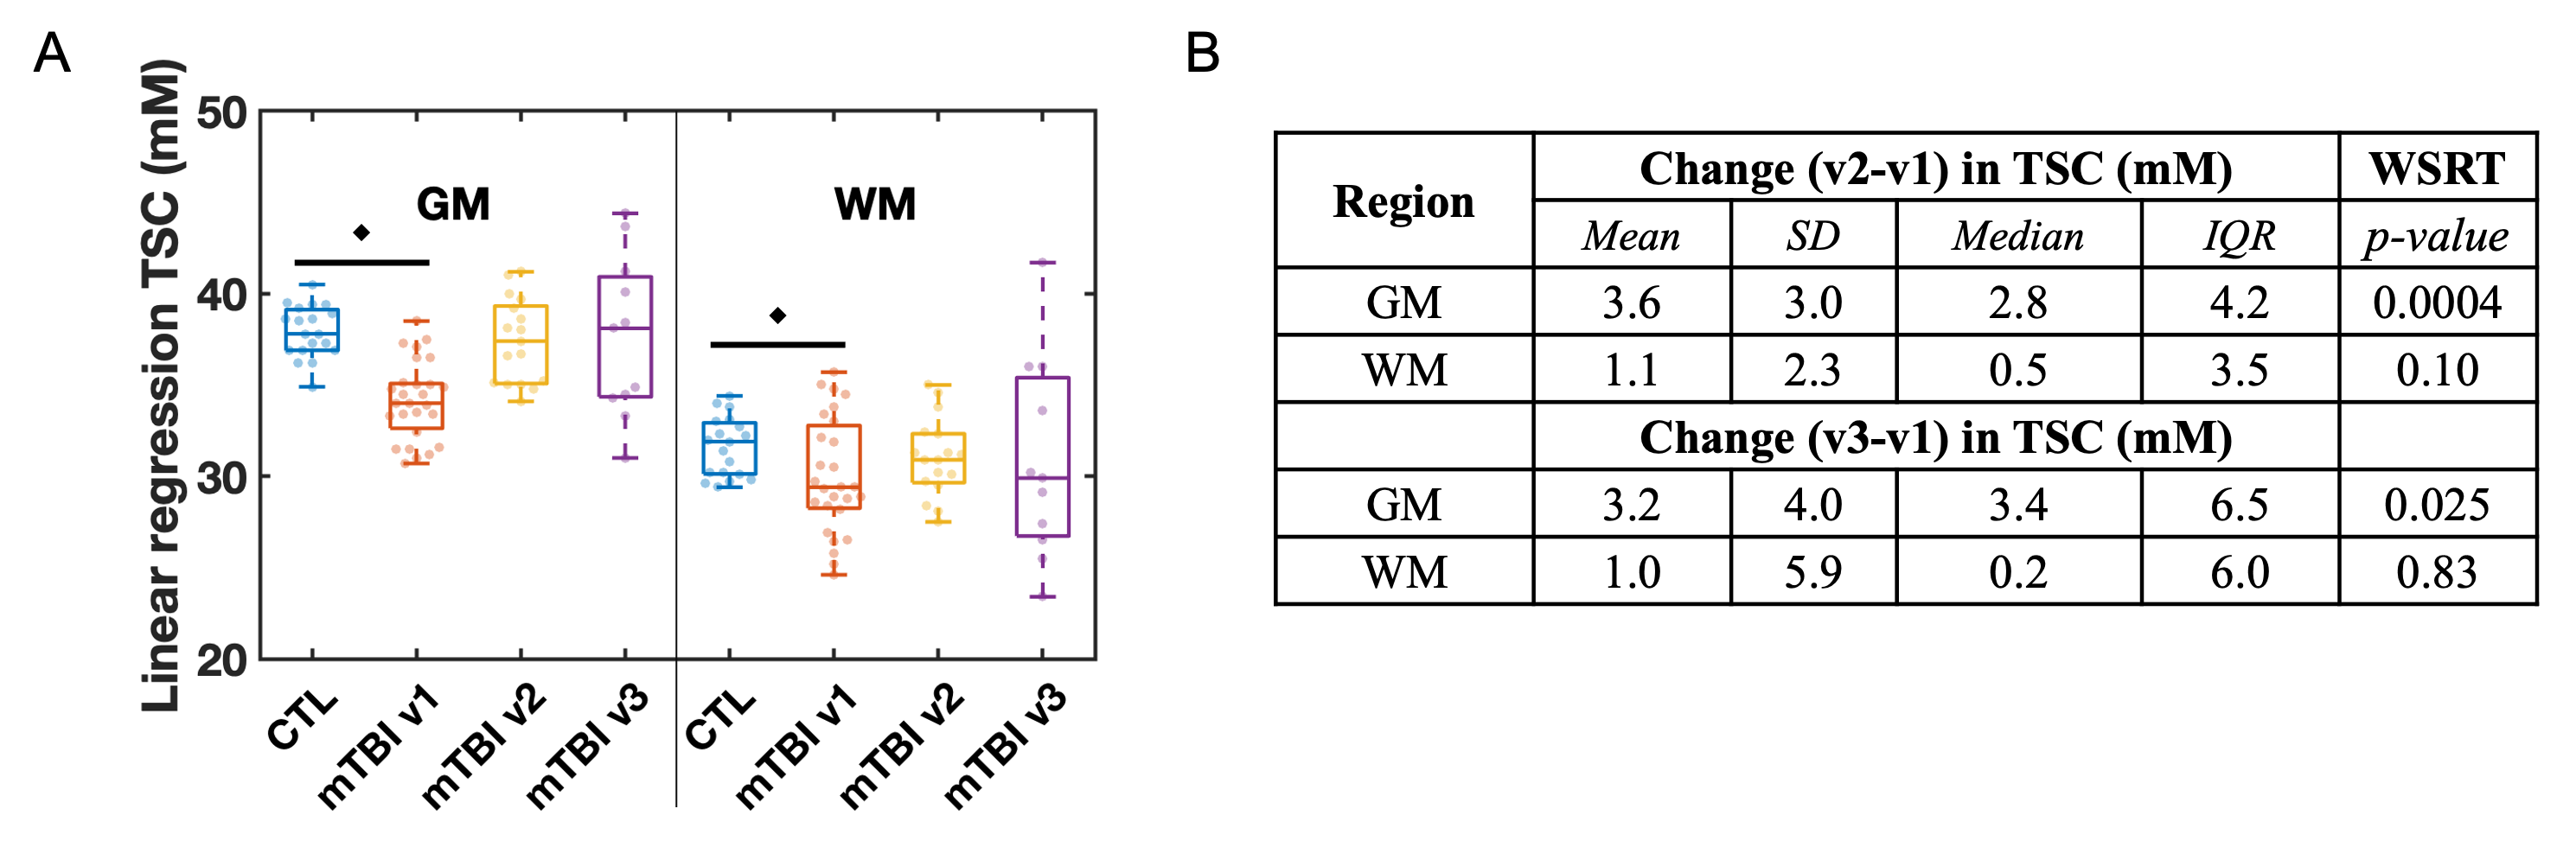
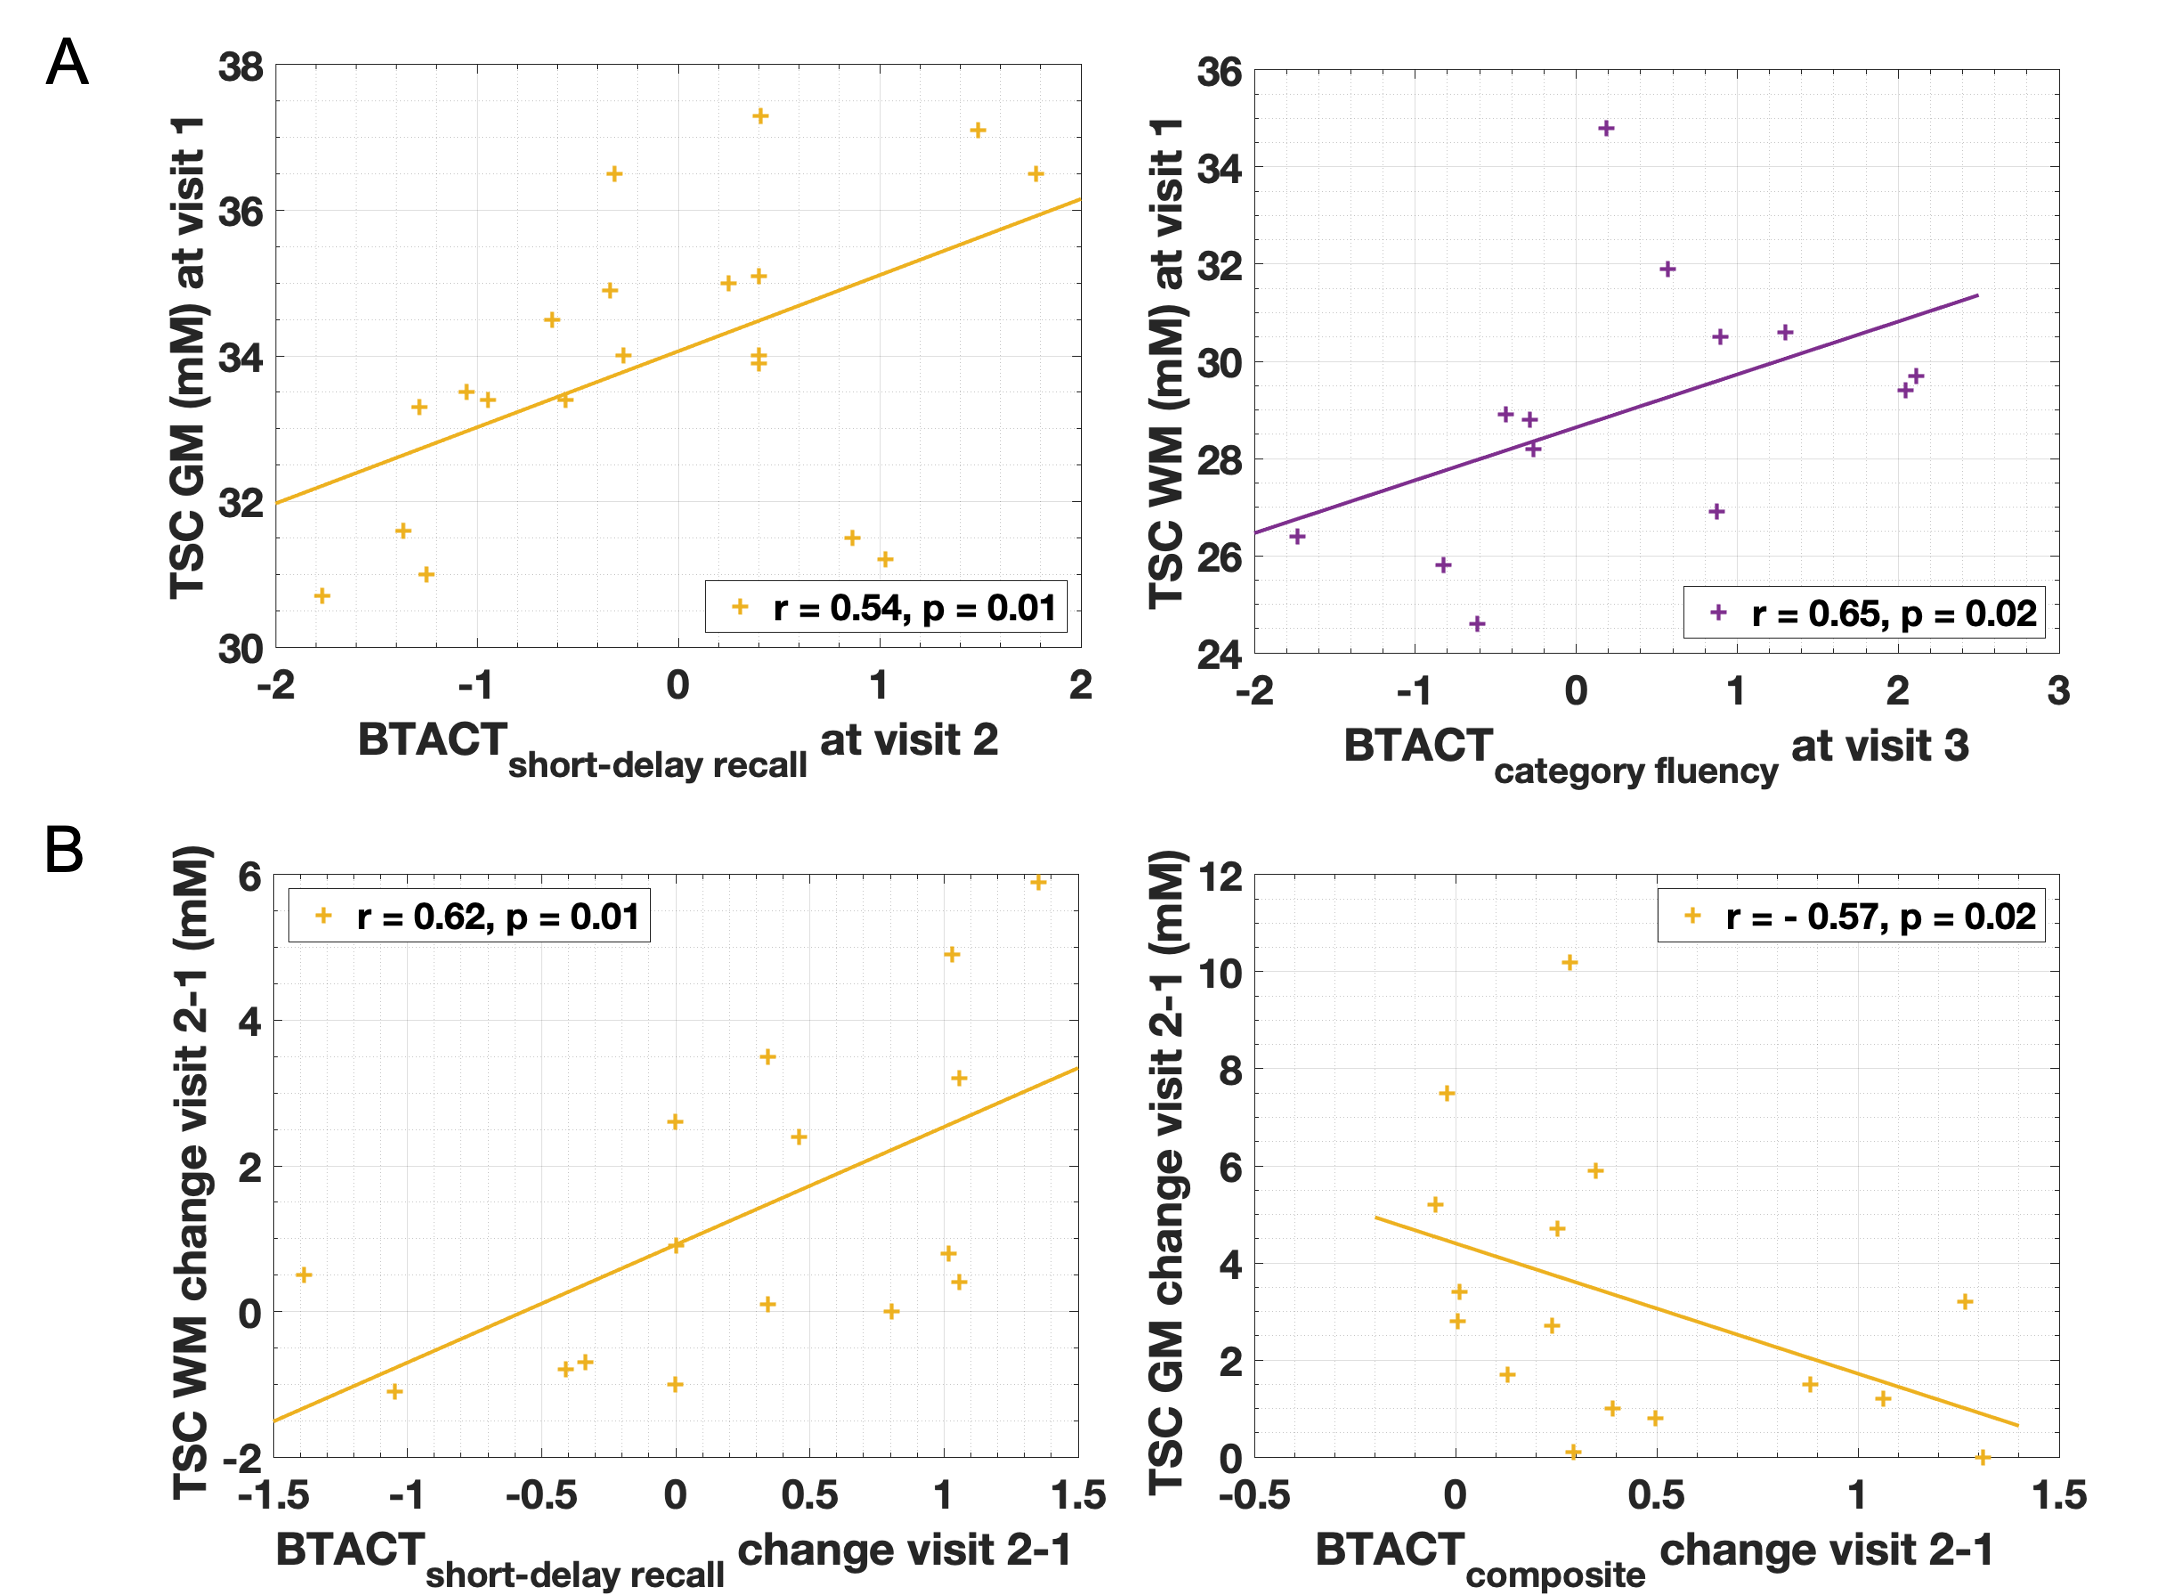
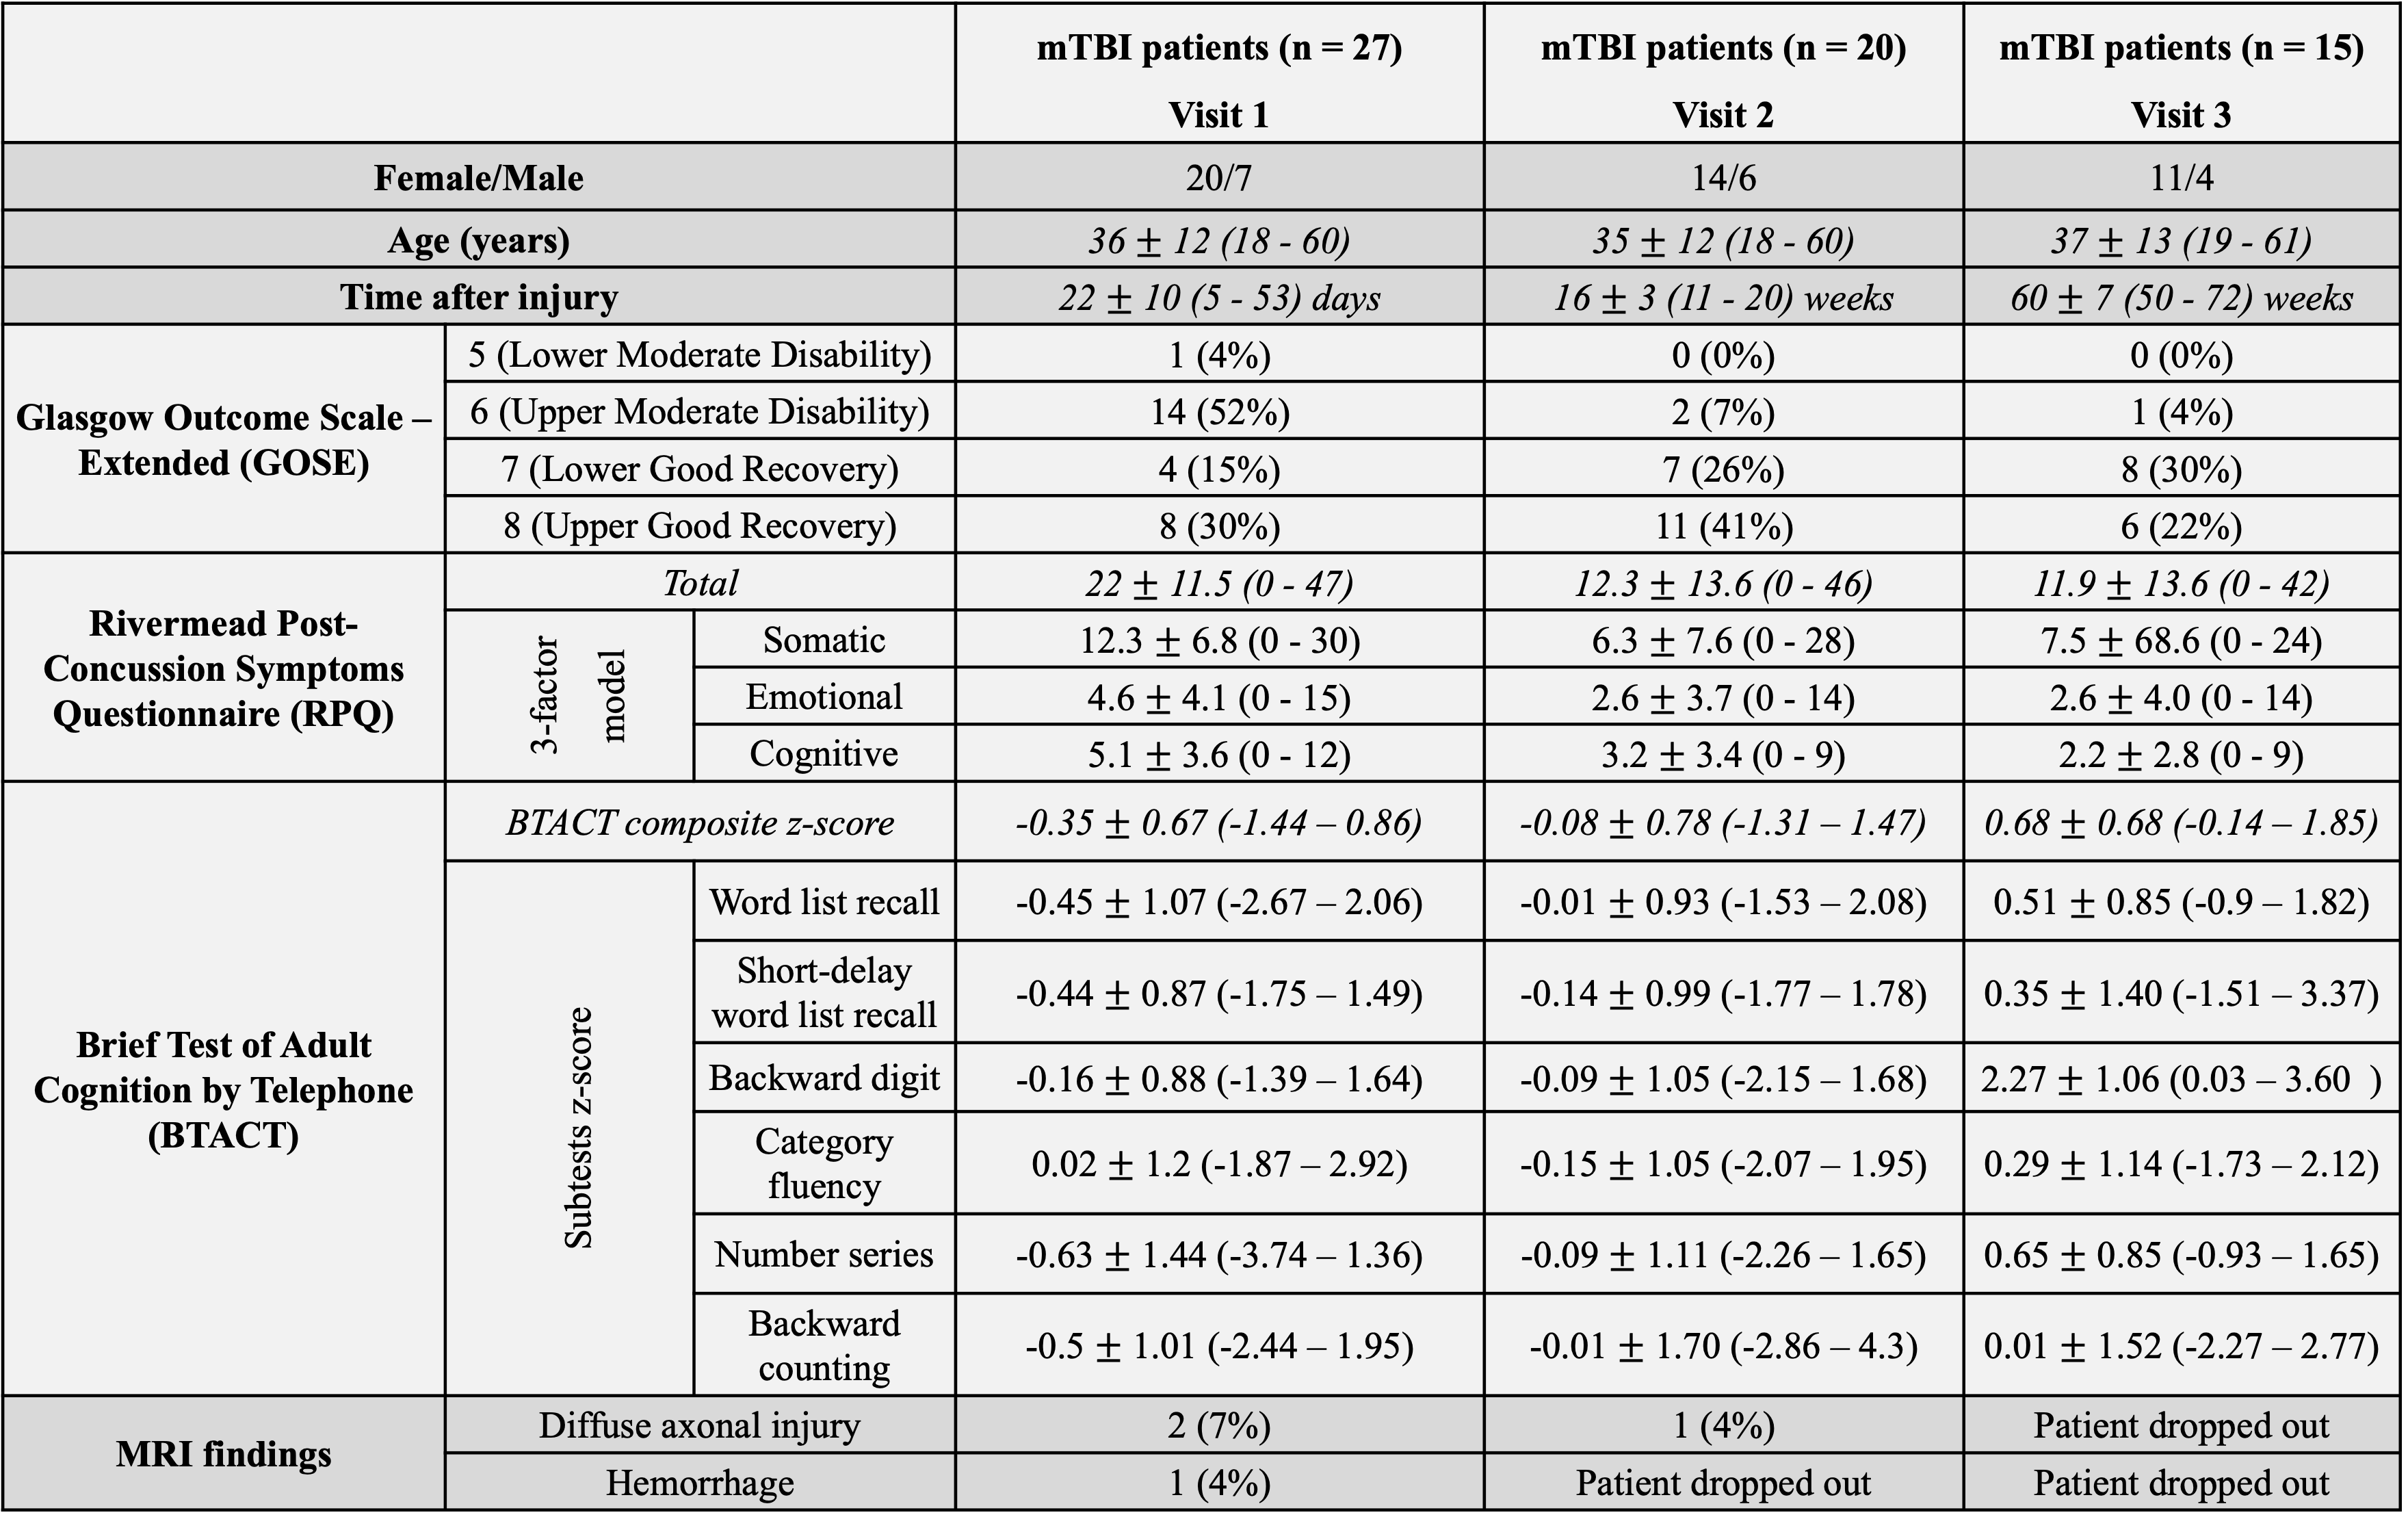
Demographics, clinical presentation, and cognitive testing results at each visit are compiled in Table 1. At v3 one year after injury, nine patients had not recovered from their injury. As previously reported, both GM and WM TSC were lower in mTBI at v1 than in controls.7 However, GM TSC values increased with time to control-level at v2 and v3 (Fig.3B). No increase was detected for WM TSC, but its levels were no longer reduced in patients compared to controls at v2 and v3 (Fig.3A). No group differences were observed in GM or WM TSC at v1 between recovered and non-recovered patients (based on GOSE stratification) at follow-up visits. GM and WM TSC at v1 correlated positively with BTACT sub-tests at follow-up visits (Fig.4A). No correlations were found for TSC at v1 and RPQ at follow-up. Changes in BTACT between v2 and v1 correlated with change in TSC over time (Fig.4B).Discussion & Conclusion
We conducted a longitudinal 23Na MRI study using linear regression quantification in GM and WM to test whether diffuse TSC reductions one month after mTBI7 are predictive of patients’ long-term outcome. No differences in GM and WM TSC were observed at 3 months and 1 year after injury, when compared to controls. GM TSC, however, increased with time, suggesting recovery to ionic homeostasis. WM TSC did not increase with time, but it was no longer significantly reduced at the follow-ups, suggesting either insufficient statistical power to observe an increase, or increase in the coefficient of variation (wider boxplots in Fig.3A). Lower TSC in mTBI in both tissue types at v1 correlated with future worse neuropsychological function, confirming the cross-sectional findings7 for a potential biomarker role for TSC. The initially observed GM an WM TSC decrease could be explained by cell swelling and sodium influx; a small increase in the intracellular volume can result in decreased TSC, even if the intracellular sodium concentration increases.7 The increase in GM TSC reported here might reflect the normalization of ionic balance and cell volume. These findings lay the groundwork for further studies aimed at understanding the pathophysiology of TBI from the standpoint of ionic balance.Acknowledgements
This work was supported by grants R01NS097494 and R01EB026456 from the National Institutes of Health (NIH).References
1. Dang, B., Chen, W., He, W. & Chen, G. Rehabilitation Treatment and Progress of Traumatic Brain Injury Dysfunction. Neural Plast. 2017, 1–6 (2017).
2. Maas, A. I. R. et al. Traumatic brain injury: integrated approaches to improve prevention, clinical care, and research. Lancet Neurol. 16, 987–1048 (2017).
3. Blennow, K. et al. Traumatic brain injuries. Nat. Rev. Dis. Prim. 2, 16084 (2016).
4. Povlishock, J. T. & Katz, D. I. Update of Neuropathology and Neurological Recovery After Traumatic Brain Injury. J. Head Trauma Rehabil. 20, 76–94 (2005).
5. Saraiva, A. L. L. et al. Creatine reduces oxidative stress markers but does not protect against seizure susceptibility after severe traumatic brain injury. Brain Res. Bull. 87, 180–186 (2012).
6. Lima, F. D. et al. Na+,K+-ATPase activity impairment after experimental traumatic brain injury: Relationship to spatial learning deficits and oxidative stress. Behav. Brain Res. 193, 306–310 (2008).
7. Gerhalter, T. et al. Global decrease in brain sodium concentration after mild traumatic brain injury. Brain Commun. 3, (2021).
8. Kim, S. et al. Voxel‐wise partial volume correction method for accurate estimation of tissue sodium concentration in 23 Na‐MRI at 7 T. NMR Biomed. 34, 1–14 (2021).
9. Pipe, J. G. et al. A new design and rationale for 3D orthogonally oversampled k-space trajectories. Magn. Reson. Med. 66, 1303–1311 (2011).
10. King, N. S., Crawford, S., Wenden, F. J., Moss, N. E. G. & Wade, D. T. The Rivermead Post Concussion Symptoms Questionnaire: a measure of symptoms commonly experienced after head injury and its reliability. J. Neurol. 242, 587–592 (1995).
11. Wilson, J. T., Pettigrew, L. E. & Teasdale, G. M. Structured interviews for the Glasgow Outcome Scale and the extended Glasgow Outcome Scale: guidelines for their use. J. Neurotrauma 15, 573–85 (1998).
12. Tun, P. A. & Lachman, M. E. Telephone assessment of cognitive function in adulthood: the Brief Test of Adult Cognition by Telephone. Age Ageing 35, 629–632 (2006).
Figures