0130
Observation of 2H labeled compounds in the human brain with 1H versus 2H magnetic resonance spectroscopy at 9.4T1Max Planck Institute for Biological Cybernetics, Tuebingen, Germany, 2IMPRS for Cognitive and Systems Neuroscience, Eberhard-Karls University of Tuebingen, Tuebingen, Germany, 3Advanced Imaging Research Center, UT Southwestern Medical Center, Dallas, TX, United States
Synopsis
The tracing of glucose metabolism is of interest in many pathologies of the human brain. In this abstract, we compare the information content of 2H MRSI detected deuterium metabolic imaging (DMI) to quantitative exchanged-labeled turnover 1H MRS (QELT), both measured at B0 = 9.4 Tesla. An uptake of 2H labeling was detectable for different metabolites for both methods. Consistent changes in 2H labeled Glx after the oral administration of [6,6’-2H2]-glucose were detected in the brain of healthy human subjects.
Purpose:
Presenting first human brain QELT data at 9.4T and comparison to DMI dataIntroduction:
Quantitative exchanged-label turnover 1H magnetic resonance spectroscopy (QELT) is a recently presented technique by Rich et al.1. Similar to 2H magnetic resonance spectroscopic imaging (MRSI) based Deuterium Metabolic Imaging (DMI)2, it can be used to track the incorporation of 2H labeling of deuterated tracers into downstream metabolites to investigate metabolic pathways in vivo. While DMI detects 2H directly, QELT uses the indirect effect of 2H labeling on spectral pattern in 1H magnetic resonance spectroscopy due to the replacement of protons by deuterium nuclei. Due to the higher gyromagnetic ratio of protons, the experimental SNR of 1H based QELT is higher compared to 2H MRS/DMI. Experimentally, different resonances are detectable with both methods. Using DMI, deuterated water, glucose (Glc), glutamate/glutamine (Glx) and lactate (Lac) are detectable2-4. With QELT, the different resonances of deuterated and protonated glutamate (Glu) and glutamine (Gln) are distinguishable.In this abstract, first QELT experiments acquired at the brain of healthy human volunteers are presented after the oral administration of [6,6’-2H2]-glucose at 9.4T. The 2H label uptakes measured with 1H detection based QELT were compared to recently reported 2H detection based DMI experiments in the same healthy volunteers at 9.4T4.
Methods:
All experiments were performed using a 9.4T Magnetom whole-body MRI scanner (Siemens Healthineers, Erlangen, Germany). All in vivo experiments were approved by the local ethics committee and performed after informed written consent. The DMI and QELT measurements for all volunteers (n=6, female: 3, average age: 28.7) were performed on two separate days and after 9h of overnight fasting. For each session, each of the volunteers orally consumed 0.75 g/kg body weight of [6,6’-2H2]-glucose.DMI experiments were performed with a dual-tuned phased array head coil using a Hanning weighted Ernst angle 2H MRSI sequence (FoV 180x200x180 mm3, matrix size 12x13x14, TR=155 ms, av=11, TAcq = 10 min)4. A reference 2H MRSI data set as well as anatomical MP2RAGE images were acquired before the oral administration of the 2H labeled glucose. Twelve DMI measurements were acquired after the intake of 2H labeled glucose in each of the six volunteers. The reconstruction and post-processing of the MRSI data was identical to Ruhm el al.4. Data evaluation was performed using a self-implemented version of the AMARES algorithm5 in Matlab (R2018a).
The QELT experiments were performed with a half-volume proton coil6 using a single voxel 1H MC-semiLASER sequence (TE=24 ms, TR=5s, av=64, voxel size 15x18x20 mm3, TAcq = 5:40 min)7. Reference measurements and anatomical FLASH images were acquired before the intake of 2H-labeled glucose. Sixteen SV 1H MRS measurements were acquired after the intake of 2H labeled glucose in each of the six volunteers. Data post-processing was performed in Matlab (R2018) and spectral fitting with LCModel (V6.3-1L)8.
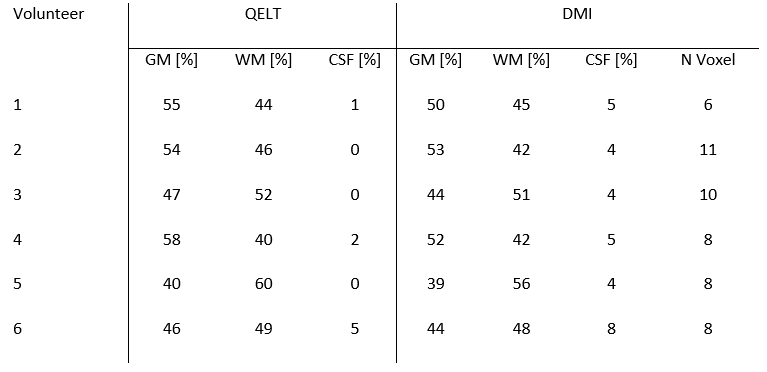
Using the anatomical MP2RAGE images, tissue fractions were calculated for each DMI and QELT voxel using SPM129 and an in-house implemented Python script. Using the tissue fractions, DMI voxels with the same tissue composition as the QELT voxel were averaged for each volunteer. The corresponding tissue fractions are presented in Tab. 1.
Results and discussion:
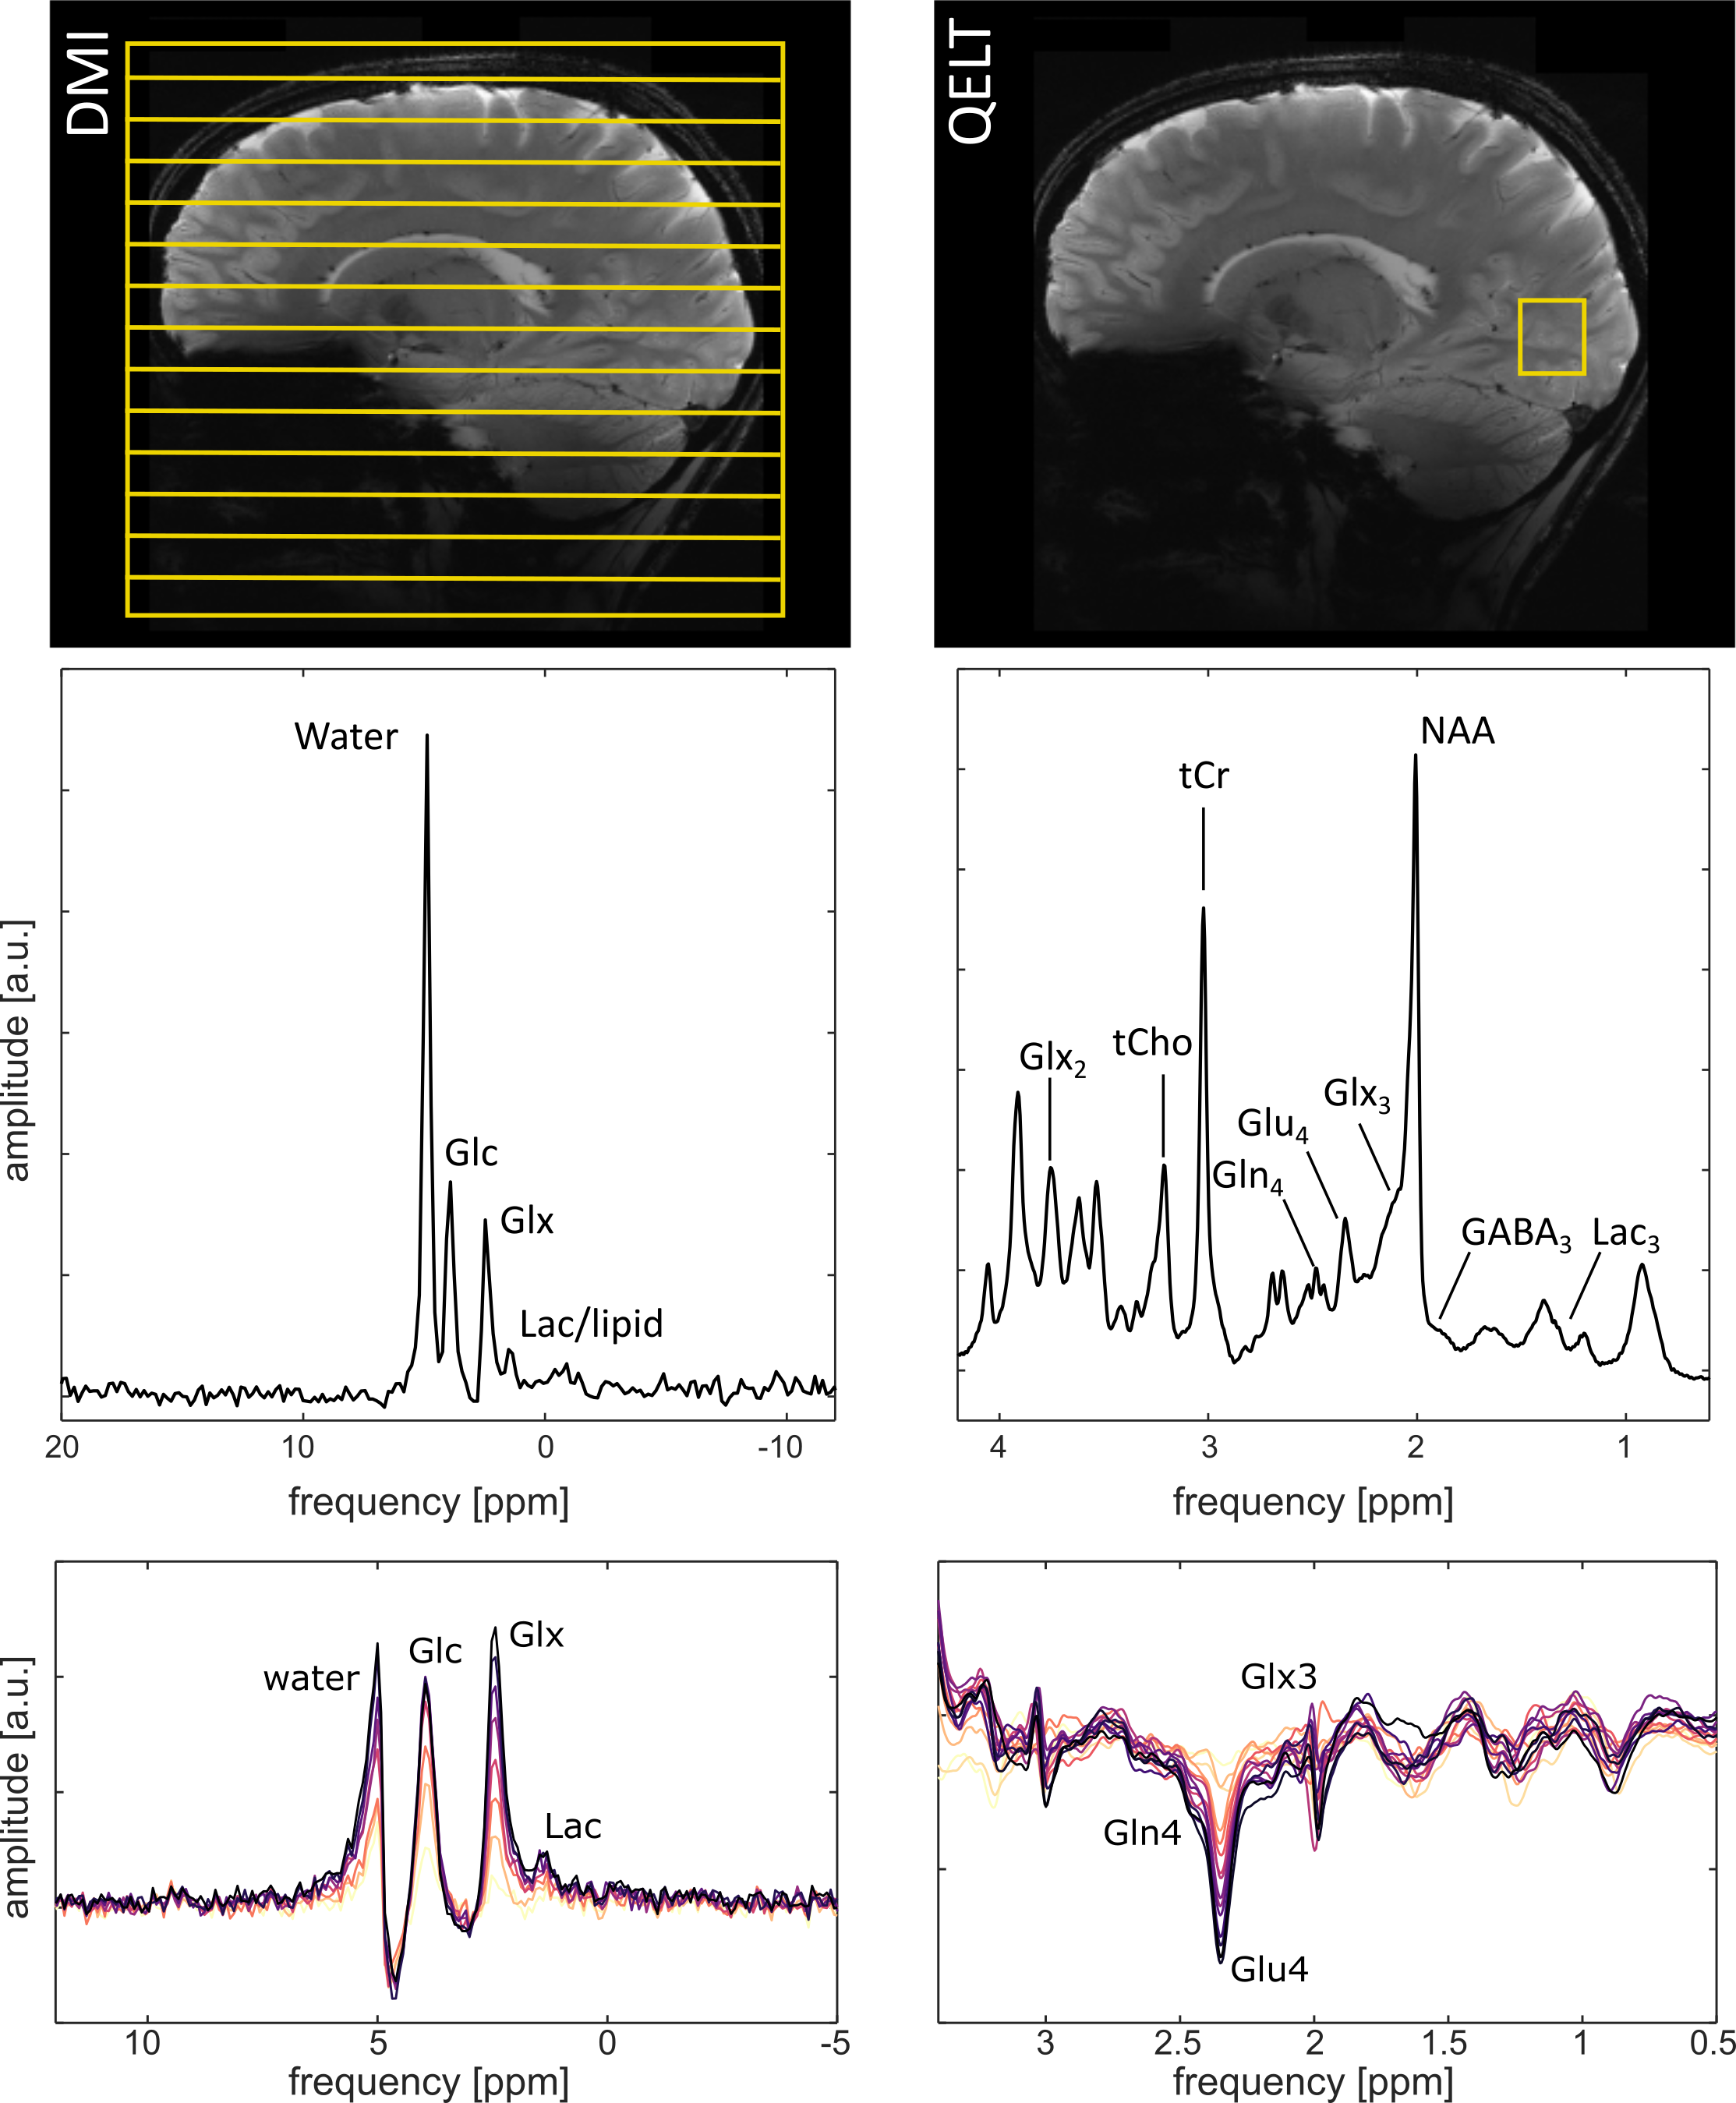
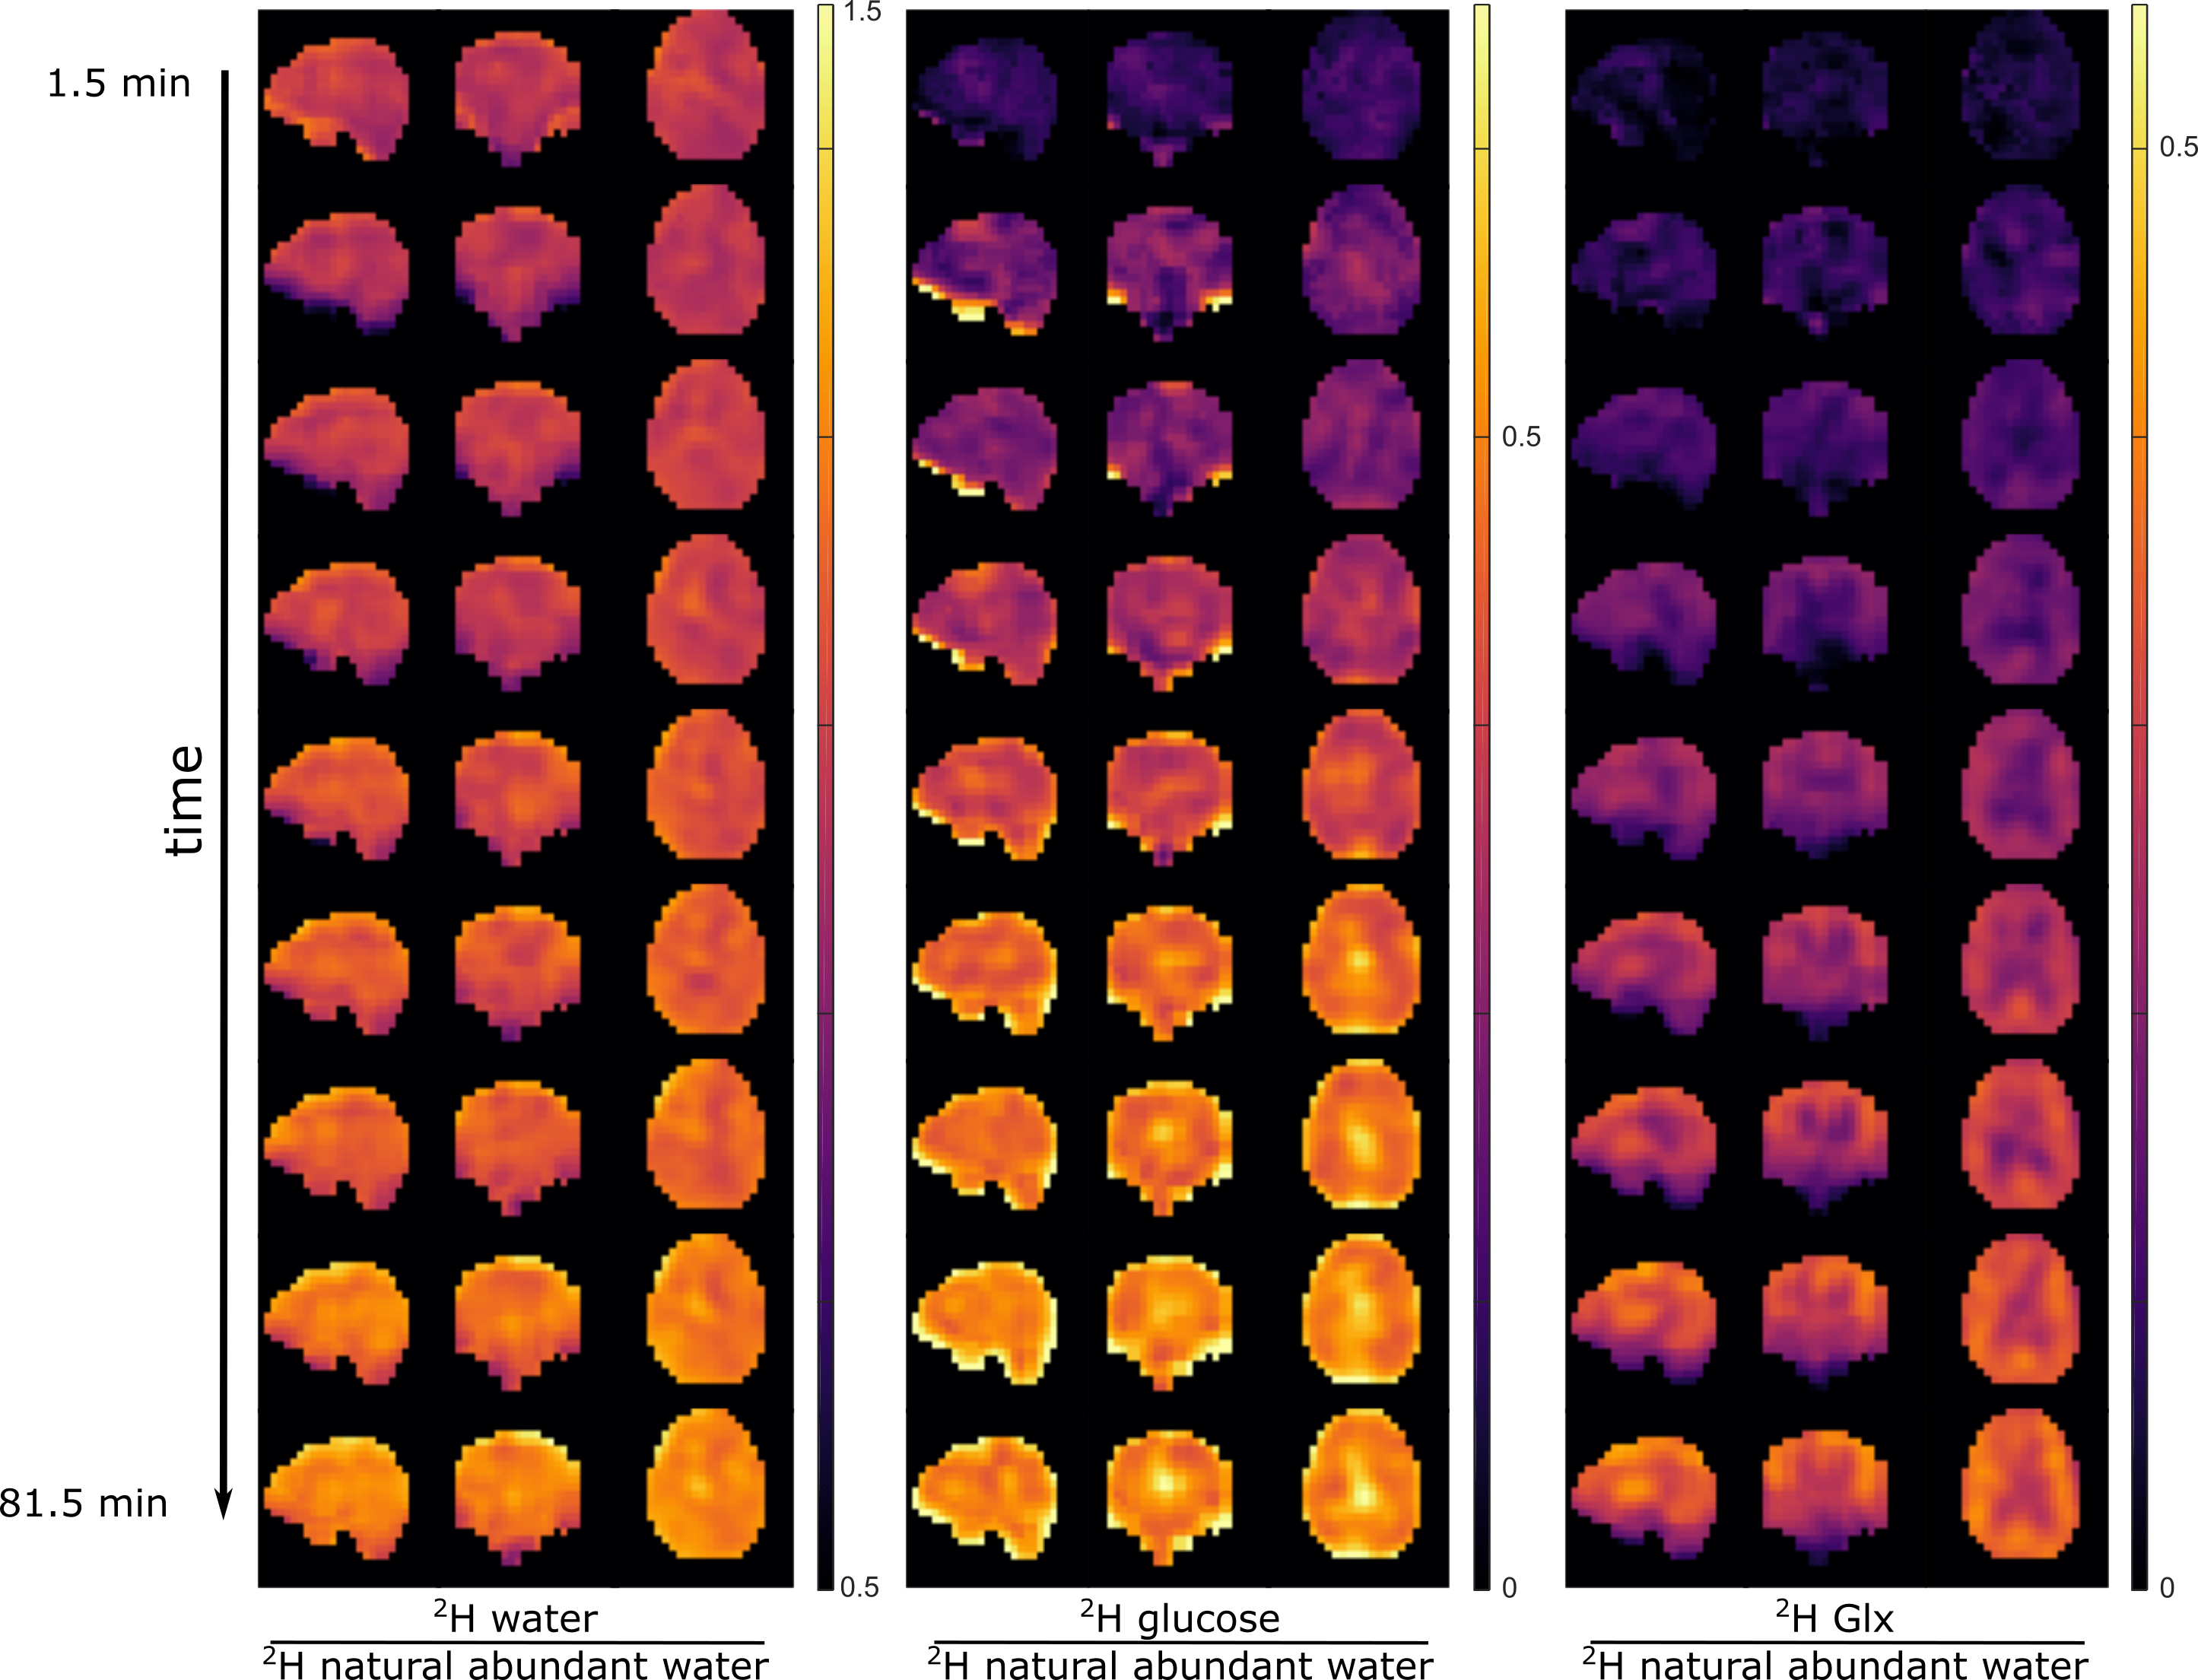
Exemplary DMI and QELT spectra are shown in Fig. 1. The upper row shows the positioning of the FoV of the DMI as well as the voxel in QELT acquisitions for an exemplary volunteer. Whole brain deuterium images derived from DMI are shown in Figure 2.In the lower row of Fig. 1, averaged difference spectra over all volunteers (n=6) are shown for DMI and QELT. Clear uptakes in 2H labeling are detectable for water, Glc and Glx in the DMI data, while a small increase is visible for the Lac resonance. The QELT difference spectra show a decrease in signal intensity for Gln4 and Glu4, while a smaller decrease is detectable for Glx3.
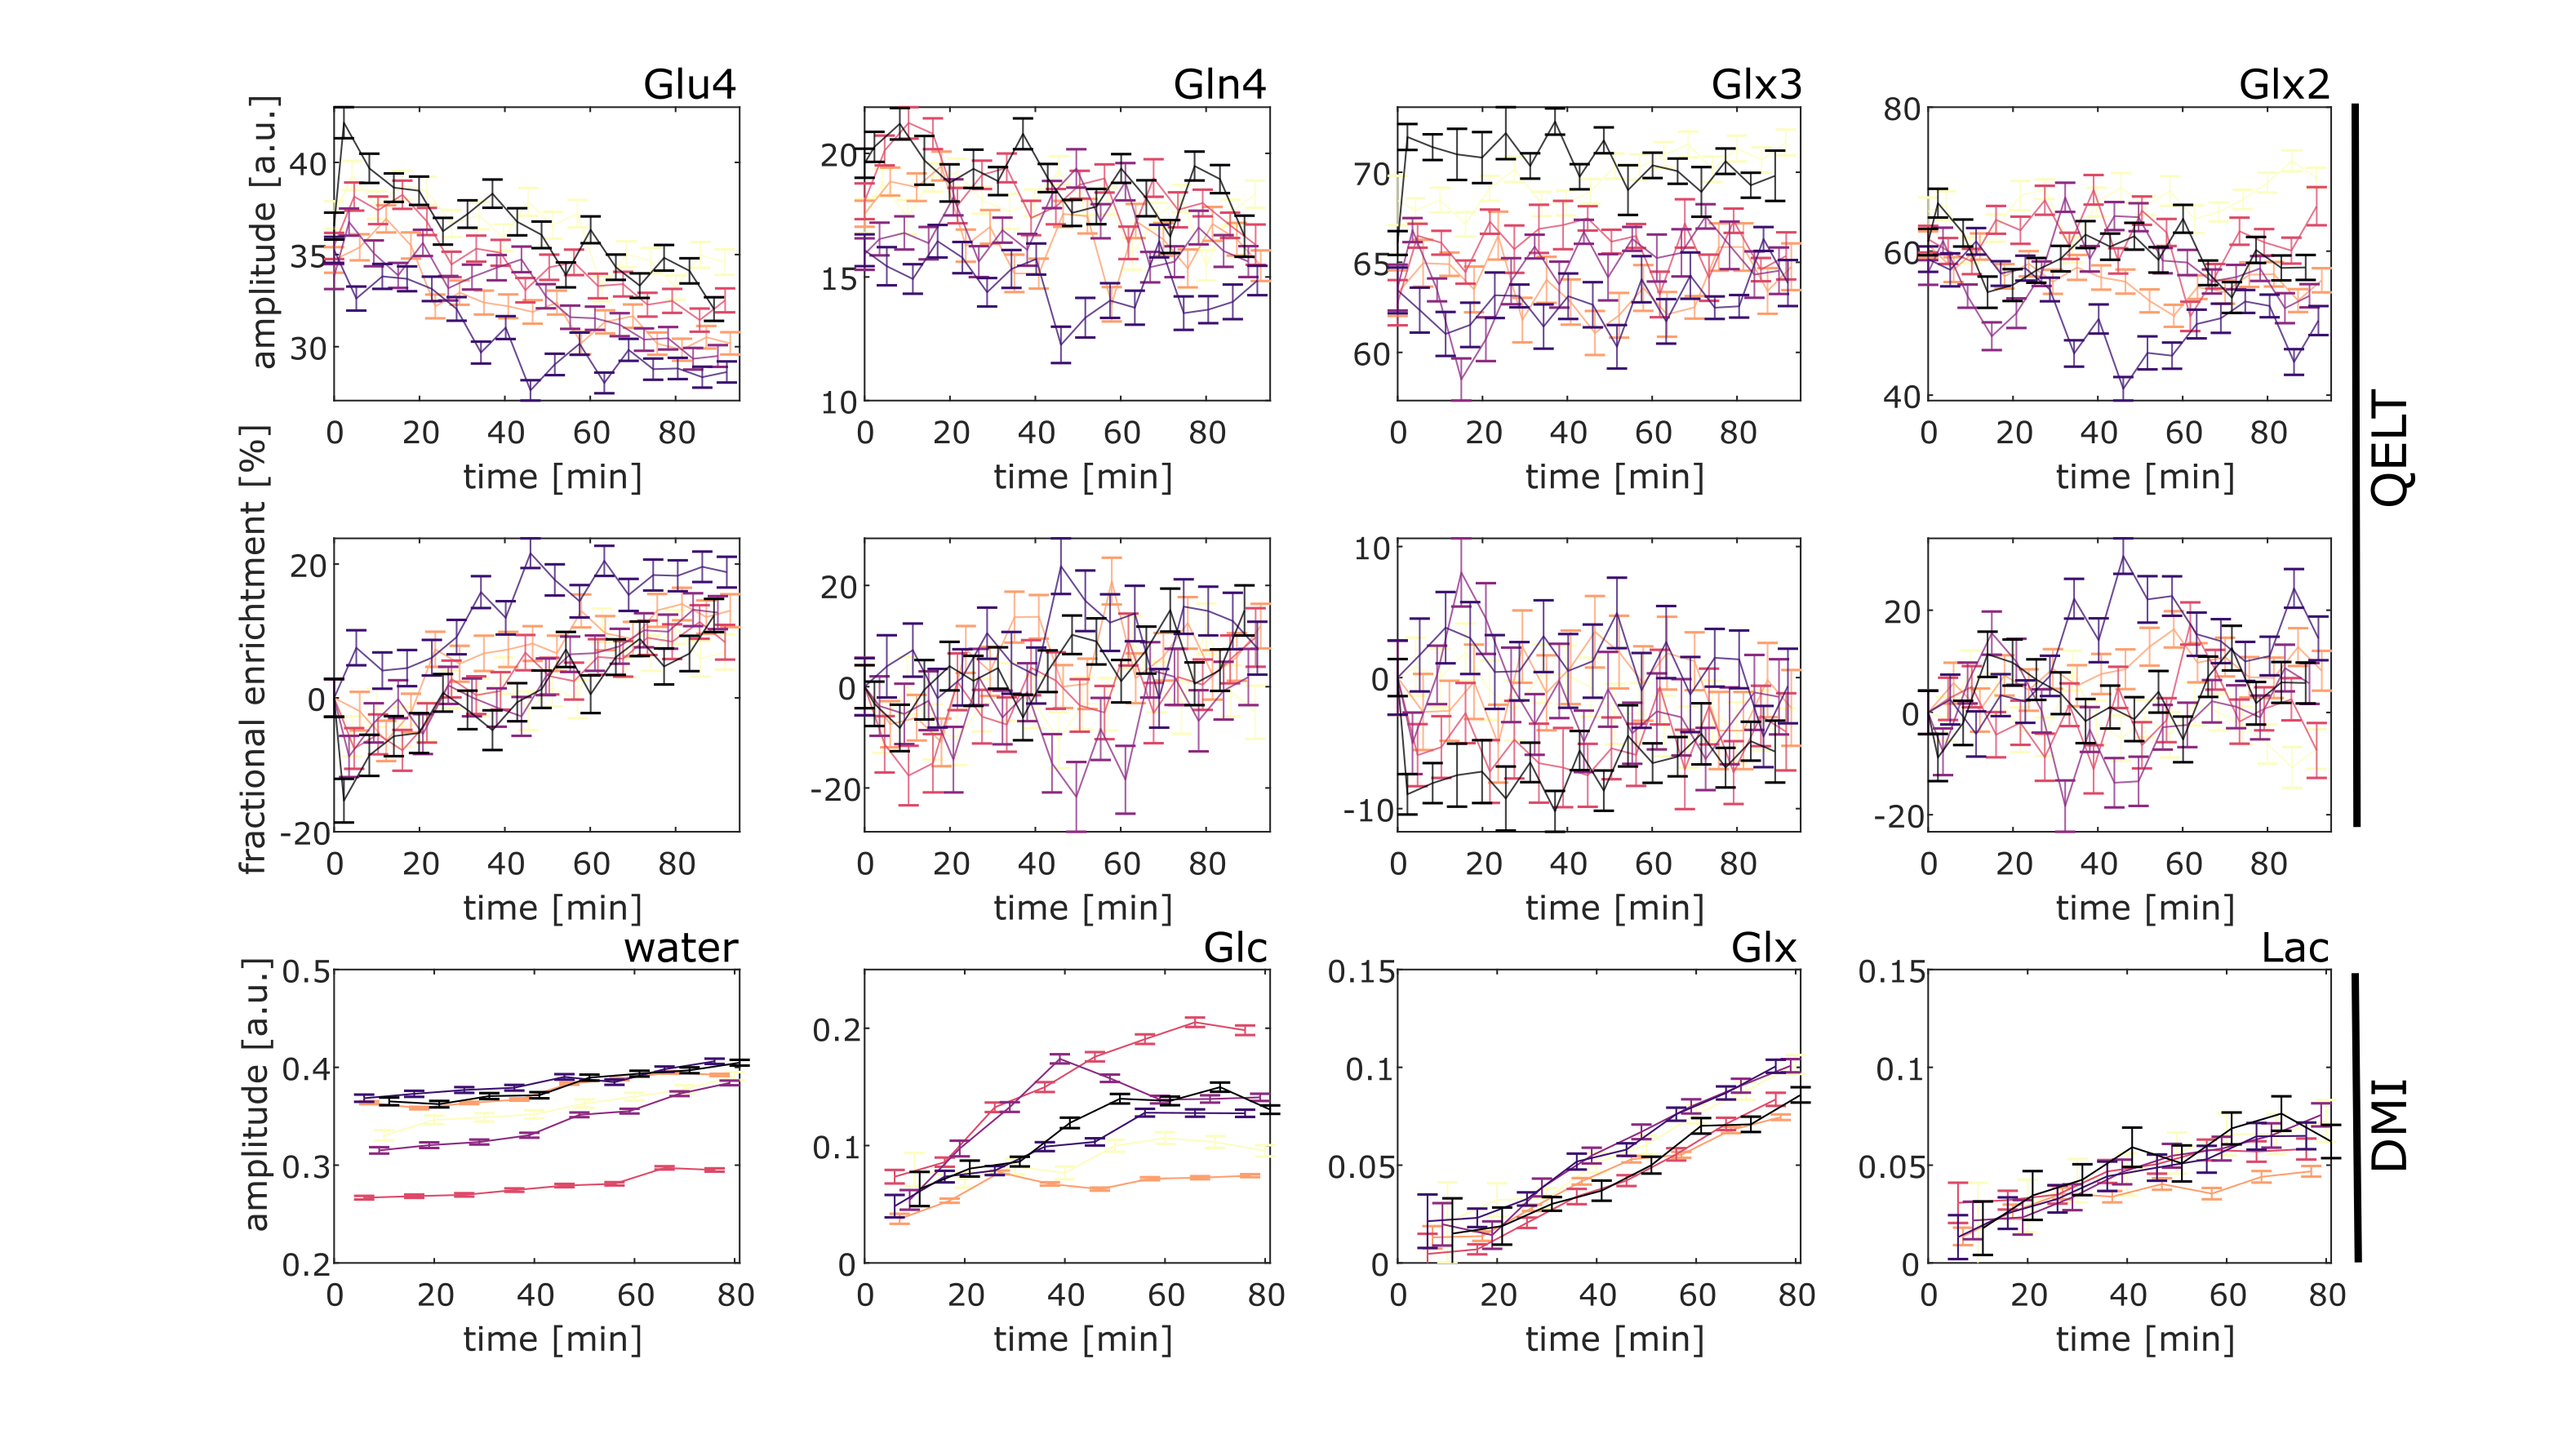
The signal amplitudes and fractional enrichments for QELT for the above mentioned metabolites are plotted in Fig. 3. The fractional enrichments for the QELT experiments were calculated relative to the baseline metabolite concentrations measured before the oral administration of 2H labeled glucose. An uptake in fractional enrichment can be detected with QELT for Glu4, potentially a small increase is also detectable for Gln4. Fig. 3 also shows the signal amplitudes for DMI for all individual volunteers. Signal amplitude increases are detectable for deuterated water, Glc, Glx and Lac.
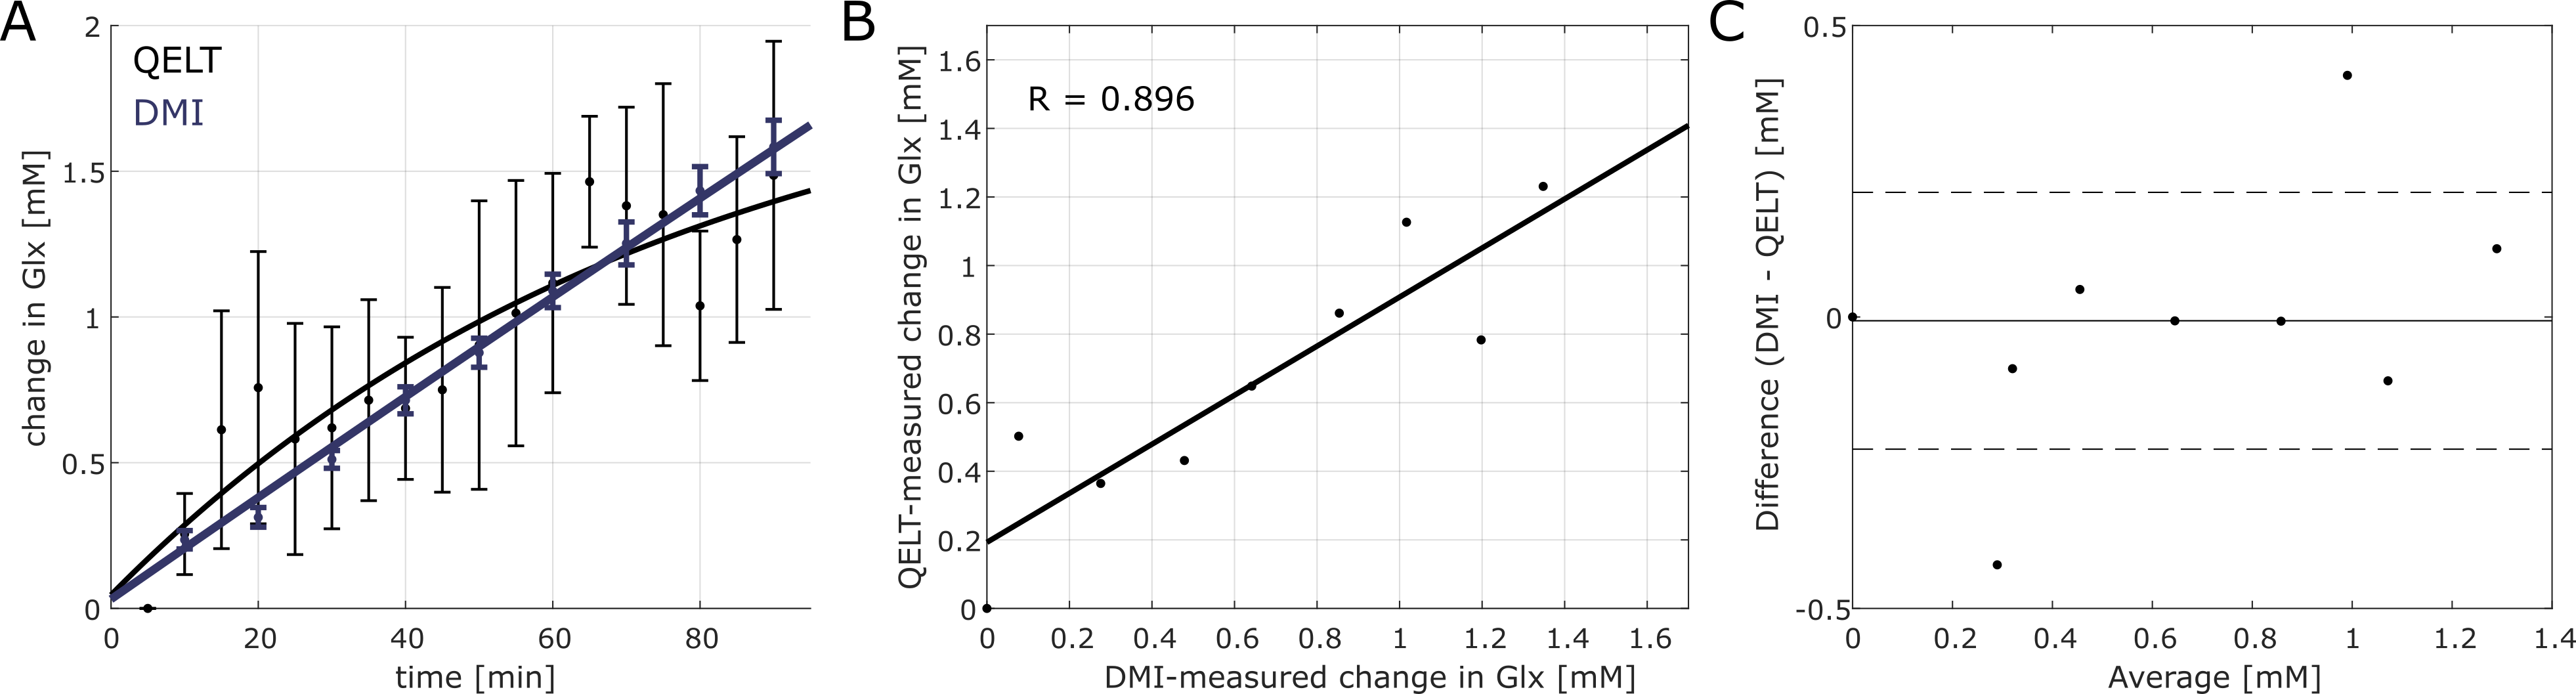
In a last step, concentration changes were estimated for 2H labeled Glx measured with QELT and DMI using internal water referencing. To calculated concentration changes for 2H labeled Glx with QELT, all Gln and Glu resonances were considered. The result are presented in Fig. 4. Shown are the changes in 2H labeled Glx concentrations measured with both methods, as well as a corresponding correlation plot and Bland-Altman plot. A Pearson’s correlation analysis revealed a high correlation between both measurements (R = 0.896).
Conclusion:
First QELT data measured at 9.4 Tesla from the human brain of healthy subjects were presented and compared to DMI. 2H labeling uptakes after oral intake of [6,6’-2H2]-glucose were detectable for both methods. The concentration changes of 2H labeled Glx were consistent between both methods.Acknowledgements
Funding by the ERC Starting Grant (SYNAPLAST MR, Grant Number: 679927) of the European Union and the Cancer Prevention and Research Institute of Texas (CPRIT, Grant Number: RR180056) is gratefully acknowledged. Part of the data was presented in an earlier publication4.References
[1] Rich, LJ, Bagga, P, Wilson, NE, et al. 1H magnetic resonance spectroscopy of 2H-to-1H exchange quantifies the dynamics of cellular metabolism in vivo. Nature Biomedical Engineering 2020;4:335 - 342 doi:0.1038/s41551-019-0499-8.
[2] De Feyter, HM, Behar, KL, Corbin, ZA, et al. Deuterium metabolic imaging (DMI) for MRI-based 3D mapping of metabolism in vivo. Science Advances 2018;4(8):eaat7314 doi:10.1126/sciadv.aat7314.
[3] Lu, M, Zhu, X-H, Zhang, Y, et al. Quantitative assessment of brain glucose metabolic rates using in vivo deuterium magnetic resonance spectroscopy. Journal of Cerebral Blood Flow & Metabolism 2017;37(11):3518-3530 doi:10.1177/0271678X17706444.
[4] Ruhm, L, Avdievich, N, Ziegs, T, et al. Deuterium metabolic imaging in the human brain at 9.4 Tesla with high spatial and temporal resolution. NeuroImage 2021;244:118639 doi:https://doi.org/10.1016/j.neuroimage.2021.118639.
[5] Vanhamme, L, van den Boogaart, A, Van Huffel, S. Improved Method for Accurate and Efficient Quantification of MRS Data with Use of Prior Knowledge. Journal of Magnetic Resonance 1997;129:35 – 43.
[6] Pfrommer, A, Avdievich, N, Henning, A. Four Channel Transceiver Array for Functional Magnetic Resonance Spectroscopy in the Human Visual Cortex at 9.4 T. In: Proceedings of the Joint Annual Meeting ISMRM-ESMRMB, 2014, Milano, Italy 2014;22:1305.
[7] Dorst, J, Borbath, T, Henning, A. Simultaneous Detection of Metabolite Concentration Changes, Water BOLD Signal and pH Changes during Visual Stimulation in the Human Brain at 9.4T. In: Proceedings of the Joint Annual Meeting ISMRM-ESMRMB, 2021, Virtual Meeting 2021:339.
[8] Provencher, SW. Estimation of metabolite concentrations from localized in vivo proton NMR spectra. Magnetic Resonance in Medicine 1993;30(6):672-679 doi:https://doi.org/10.1002/mrm.1910300604.
[9] Penny, W, Friston, K, Ashburner, J, et al. Statistical Parameter Mapping: The Analysis of Functional Brain Images - 1st Edition. Academic Press 2006.
Figures