0129
Curve shape analysis of dynamic glucose enhanced (DGE) and dynamic contrast enhanced (DCE) MRI in patients with brain tumor
Anina Seidemo1, Ronnie Wirestam1, Gunther Helms1, Karin Markenroth Bloch2, Xiang Xu3,4, Johan Bengzon5,6, Pia C. Sundgren2,7,8, Peter C.M. van Zijl3,9, and Linda Knutsson1,3,9
1Department of Medical Radiation Physics, Lund University, Lund, Sweden, 2Lund University Bioimaging Center, Lund University, Lund, Sweden, 3Russell H. Morgan Department of Radiology and Radiological Science, Johns Hopkins University School of Medicine, Baltimore, MD, United States, 4BioMedical Engineering and Imaging Institute, Icahn School of Medicine at Mount Sinai, New York, NY, United States, 5Lund Stem Cell Center, Department of Clinical Sciences, Lund University, Lund, Sweden, 6Division of Neurosurgery, Department of Clinical Sciences, Lund University and Skåne University Hospital, Lund, Sweden, 7Department of Medical Imaging and Physiology, Skåne University Hospital, Lund and Malmö, Sweden, 8Diagnostic Radiology, Department of Clinical Sciences, Lund University, Lund, Sweden, 9F.M. Kirby Research Center for Functional Brain Imaging, Kennedy Krieger Institute, Baltimore, MD, United States
1Department of Medical Radiation Physics, Lund University, Lund, Sweden, 2Lund University Bioimaging Center, Lund University, Lund, Sweden, 3Russell H. Morgan Department of Radiology and Radiological Science, Johns Hopkins University School of Medicine, Baltimore, MD, United States, 4BioMedical Engineering and Imaging Institute, Icahn School of Medicine at Mount Sinai, New York, NY, United States, 5Lund Stem Cell Center, Department of Clinical Sciences, Lund University, Lund, Sweden, 6Division of Neurosurgery, Department of Clinical Sciences, Lund University and Skåne University Hospital, Lund, Sweden, 7Department of Medical Imaging and Physiology, Skåne University Hospital, Lund and Malmö, Sweden, 8Diagnostic Radiology, Department of Clinical Sciences, Lund University, Lund, Sweden, 9F.M. Kirby Research Center for Functional Brain Imaging, Kennedy Krieger Institute, Baltimore, MD, United States
Synopsis
Dynamic glucose-enhanced (DGE) MRI provides time intensity curves after D-glucose injection and is promising as a less invasive alternative or complement to dynamic contrast-enhanced (DCE) MRI. Here, we calculated non-model-based parameter maps from DGE and DCE MRI of human brain tumors, and created color-coded “curve maps”, a graphic representation of different curve shapes, to further investigate temporospatial enhancement patterns. The results show that DGE MRI can differentiate tumor from healthy brain tissue, that DGE and DCE give similar but not identical information, and that the proposed curve map approach has potential to aid in visual assessment of dynamic images.
Introduction
Dynamic glucose-enhanced (DGE1) MRI uses chemical exchange saturation transfer (CEST2,3) to study time intensity curves after D-glucose injection4,5, and the technique has shown potential as a biodegradable alternative to gadolinium contrast enhanced imaging approaches6, such as dynamic contrast-enhanced (DCE) MRI. Previous work has compared DGE and DCE MRI qualitatively1, highlighting the opportunity to use DGE MRI for perfusion and/or permeability imaging. The tissue uptake kinetics of D-glucose differ from gadolinium7 and it is relevant to investigate the relationship between the two techniques in terms of temporospatial enhancement patterns.In this work, we calculated non-model-based (semiquantitative) parameters from DGE and DCE MRI data acquired in brain tumor patients. Furthermore, we created color-coded “curve maps” showing the spatial distribution of different curve shapes, based on the idea that DCE curve shape characteristics differ between tissues8.
This study aims to provide a first step towards answering the following questions:
I. Can DGE MRI differentiate tumor from normal tissue?
II. Can DGE MRI provide information that is similar or complementary to DCE?
III. Can curve shape analysis (curve maps) provide additional valuable information, for DGE as well as DCE?
Methods
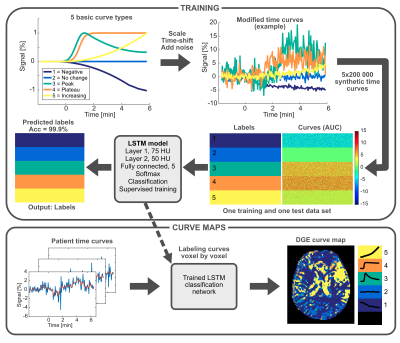
Written informed consent was obtained from six glioma patients, scanned on a 7 T scanner (Achieva, Philips). Single slice DGE images with spatial resolution 2x2x6 mm3, were acquired and calculated as previously reported4. Dextrose (D50, 50 mL) was administered intravenously at a rate of 1 mL/s. DCE images were acquired using a 3D gradient-echo sequence, and gadoterate meglumine (0.1 mmol/kg body weight) was injected at a rate of 5 mL/s. The temporal resolution was 5 s for DGE and 4 s for DCE.To create curve maps, DGE and DCE time curves were classified per voxel as one out of five predefined curve types using a bidirectional Long Short-Term Memory (LSTM9) network, trained on 1 million synthetic time curves. The process is described in Figure 1. Non-model-based DGE and DCE parameter maps, i.e. peak post-injection signal (Smax), mean area under curve (AUC), and time to peak (TTP), were calculated per voxel over the first 6 minutes from the start of the injection.
T1w post-gadolinium and DCE images were resliced to the orientation of the DGE images. Regions-of-interests (ROIs) were drawn in enhancing regions (tumor) and in contralateral normal-appearing white matter (NAWM), identified in the T1w post-gadolinium images. The same ROIs were used for all parameter maps and curve maps, and the average and standard deviation were calculated within each ROI. The relative contributions of curve types, expressed as the fraction of the total number of voxels in each ROI, were calculated from the curve maps. Tumor and NAWM values were compared using two-sided Wilcoxon signed-rank tests.
Results & Discussion
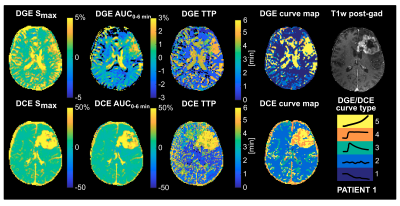
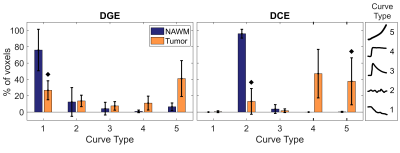
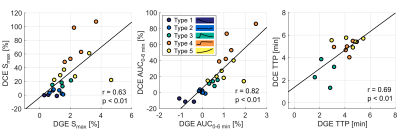
Non-model-based parameter and curve maps of one patient are shown in Figure 2. Enhancement in lesions is visible in all parameter maps, and DGE and DCE enhancement is partially overlapping. The curve maps and TTP maps are similar, but the curve maps have a less noisy appearance. The curve maps are expected to be less sensitive to signal spikes caused by movements than the parameter maps because the overall features are studied.The averaged relative distributions of curve types in tumor and NAWM are shown in Figure 3. Most DGE curves in NAWM were of type 1 (76%), with some contribution from type 2 (12%). The curve type distribution was more heterogenous in the tumor, with type 5 being most common (41%). DCE in NAWM included mainly type 2 curves (96%), while tumor tissue had dominantly type 4 (47%) and type 5 (38%) curves. When curve types 4 and 5 were grouped together, there was a significant difference (p<0.005) between tumor and NAWM for both DGE and DCE. Altogether, this indicates that curve maps can successfully differentiate tumor from normal tissue, based on differences in temporal enhancement patterns. Figure 4 shows averaged non-model-based parameters in tumor and NAWM for all patients. A significant difference between NAWM and tumor was found in all cases (p<0.05), except for DGE TTP, which only showed a trend (p=0.06). The scatter plots (Figure 5) reveal that type 4 gives the highest DCE signal change, while the typical DGE signal change was similar for type 4 and 5.
DGE and DCE tumor curves were classified as the same curve type in 23% of the cases. Plausible reasons for this discrepancy are: i) the different uptake kinetics of D-glucose and gadolinium, leading to different enhancement patterns, ii) the negative signal (type 1) in DGE, which is rarely seen in DCE, and iii) the slower injection and thus delayed response in DGE. The results demonstrate the feasibility and potential of using curve maps for DCE and DGE, and, in line with previous research6,10, that DGE MRI can differentiate tumor from normal tissue.
Conclusion
I. DGE MRI can differentiate tumor from normal brain tissue in humans.II. DGE enhancement was similar but not identical to DCE and was not entirely confined to the same enhancing regions.
III. The curve map approach could differentiate tumor from NAWM based solely on temporal enhancement patterns and can facilitate visual assessment of DGE and DCE images.
Acknowledgements
No acknowledgement found.References
1. Xu X, Chan KW, Knutsson L, et al. Dynamic glucose enhanced (DGE) MRI for combined imaging of blood-brain barrier break down and increased blood volume in brain cancer. Magn Reson Med. 2015;74(6):1556-1563.2. Ward KM, Aletras AH, Balaban RS. A new class of contrast agents for MRI based on proton chemical exchange dependent saturation transfer (CEST). J Magn Reson. 2000;143(1):79-87.
3. Zhou J, van Zijl PCM. Chemical exchange saturation transfer imaging and spectroscopy. Prog NMR Spectr. 2006;48(2-3):109-136.
4. Knutsson L, Seidemo A, Rydhög Scherman A, et al. Arterial input functions and tissue response curves in dynamic glucose-enhanced (DGE) imaging: Comparison between glucoCEST and blood glucose sampling in humans. Tomography. 2018;4(4):164-171.
5. Seidemo A, Lehmann PM, Rydhög A, et al. Towards robust glucose chemical exchange saturation transfer imaging in humans at 3 T: Arterial input function measurements and the effects of infusion time. NMR in Biomed. 2021;e4626.
6. Xu X, Yadav NN, Knutsson L, et al. Dynamic glucose-enhanced (DGE) MRI: Translation to human scanning and first results in glioma patients. Tomography. 2015;1(2):105-114.
7. Chan KW, McMahon MT, Kato Y, et al. Natural D-glucose as a biodegradable MRI contrast agent for detecting cancer. Magn Reson Med. 2012;68(6):1764-1773.
8. Barnes SL, Whisenant JG, Loveless ME, Yankeelov TE. Practical dynamic contrast enhanced MRI in small animal models of cancer: data acquisition, data analysis, and interpretation. Pharmaceutics. 2012;4(3):442-478.
9. Hochreiter S, Schmidhuber J. Long short-term memory. Neural Comput. 1997;9:1735-1780.
10. Paech D, Schuenke P, Koehler C, et al. T1rho-weighted dynamic glucose-enhanced MR imaging in the human brain. Radiology. 2017;285(3):914-922.
Figures

Figure 1. Overview of the process for calculating curve maps. Five different basic curve shapes were defined and subsequently modified (scaled, time-shifted and added noise) to create one training and one test data set of 1 million synthetic time curves each. A bidirectional LSTM network was trained on synthetic time curves and corresponding labels (curve types 1-5). Real patient time curves were then presented to the trained network, and each curve was classified, creating a curve map.

Figure 2. Non-model-based parameter maps and curve maps of one glioma patient. Top row: DGE maps and post-gad T1w image. Bottom row: DCE maps. The five different curve types and their corresponding colors are depicted on the lower right. Type 1: Decreasing signal evolution; Type 2: Enhancement is close to zero or shows no particular pattern; Type 3: Peak, an initial increase followed by a decrease; Type 4: Plateau, an increase followed by relatively constant enhancement; Type 5: A continuous increase.

Figure 3. Relative distribution of curve types in normal appearing white matter (NAWM) and tumor, averaged over all patients (n=6). The black diamonds denote p<0.05 when comparing tumor to NAWM using Wilcoxon signed-rank tests. The five different curve types are illustrated to the right.

Figure 4. Non-model-based parameters Smax, AUC and TTP in normal appearing white matter (NAWM) and tumor, averaged over all patients (n=6). The DCE Smax and DCE AUC values have here been divided by 10 for display reasons. The black diamonds denote p<0.05 when comparing tumor to NAWM using Wilcoxon signed-rank tests.

Figure 5. Scatter plots with correlation analysis of averaged DGE and DCE non-model-based parameters within each curve type in the tumor ROI. Each patient is represented by one dot for each curve type. Curve types 1 and 2 were excluded from the TTP plot as they are not expected to have a meaningful peak.
DOI: https://doi.org/10.58530/2022/0129